
Looking to build wealth
Investment Platform specialist, Netwealth (ASX:NWL), has entered our radar as of late following the release of the company’s September 2018 trading update showing that it has gained additional momentum. It’s also worth noting that the shares have dropped some 21.9% since its 52-week high of $9.99 last 05 June. Perhaps it’s time to make an entry?
Last week, Netwealth (ASX:NWL) filed a Trading Update on its Quarterly performance and we see some strong momentum marking a solid start for the FY19. According to the filing, the company saw a $1.1 billion in net Funds Under Administration (FUA) inflows and 28.7% higher from the year ago period’s pace. This has resulted in FUA increasing by $1.3 billion to a record $19.28 billion for the company.
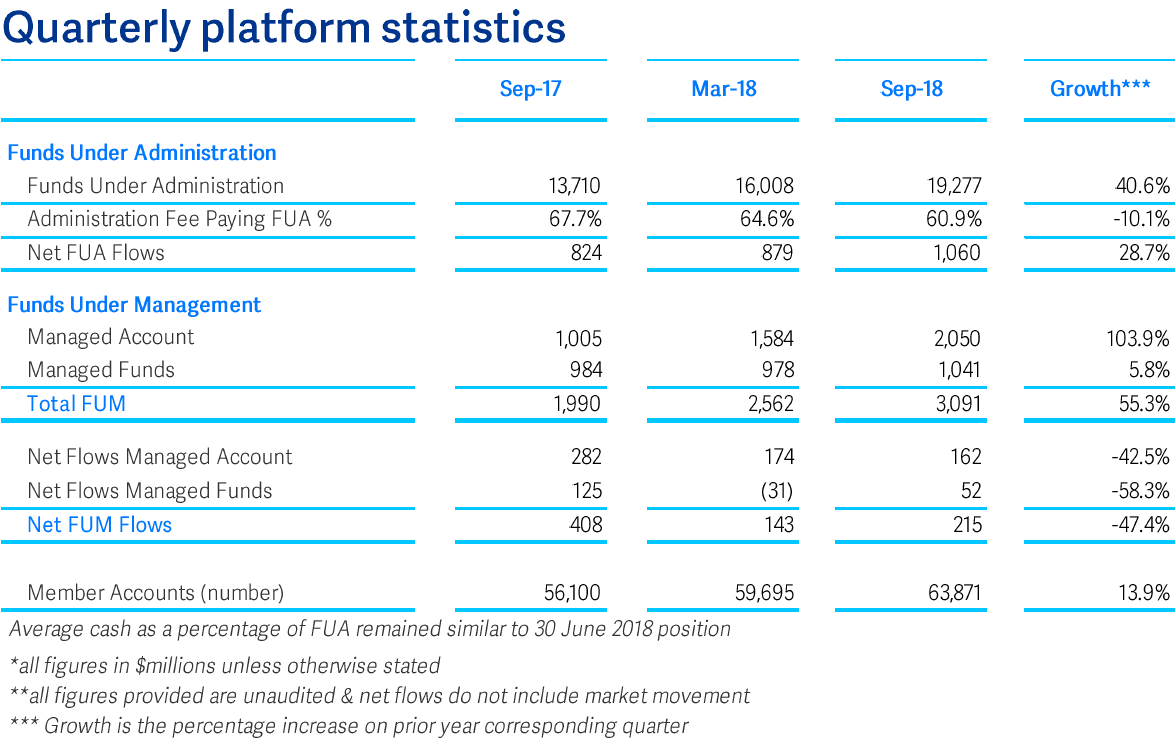
Source: 11 October 2018 Company Filing
This result has prompted us to take a look at the company which is a strong player in the Investment Platform space which is benefitting from the secular shift by Financial Advisors out of big banks towards independent players. This is especially so in the wake of the “Royal Commission into Misconduct in the Banking, Superannuation and Financial Services Industry” where big banks are under greater scrutiny for improper conduct such as ‘fees for no service’.
There was also a brief shakeup early in the year when Westpac’s (ASX.WBC) Wealth Management arm, BT Financial Group (BTFG), issued marketing gimmick that hinted at a price war and caused share prices in the sector to drop. We did address this issue in our other reports in the sector from HUB24, Fiducian, Praemium and OneVue.
As we noted, it was mostly a marketing gimmick and the rest of the market managed to catch on as shares in the sector staged a recovery. Prior to finalising our view, let’s go through the company’s background and recent financial performance:
Company Overview
Netwealth (ASX:NWL) was founded back in 1999 by brothers Michael Max Heine and his brother Leslie Heine providing wealth management software and financial products to financial advisors focussing on ease of use and compliance.
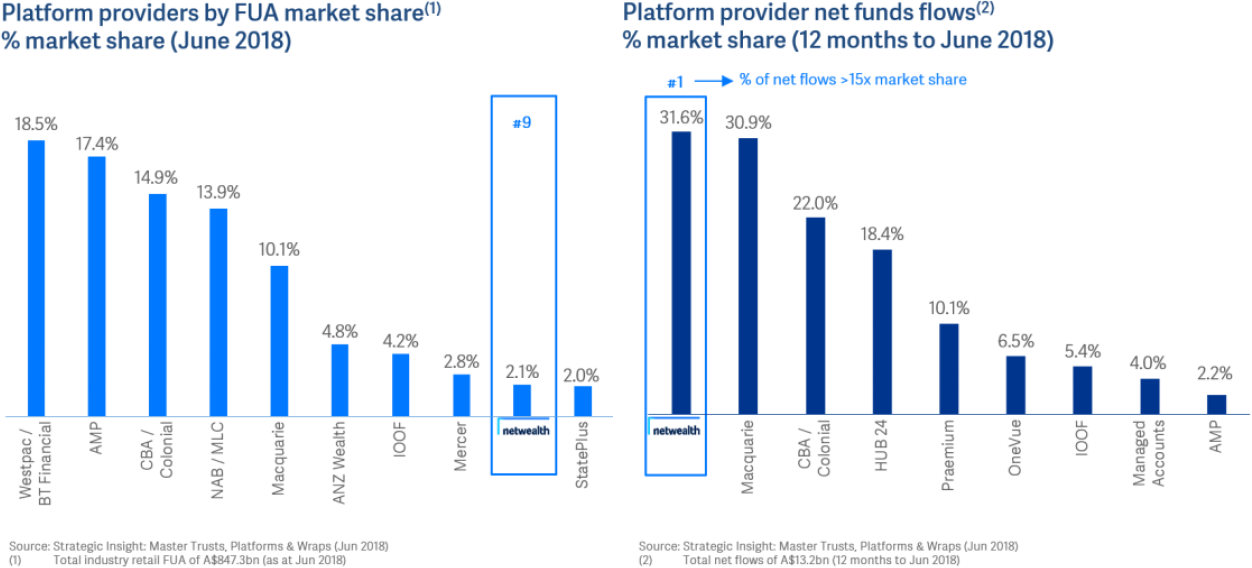
The company has since company come a long way to become one of the fastest growing players in the Investment Platform now taking up the 9th largest spot and from 5 staff in 1999 to now over 220.
Netwealth (ASX:NWL) is now run by a father-son duo with Michael (picture below, left) and his son Matthew Alexander Heine (below right) who joined the company in July 2001. Both men have had extensive experience in the financial services and are backed by a strong team with diverse backgrounds. Mr Michael is largely responsible for Finance, IT, Operations, Human Resources and Compliance while Mr Matthew handles the Marketing and Product side of the business.
The image below shows the pair celebrating the company’s successful listing back in November 2017:
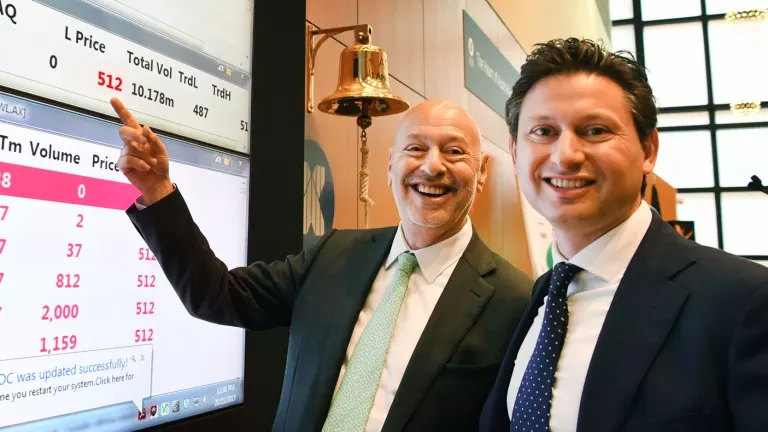
Image Credit: Peter Braig | Australian Financial Review
The company remains closely held by the Heine family who they (Michael, Leslie and Matthew) collectively own over 63.6% of the 237.68 million outstanding shares. Companies where founders have large holdings tend to (but not always) behave in the best interests for the shareholders (which include them after all) and look toward the long-term.
The company’s product and service offerings revolve around a web-based investment technology that provides Financial Advisors an all-in-one platform where they can Trade and provide Administrative and Reporting solutions to their clients. The graphic below illustrates a sampling of the company’s Wealth Management tools:
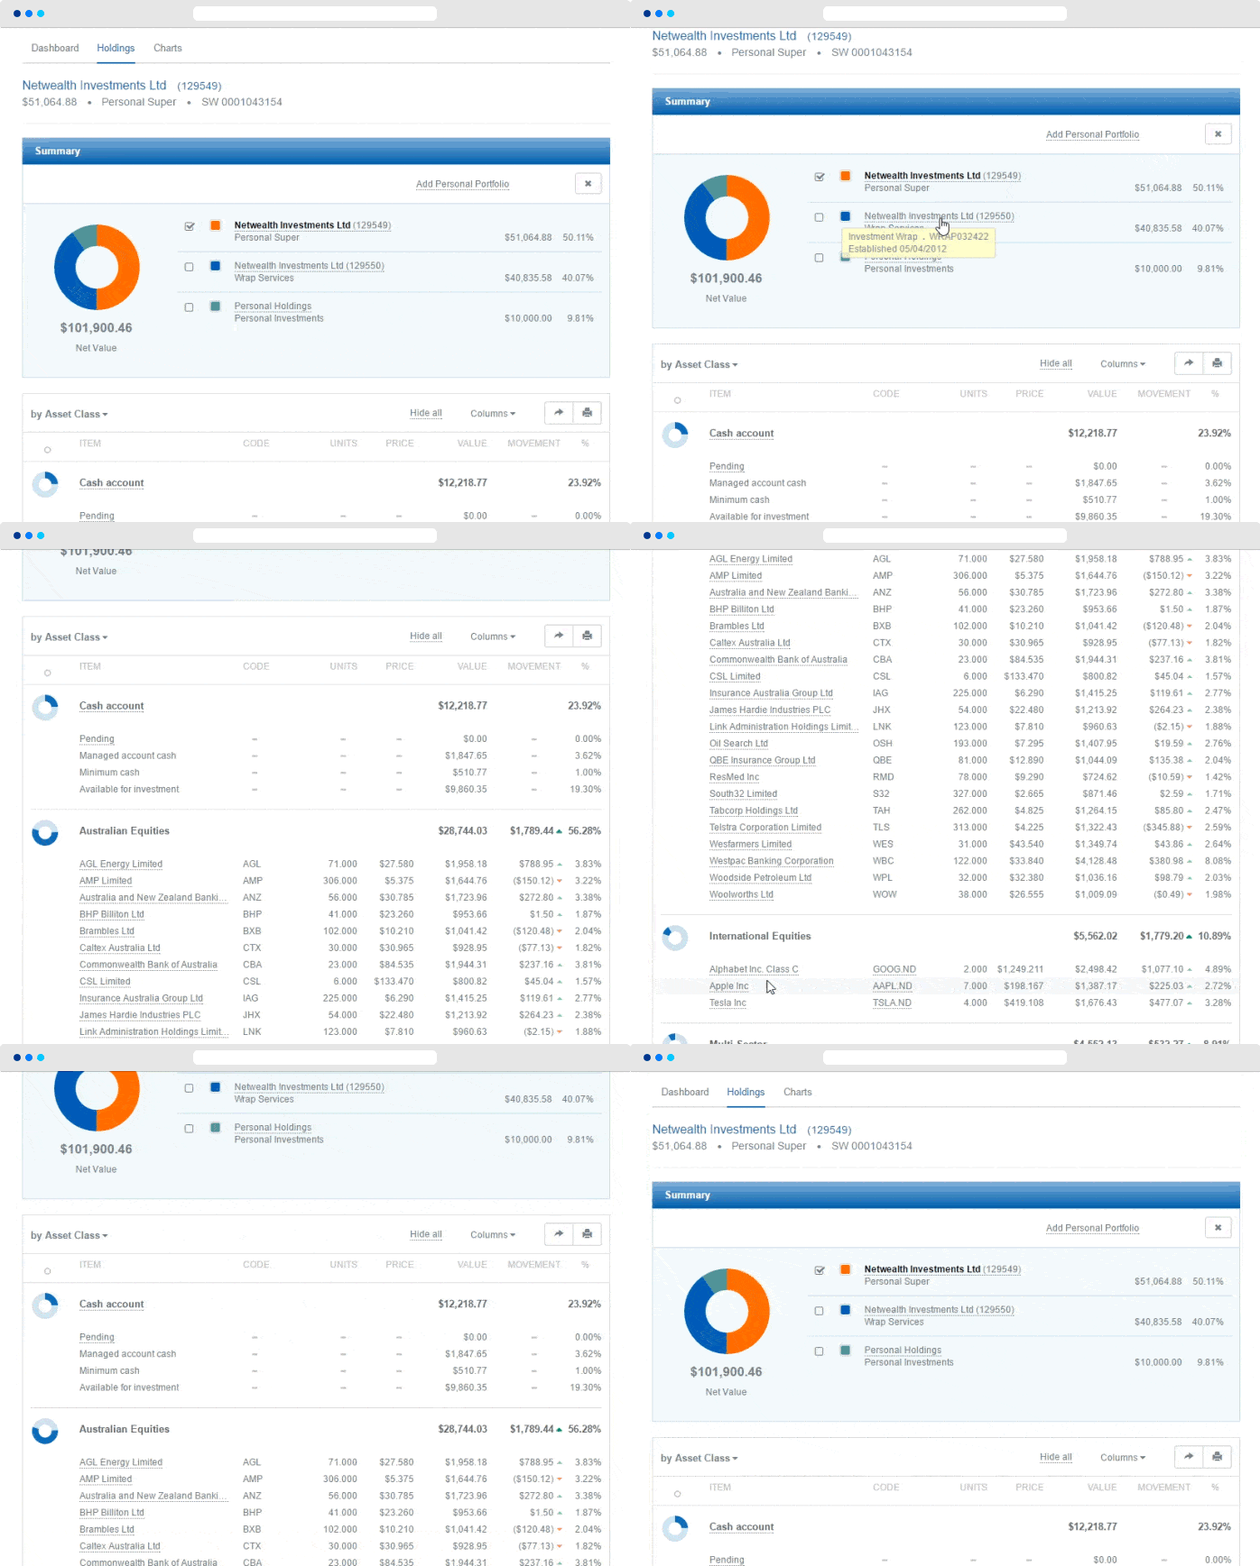
Source: Company Website
The company primarily splits its offerings between Personal Investors and Financial Advisors to monitor, invest and manage the Superannuation portfolios. Other services include a feature to consolidate all the client’s investments into one account for tax and reporting purposes (Wrap) and Managed Funds wherein the company selects specialist investment managers to invest the funds via their respective mandates.
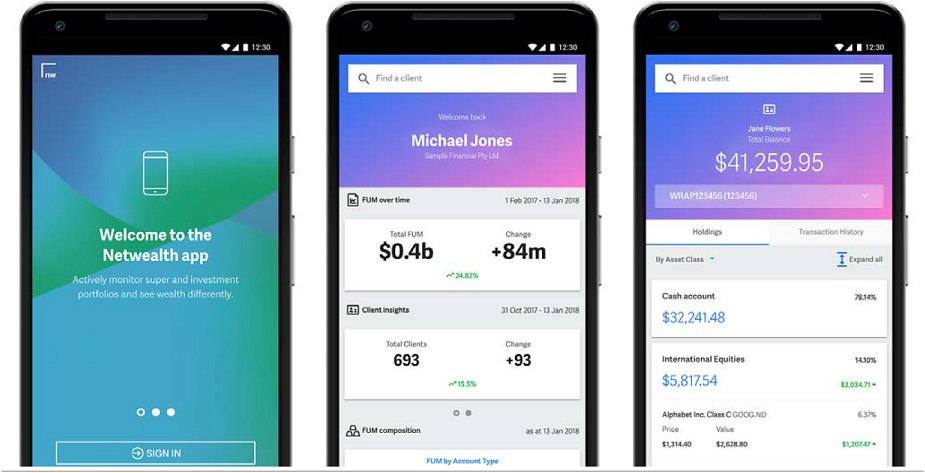
Image Credit: 27 August 2018 Annual Report
The products can also be accessed via mobile, implemented in January 2018, which gives Financial Advisors, who are often on-the-go, a handy tool in their course of business. Unsurprisingly, this commitment to make it easier for Financial Advisors has allowed the company to gain some market share which has made it the 9th largest Platform provider and raking in the lion’s share of Fund Inflows:
Source: 11 October 2018 Company Filing
The company also continues to earn sector awards with the company earning the #1 rank for functionality for a 3rd year in a row (as at 2017 December) by Investment Trends’ Benchmarking Report and also earned user accolades with the highest score in overall satisfaction from Financial Advisors for the 7th year consecutive year according to the Investment Trends’ 2018 Planner tech report.
The company generates revenues through fees from:
(i) Administration Fees which are recurring (monthly) and charged directly to the client accounts for maintaining and servicing the account. They’re also charged as a percentage of Funds Administered (FUA) and counts cash accounts, term deposits, managed fund investments, ASX listed securities, international securities and managed accounts. This provides most (~58%) of revenues.
Next is (ii) Ancillary Fees which provide the second largest source at circa 33% of revenues and are generated for supplying investment options to clients using the platform. This also includes a Cash Administration Fee for cash balances and income from third-party suppliers of Insurance and Fund products.
The remainder comes from (iii) Transaction Fees and (iv) Management Fees which are both dependent on how often clients trade using the platform as well as how much assets have been accumulated in the Funds the company provides.
The company has also recently reported its Annual Results at the close of August 2018 and covering FY18 performance ended 30 June 2018:
Recent Financials
The company saw a continuation of robust fund inflows for the year beating expectations with FUA up 40.9% year-on-year or circa $5.213 billion to a then-record $17.96 billion for the company. This was based on net inflows of $4.166 billion and far ahead of the company’s $2.5 billion net inflow target. Funds Under Management (FUM) were also solid surging 82.1% year-on-year to $2.85 billion and ahead of the $2.47 billion target.
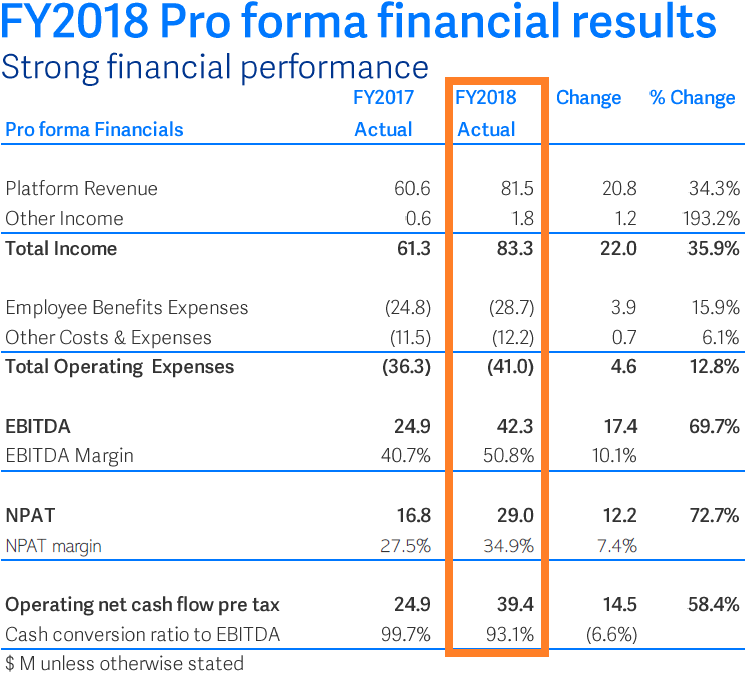
With the uptick in inflows and FUA/FUM, Platform Revenues were consequently robust up 34.3% year-on-year to $81.5 million, however, the growth in FUA/FUM didn’t scale at the same pace due to revenues/average FUA decreased by 7.5 basis points to 53.4 basis points due to product mix favouring lower margin “higher value accounts” which also have fee caps.
Despite the product mix moving towards lower margin, the company benefits from increasing scale which also drew us into the sector due to its high degree of operating leverage. Costs as a percentage of Income continues to drop from last year’s 59.2% to 49.2% and we expect continued improvement here as revenues continue to scale.
This improving cost-to-income ratio is also evident in its converse, EBITDA Margins, which have appreciated 101 basis points to 50.8%.
Source: 27 August 2018 Company Presentation
Pro Forma Net Profit After Tax (NPAT), shown above, surged 72.7% to $29.05 million as an effect of the scaling up though this adjusts for some one-offs like the IPO and one-time tax impacts. Statutory NPAT, on the other hand, reported a more muted but no less impressive 53.6% year-on-year surge to $20.82 million.
Likewise, Pro Forma EPS came in at A11.9 cents while Statutory EPS came in at A8.96 cents up 44.5%.
Management hasn’t provided specifics or guidance on their views for the upcoming FY19 period though we do expect some impact on inflows from the large accounts which may be enticed by BTFG’s marketing gimmick.
Nevertheless, as per the company’s trading update above, it seems that its industry-leading platform and competitive pricing has allowed it to maintain its growth lead. We expect a continuation of this going forward.
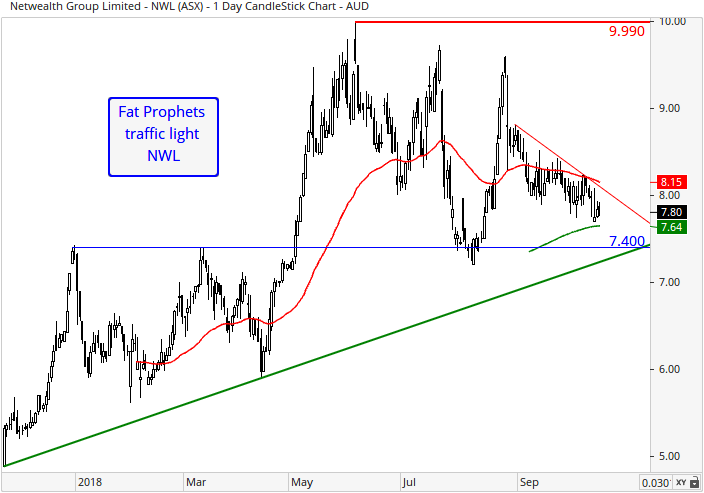
Turning to the charts and after Netwealth’s share price peaked at its all-time high at $9.99, the shares have gradually trended downwards and tested the nearest support (blue line) at $7.40. More recently, the short term trend (downward sloping red line) indicates a bearish sentiment with Netwealth (ASX:NWL) trading below the 50-day MA and trailing closer to the $7.40 support, though factoring in a longer term view, the shares still trade in an uptrend as supported by the nearest closing price above the 200-day MA and the long-term trend line (upward sloping green line). At the current pace, it seems that there might be a possible test on the $7.40 support line and which could define the direction in the near term.
Investment Conclusion
Members following our views on the Superannuation sector would note our bullish view considering the secular shift outside the big banks towards independent platform providers with our picks such as HUB24, Praemium, among others.
The sector will also benefit from the recent “Royal Commission into Misconduct in the Banking, Superannuation and Financial Services Industry” where it found endemic issues from the big banks such as ‘fees for no service’ and other improper conduct. We expect a resurgence of flows towards independent players as Financial Advisors move assets players such as Netwealth (ASX:NWL).
Netwealth (ASX:NWL) is an attractive business which has attained a strong position in the sector as the 9th largest player and taking the lion’s share of inflows via its commitment to technological innovation and ease of use. The company also boasts strong commitment from the founder/management team as well as shareholder positive policies such as a sustainable dividend payout ratio.
At this juncture, though, we believe it best for Members to adopt a “buy-on-weakness” view with the shares trading on a forward earnings valuation of 96.7 times FY19 earnings, versus the Sector P/E of 12.7 times.
The largest risk, in our view, is that the market may rerate the shares down if lofty expectations are missed. We have already seen in the recent share price action where the shares dropped 17% following the release of its impressive (but apparently not enough) FY18 result last 27 August. We are also cognisant that the shares will be susceptible to broader market weakness which we believe may continue well into November (see our Income Portfolio report).
Accordingly, we issue a Traffic Light alert on Netwealth (ASX:NWL) and await a better entry point at a more reasonable price.

