
Delivering higher Earnings
Australian-listed shares of fibro-cement manufacturer James Hardie Industries (ASX:JHX) dipped last Friday as investors were underwhelmed with the company’s profit outlook. Nonetheless, the shares have performed solidly over the past year, supported by sales growth and strong margins and have enjoyed a powerful positive re-rating since the turmoil of the Global Financial Crisis (GFC).
The pressure on the shares last Friday was a result of management noting that consensus forecast earnings for FY19 were between US$313 and $$358 million prior to the latest earnings announcement. However, they currently expect profit to come in between US$300 and US$340 million, assuming housing conditions remain favourable. Management also noted that conditions remain somewhat ‘uncertain’ with input costs ‘volatile.’
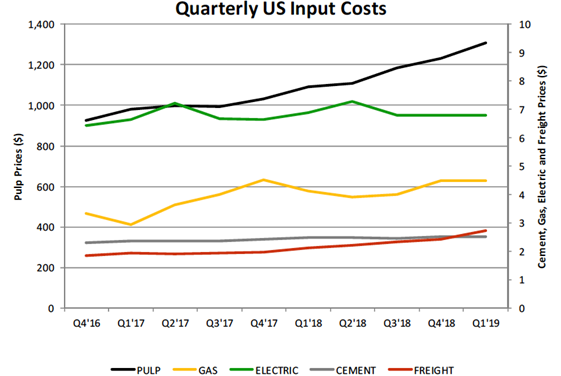
The following chart highlights some of the input cost pressures, with freight market prices up 29% year-on-year and pulp – up 20% – another input that has seen significant increases,
Source: James Hardie (ASX:JHX), with input costs from various other sources
Although this caution from management resulted in some selling pressure, we believe James Hardie is still relatively well placed and now earnings expectations have been reset, the pressure on the shares shouldn’t be long lasting; assuming no major adverse changes in the macroeconomic backdrop.
Although interest rates are ticking up in the US economy, the employment market is strong, with wage growth likely to flow through more meaningfully in upcoming quarters. US housing stock also need to be replenished after a period of ‘underbuilding’ in the wake of the GFC.
We believe the US housing and the repair and remodelling market will continue to remain healthy for some time. Therefore, we view James Hardie as well placed to capture some of the remaining opportunity, with capacity constraints largely addressed. The company’s Fermacell acquisition will diversify the business and provide a growth platform in Europe, where previously James Hardie has had comparatively little traction. As that business ‘settles’ in, we expect it to move from loss-making to profitability.
Fiscal First Quarter 2019 (1Q19) headline numbers (in US$ unless otherwise stated)
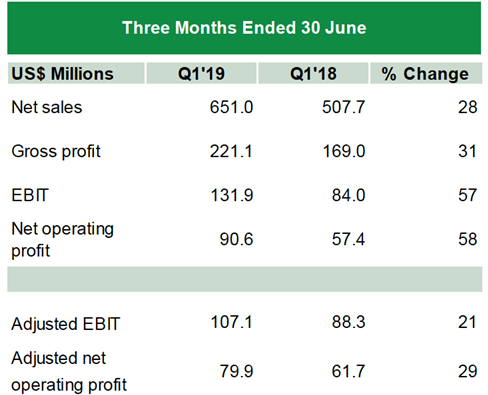
For the quarter ended 30 June 2018, James Hardie (ASX:JHX) posted sales of $651.0 million, marking year-on-year growth of 28%. The numbers were buoyed by the acquisition of Fermacell (adding $86.2 million in net sales) in Europe and higher net sales in both the North America and Asia Pacific segments.
Gross profit of $222.1 million for the quarter was up 31%, benefitting from the higher sales and a 0.7 percentage point in the gross profit margin to 34.0 percent. James Hardie’s cost of goods sold of $334.8 million in 1Q19 was some 27% higher year-on-year.
Selling, general and administrative (SG&A) expenses for the quarter of $104.9 million surged 43%, with the increase largely driven by the SG&A costs of the European Building Products segment due to the acquisition of Fermacell. The company also increased R&D (research and development) spending by 24% to $9.4 million.
There was a favourable swing in the asbestos adjustment from negative $3.9 million a year earlier to positive $25.1 million in 1Q19, reflecting the non-cash foreign exchange re-measurement on the asbestos linked balance sheet items. This is a volatile item that can change substantially between reporting periods.
Reported EBIT (earnings before interest and taxes) of $131.9 million represented an increase of 57% over 1Q18, with higher gross profits supported by the favourable movement in the asbestos adjustment.
For the quarter, the reported result was softened somewhat by higher income tax expense due to the increase in reported EBIT and a change in the accounting treatment of intangible assets amortisation that did not apply in the year earlier quarter. That impact was only partially offset by the decrease in the US corporate income tax rate.
Net operating profit of $90.6 million represented jump of 58% from a year ago. That equated to diluted earnings per share of US20 cents, up from US13 cents for the prior corresponding period.
Source: James Hardie (ASX:JHX)
Due to the volatility in the asbestos adjustments each period and occasionally other one-off items, the focus of investors is usually on the adjusted figures for James Hardie. On this basis, adjusted operating profit came in at $79.9 million, up 29% from $61.7 million a year ago. Adjusted diluted earnings per share hit US18 cents, also up 29%.
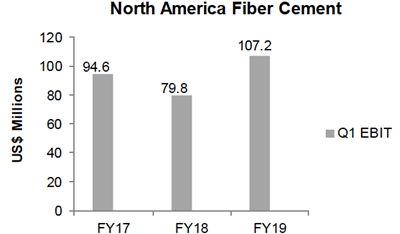
Turning briefly to the key segments, and the key North America segment posted net sales of $433.8 million for the quarter, up 10% year-on-year with volumes and prices both higher.
Volumes increased 5%, while pricing was also strong, rising 5% year-on-year. The segment’s EBIT margin impressed, increasing 4.4 percentage points year-on-year to 24.7%, even as margins incurred some pressure due to higher input costs. Accordingly, segment EBIT surged 34% to $107.2 million.
Source: James Hardie (ASX:JHX)
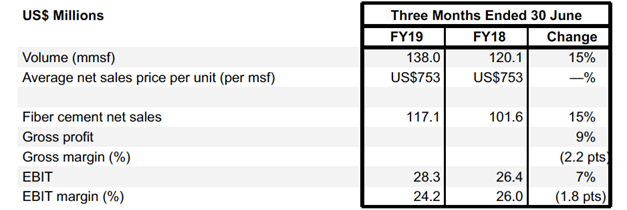
The Asia Pacific segment posted sales of $117.1 million in 1Q19, marking a strong 15% increase year-on-year. This was driven by a 15% increase in volume as prices were flat. The EBIT margin declined 1.8 percentage points to 24.2%, resulting in segment EBIT increasing 7% to $28.3 million.
Source: James Hardie (ASX:JHX)
The newly reported Europe Building segment contributed $95.4 million in net sales, while the EBIT loss was $4.6 million as the company incurred transaction and integration costs from the Fermacell acquisition and a one-time fair value adjustment of $7.3 million. We expect this segment to normalise over the course of the year.
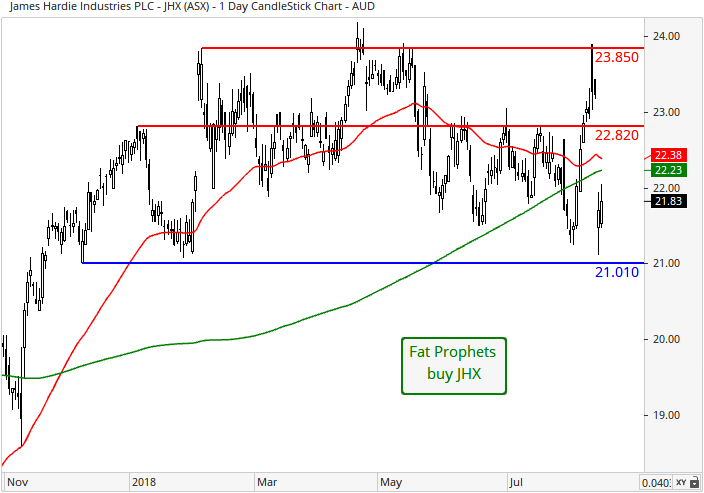
Turning to the daily chart, overhead resistance at the February intra-month high of $23.85 was backed away from. Medium-term momentum has waned slightly as the share price has dipped below the 50-day (red line) and the 200 day (green line) moving averages. A move back above the 50-day moving average would be positive as would a breach of resistance at $22.82, the January 2018 high. Support is present around $21.01.
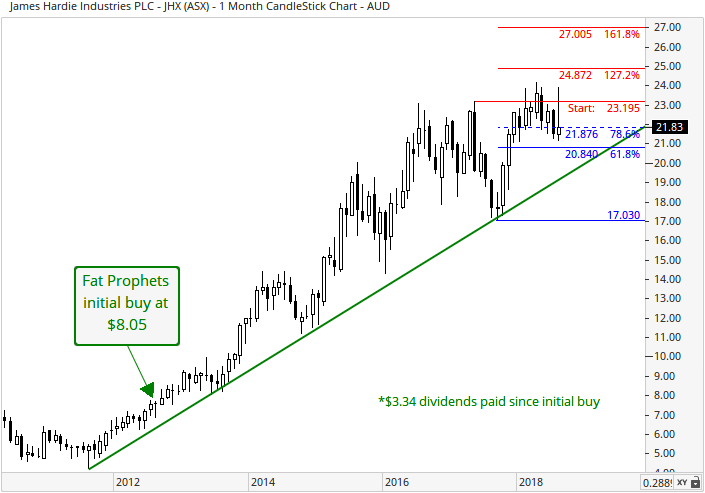
Regarding the monthly chart, the dominant long term upward trend (green line) remains in play. Prices have however closed (on a monthly-basis) just below the 78.6% Fibonacci retracement at $21.88. This remains a target (near term) as do the 127.2% Fibonacci extension of $24.87, followed by the 161.8% Fibonacci extension of $27.01. Furthermore, long-term momentum is favoured to the upside, as evident from the series of higher lows and higher highs, which are characteristics of a dominant uptrend in play.
Summary
James Hardie’s first quarter results were strong and we remain positive on James Hardie’s ability to grow earnings at a robust pace.
Rising interest rates are likely to be only a modest headwind considering they will still be at low levels for some time. Meanwhile, the US economy is ticking over nicely and wage growth is beginning to flow through more meaningfully. US housing stocks will also need to be replenished after a period of ‘underbuilding’ in the wake of the GFC.
We believe US housing and the repair and remodelling market will continue to remain healthy for some time. Therefore, we view James Hardie (ASX:JHX) as well placed to capture some of the remaining opportunity, with capacity constraints largely addressed. The Fermacell acquisition will diversify the business and provide a growth platform in Europe, where previously James Hardie has had comparatively little traction. The ‘resetting’ of expectations downward after last week’s update provides a lower bar for outperformance going forward.
The shares trade on approximately 21 times forecast FY19 (March 2020 year-end) earnings, with a projected dividend yield for that year of 3%.
James Hardie (ASX:JHX) will remain held in the Fat Prophets portfolio. For Members without exposure, and taking a long-term view, we remain comfortable continuing to recommend the stock as a buy around current levels.
Disclosure: James Hardie (ASX:JHX) is held in the Fat Prophets Concentrated Australian Share and Australian Small & Mid Cap managed account portfolios.

