
A Solid Foundation
Diversified property player, Stockland (ASX:SGP) recently announced that it will hit the top end of its profit guidance for the Fiscal Year (FY18) on the back of strong performance in its residential business with most buyers being “owner-occupiers” instead of speculators or “investors”. In light of that fact, we maintain our BUY rating on the stock.
What’s New?
Since our previous coverage of Stockland (ASX:SGP) back in May (FAT-AUS-875) where we covered the company’s 3Q18 update, there has been quite a flurry of updates from the property sector suggesting Australia’s property boom has now ended. This view is based on industry statistics, as reflected in the graphic below, with New Housing Sales having fallen for the 5th consecutive month and at their lowest since February 2013.

Source: Australia Housing Industry Association
This comes in the wake of concerns that perhaps Australia’s financial sector is over-leveraged towards housing and this is shown in the graphic below where mortgages now are equivalent to circa 80% of the economy. What makes this especially concerning the buyers taking on “interest-only” loans which make them particularly sensitive to rising rates.

Source: Bloomberg
Regulators have slapped tighter lending standards to curb down on these possible systemic risks. This in turn has slowed down the rampant property splurge from households and we do recognise the plausibility of a property market slowdown, we however, don’t have an entirely bearish view on the sector especially with Stockland, which continues to report strong numbers.
Just a quick recap, for the 6 months ended 31 December 2017, revenue from ordinary activities increased 14.3% year-on-year to $1.337 billion. The closely followed funds from operations (FFO) – the preferred profit metric – grew 18.2% to $436 million, while FFO per security was up 16.9% to A18.0 cents and adjusted FFO per security increased 16.4% to A15.6 cents.

Source: Stockland (ASX:SGP) 21 February 2018 Company Presentation
These metrics indicate that, despite the “subdued” environment, the company continues to perform well. Another important metric, Occupancy, remains high at 99.5% which we view as a positive side effect of higher property prices and tightening lending standards.
One of the things we like about the company is the frequent updates and following the latest (1H18) set of numbers, the company has also provided a couple more, starting with the 3Q18 update covered in our FAT-AUS-875 report where management reiterated their FFO guidance of a 5% to 6.5% growth year-on-year for FY18 on the back of continued strong demand for its settlements.
In fact, the company is on track to achieve its 6,400 settlement targets for FY18 with new launches including Grandview and Waterlea in Melbourne (~1,800 lots) and Rothwell and Springview, Brisbane (~600 lots).
Managing Director and CEO Mark Steinert provided commentary that the, “Residential trading conditions remain generally positive, particularly in Melbourne and Queensland. In line with expectations, Sydney has seen a slight moderation in demand from its peak. Across the country we have strong visibility of earnings over the medium term, with over 6,367 contracts on hand as at 31 March this year.”
Guidance Update
Following the 3Q18 trading update, the company, just last week, finalised its guidance numbers with a confirmation that it is set to hit the upper range of the FFO target at 6.5% growth year-on-year. The company also reiterated its distribution for the 6-month period to 30 June 2018 at A13.5 cents per ordinary stapled security.
According to management, this reflects continued growth in Stockland’s residential business as it has completed approximately 6,400 settlements in the year to June 2018. We also note that the company has benefitted from locking in a sizable “forward sales” book at much higher prices when its previous projects were still in the development phase and bank credit wasn’t as tight.
Going forward, we believe that Stockland (ASX:SGP) is also better positioned than other rivals as it has a larger share of the “owner-occupier” market which is less volatile than the investor market, which is currently squeezed by tight lending standards. Mr Steinert even notes that “around half our residential customers are first home buyers and over 75% are owner-occupiers” which we believe puts the company in a sweet spot having lower risk due to diversity and a stable buyer base.
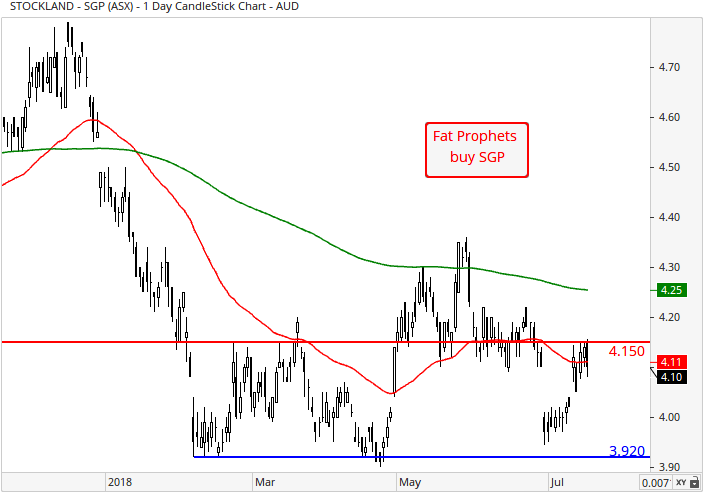
Turning to the charts, and on the daily, prices are now trading below both the 50 day (red line) and 200 day (green line) moving averages. Support at $4.15 has also given way, and needs to be retaken to improve the technical picture. In the meantime we have the $3.92 region, being the early 2018 low, which may act as a buttress.
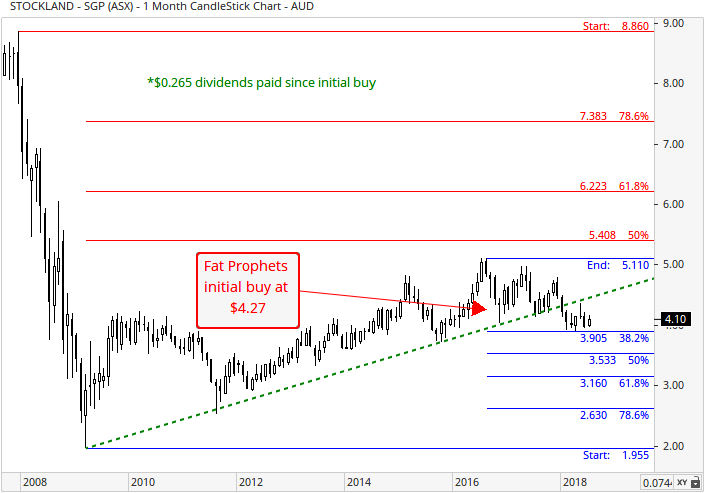
With reference to the monthly chart, support is indicated at the 38.2% Fibonacci retracement of $3.91 (blue set of retracements). In the grand scheme of things, the broader uptrend remains in play as evident from the series of higher lows and higher highs in formation since 2010, despite the spell of weakness in price-action (the breach of the upward sloping green dashed-line). In order for the bull-camp to regain upward traction, prices would need to trade back above the long-term uptrend line of $4.48.
Summary
Overall, despite a “subdued” property market, Stockland is well positioned to end the year strong having reported a high number of settlements, with earnings pegged to be at the upper end of guidance. Going forward, the company’s earnings will likely remain steady in light of its lower risk buyer base and more diversified portfolio compared to smaller peers.
Stockland (ASX:SGP) trades on a forward earnings multiple of 12.2 times, and offers a projected yield of around 6.5%, with a history of steady dividends. The stock is also backed by net tangible assets of around $4.18 per share at the end of 1H18, up 4.5%.
Accordingly, Stockland (ASX:SGP) will remain firmly held in the Fat Prophets Portfolio and for Members with no exposure, we recommend it as a medium risk BUY.
Disclosure: Stockland (ASX:SGP) is held in the Fat Prophets Income Model Portfolio.

