
Flying high
There have certainly been a number of positive results in the earnings season thus far, and that from Qantas (ASX:QAN) certainly stands amongst the highlights. Last Thursday the airline announced a 15% increase in first half underlying profit to a record $976 million. This was ahead of management guidance for $900 – $950 million, with sentiment also buoyed by a 7 cents per share dividend and further planned buybacks totalling $378 million. Net free cash flow jumped from $484 million to $772 million.
Amongst the divisions there were record results for Qantas Domestic, Jetstar, and Qantas Loyalty. The market also was appreciative, with the shares spiking 6% higher on the day of the results release.

Source: Qantas (ASX:QAN) results presentation
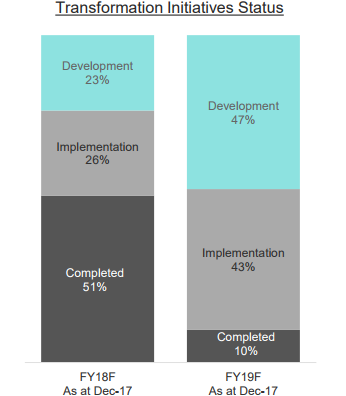
The turnaround under Alan Joyce’s stewardship has certainly been something to behold, with more than $2 billion in benefits to date. The company delivered $181 million of this in the half year, and is on track to deliver $400 million in FY18. We backed the recovery story when the airline was losing around $1 billion a year, issuing a buy in August 2014 at around $1.30. It is also fascinating how brokers just under four years ago were so negative on Qantas, and are now applauding the recovery, with many only recently shifting to buys.
Source: Qantas (ASX:QAN) results presentation
We believe the result, is yet a further vindication of the tremendous transformation program under Alan Joyce. Our Head of Research, Greg Smith, also outlined this view on CNBC Asia. A link to the interview can be accessed here.
Back in 2014 the consensus trade was to avoid Qantas, with most analysts maintaining sells. We however believed the shares were nearing an inflection point, with the capacity wars domestically abating, a substantial cost-out story, and an organisational restructure. A low oil price helped but this was only a small part of the equation.
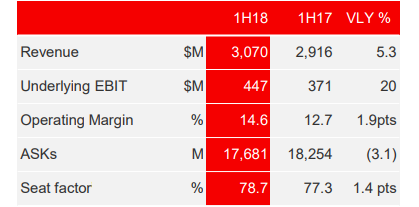
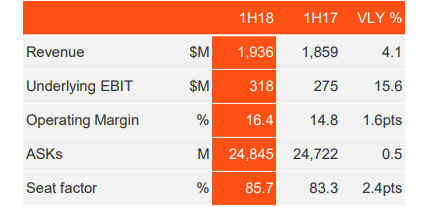
The tailwinds that have come together were evident in the half year result with the domestic unit delivering a record result, as did Jetstar, with earnings up 20% and 16% respectively. A price war truce with Virgin has indeed transpired, while a recovery in the resource sector has assisted. Management expects group domestic capacity to decrease by a further 1% in the second half.
Qantas Domestic
Source: Qantas (ASX:QAN) results presentation
Jetstar
Source: Qantas (ASX:QAN) results presentation
The Qantas Loyalty unit also delivered a record result with underlying EBIT (earnings before interest and taxes) edging up 2% to $184 million. Member numbers grew 4%, while co-branded credit card growth is outpacing the market.
Qantas International (ASX:QAN) was the only laggard with EBIT off 5.5% at $222 million. The market remains highly competitive, but these pressures are unlikely to persist indefinitely
in our view, with an adjustment likely at some point, as has happened domestically. Meanwhile, Qantas has the modern fleet and route expansion to deliver sustainable earnings growth. The company’s new Dreamliners are getting glowing reviews, while new routes into Asia, and long-haul offerings (Perth to London non-stop, and Sydney to London non-stop from 2020) should boost market share.
It was interesting to see various pieces of commentary about why the Flying Kangaroo’s shares have flown in recent years. Capital enhancing initiatives have certainly been a big driver, with the airline buying back almost a quarter of its shares since 2016. Point to note though, the cash to do this has to come from somewhere!
An impressive aspect of the transformation under Mr Joyce is that costs have been taken out, but the company’s core product (its planes) and service have not been compromised.
This is a key part of any turnaround story, for once the product slips then you will likely see even further trouble.
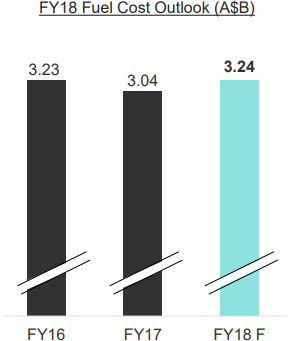
Rising fuel costs are a headwind, albeit these rose just 4% at the half year due to effective hedging. And despite strength in oil prices, the pricing outlook also remains somewhat comfortable. FY18 fuel costs are 81% hedged, while FY19 is 50% hedged.
Source: Qantas (ASX:QAN) results presentation
From a balance sheet perspective, Qantas also remains in excellent shape with net debt of $5.1 billion towards the bottom of the company’s optimal range. Around 60% of the fleet is unencumbered.
While we think that the shares can still go higher, the lowest hanging fruit has likely gone with Qantas’ share price rerating, but the story has been an exceptionally good one. And anyone who thinks that this has been down to multiple industry tailwinds should take a look at the share price of Virgin Australia.
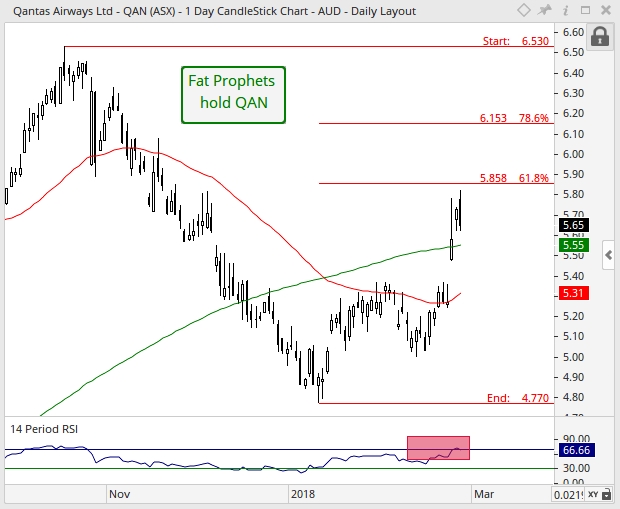
Turning to the charts, and on the daily chart, as a result of the stern increase in share price this has resulted in the RSI to rise within range of overbought territory (exhaustion of short-term upward momentum). Hence, should the bears emerge over the near-term, a temporary pullback in price could follow. Positively, should this occur, we would view this short-term pause as corrective, as the underlying impulsive move north remains firmly intact. In the grand scheme of things, prices have cleared both the 50 (red line) and 200 (green line) day moving averages, which is suggestive of momentum to have swung north. Therefore, and over the medium-term time horizon, an eventual upward rotation towards resistance located at the October 2017 high of $6.53 is deemed to be the likely path, moving forward.

With reference to the monthly chart, support was respected at the 38.2% Fibonacci retracement of $5.02 (blue set of retracements) in January, which is deemed positive price-action. Should follow-through to the upside evolve over the near-term, then this would imply that the correction evident during the last quarter of 2017 to be complete. If our analysis proves to be true, then a resumption of the broader uptrend would likely follow. Above, key overhead resistance is sighted at the aforementioned October 2017 high of $6.53. A definitive clearance of this level would likely yield a longer-term advance towards the 127.2% Fibonacci extension of $7.45. This price level was triggered when prices closed (on a monthly-basis) above the 78.6% Fibonacci retracement of $4.97 in May 2017 (red set of retracements).
Summary
There have certainly been a number of positive results in the earnings season thus far, and that from Qantas certainly stands amongst the highlights. Last Thursday the airline announced a 15% increase in first half underlying profit to a record $976 million. This was ahead of management guidance for $900 – $950 million, with sentiment also buoyed by a 7 cents per share dividend and further planned buybacks totalling $378 million. Net free cash flow jumped from $484 million to $772 million.
We backed the turnaround story at Qantas 3 ½ years ago, and we believe the result, is yet a further vindication of the tremendous transformation program under Alan Joyce. While we think that the shares can still go higher, the lowest hanging fruit has likely gone with the upward rerating, but the story has been an exceptionally good one. That said, we think that Members should stay seated a while yet.
Accordingly, Qantas (ASX:QAN) will remain firmly held in the Fat Prophets Portfolio.

