
Reaching Stability
Aged Care specialist, Estia Health (ASX:EHE) has reported its Fiscal Year 2018’s results which have not been well received by the market with shares seeing a drop of some 6% over a couple of days since the release. Today, we take a closer look to see if this move was warranted.
What’s New?
In our last of the stock back in July (FAT-AUS-884), the most pressing development then was the announcement that CEO and Managing Director, Ms Norah Barlow, would be stepping down by November. The most important question to answer then was the “issue of succession” which we mainly focussed on aside from the achievements under Ms Barlow to measure if the looming departure would be an acceptable change.
On a positive note, it definitely was, as her successor, Mr Ian Thorley, has had extensive experience in C-level roles across various large private hospitals and aged care companies not to mention his active involvement and significant contribution in turning around what was a “sinking ship” as the COO and Deputy CEO. Thus, we are confident in the selection and believe Mr Thorley can maintain the momentum.
Since then, the company released an update covering its Full Year results wherein the market responded with the shares dropping some 6% over a span of a couple of days. That said, we put a tape measure on the results to see if the recent pullback was warranted:
FY18 Results Review
In late 2016, the company was facing a slew of headwinds from external forces like regulators to its own internal issues such as over-expansion. This eventually resulted in the departure of the previous management as the company hit its bottom, operations-wise.
However, since then Estia has made tremendous progress and continues to report organic growth with the Fiscal Year 2018’s (FY18) total operating revenues marking a 4.3% year-on-year growth to $547.05 million. As shown on the graphic below, an interesting development was that the Resident & Other Revenue was the fastest growing segment, up 4.7% year-on-year, indicating a measure of success for the company ramping up its efforts for organic growth.
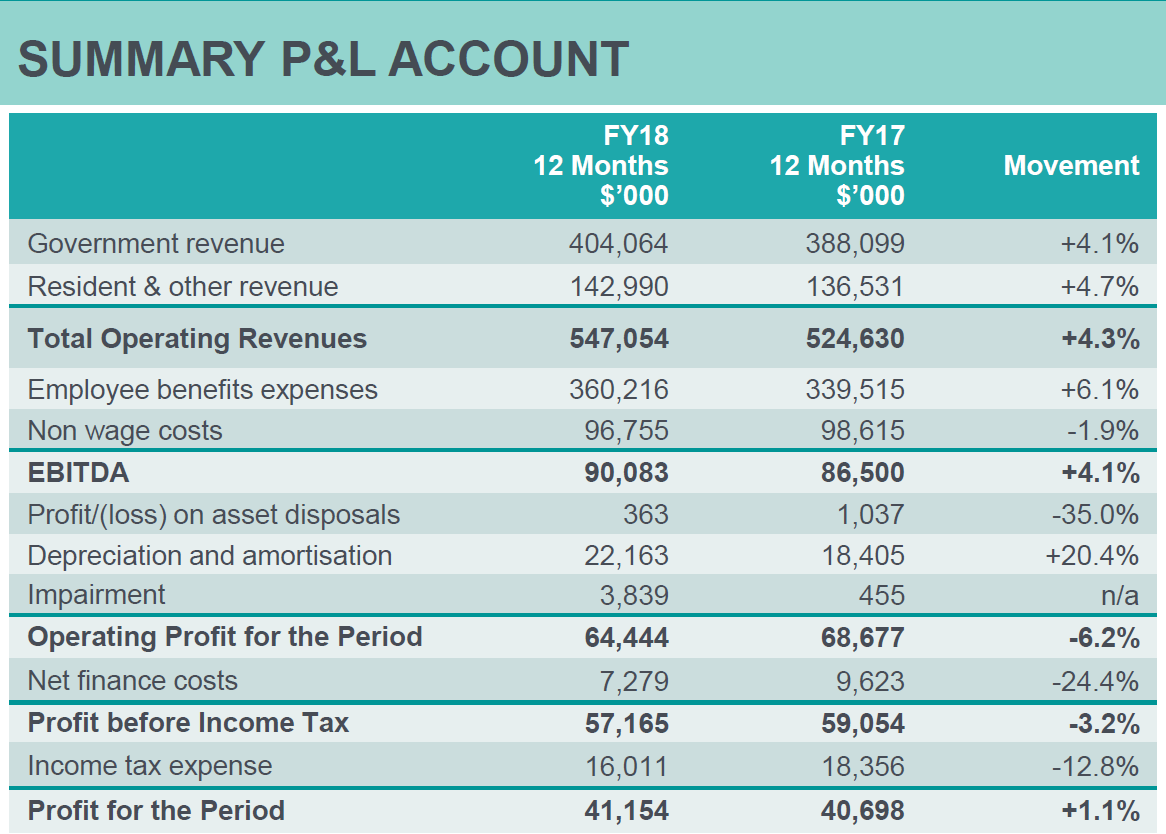
Source: 16 August 2018 Company Presentation
This year-on-year improvement is telling, especially considering that the company hit its bottom on occupancy in December 2016 at circa 92.5% with some 10 homes even reporting occupancy rates well below 90%. This put the company’s results below the sector average of a 94.6% occupancy rate according to the Aged Care Financial Performance Survey by Accounting firm, StewartBrown.
Since then, Ms Barlow et al, have made efforts to optimise occupancy and have raised the group number to consistently hit above 94.5% over the last 3 months to finish the year on-target at a Full-Year average of 94.2% for mature homes. Note that the average number has been raised for all mature homes, a remarkable improvement in our view and above the 94.06% average according to the latest StewartBrown survey.
Ms Barlow even provided commentary: “we have worked hard to optimise occupancy over the past 18 months, with the combination of a strong local community engagement program and investment in improving and enhancing our homes helping achieve average occupancy of 94.2% in a competitive environment”.
Note to members, every bit of improvement in occupancy rate counts as management estimates sensitivity to be substantial, with a 0.1% movement in rates impacting EBITDA by $560,000.00 and thus marks the importance of maintaining a high degree result.
That aside, with occupancy at a stable level, the company has also set it sights on continuing growth, having recently launched 2 new homes with Quensland’s Twin Waters which has a capacity of 114 and opened last September while the Kogarah’s (NSW) 72 space structure opened March 2018.
A positive bit of news as well, as at 31 July 2018, the Kogarah home already boasts a 100% occupancy while the larger Twin Waters Home has hit 84% (breakeven at May 2018: ~73%) with incoming residents on the way.
That said, the company has a pipeline of 5 more and split between the same 2 states with an expected capacity of 585 and all set to open as soon as 2H19 and as late as the 2H20. Ms Barlow further added that “we focused on expanding our portfolio in strategically important locations, opening two new homes at Twin Waters on the Sunshine Coast, and Kogarah in Sydney. Three new homes at Blakehurst in Sydney, Southport on the Gold Coast and Sunshine Cove on the Sunshine Coast also began construction in the year. We continued to invest in improving the quality of our existing homes.”
Other operating metrics are summarised below and mark improvements across the board:
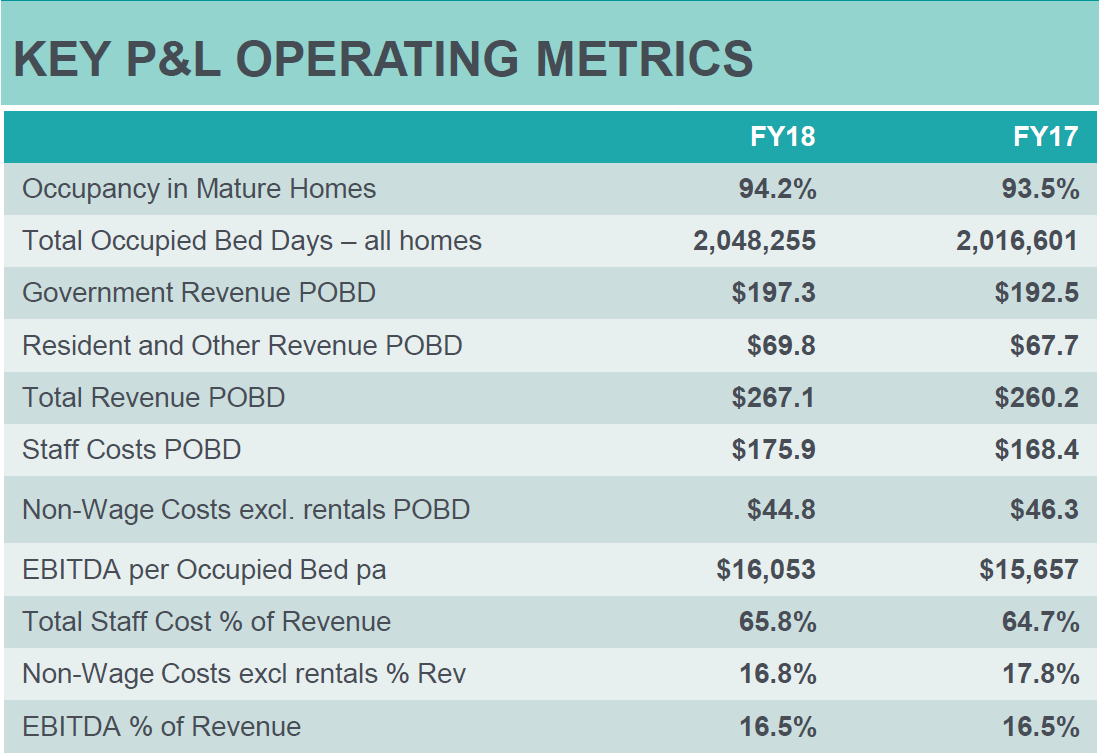
Source: 16 August 2018 Company Presentation
Moving on to the cost side and expansions aside, Enterprise Bargaining Agreements with staff have resulted in wage increases as well as some associate uplifts in accrued leave. As such, Total Staff Costs as a percentage of Revenue have increased 110 basis points to 65.8%.
More importantly though, with management improving debt levels (following the FY17 capital raising), improved procurement and operational costs have resulted in non-wage costs which, as a percentage of revenues, fell by 100 basis points to 16.8%.
On that note, management has maintained profitability with the EBITDA Margins at 16.5%. Moving on down to the after-tax profit, NPAT for FY18 came in 1.1% higher year-on-year to $41.15 million and implying a net margin of 7.52% which is well above the sector average of 6.1% placing the company comfortably above the 75th percentile (3.1%).
The company has also maintained a solid balance sheet having continued to clear up debt levels with assets of $1.824 billion supported by $761.6 million in equity. Net debt has fallen further to $63.8 million and has come a long way from peak 2016 levels of $223.7 million. The company also has a $330 million loan facilities out to 2020 which gives a large amount of financial flexibility for the refurbishment and development of existing homes.
The graphic below showcases the changes in Net Debt over the FY18 and includes budget for expansion:
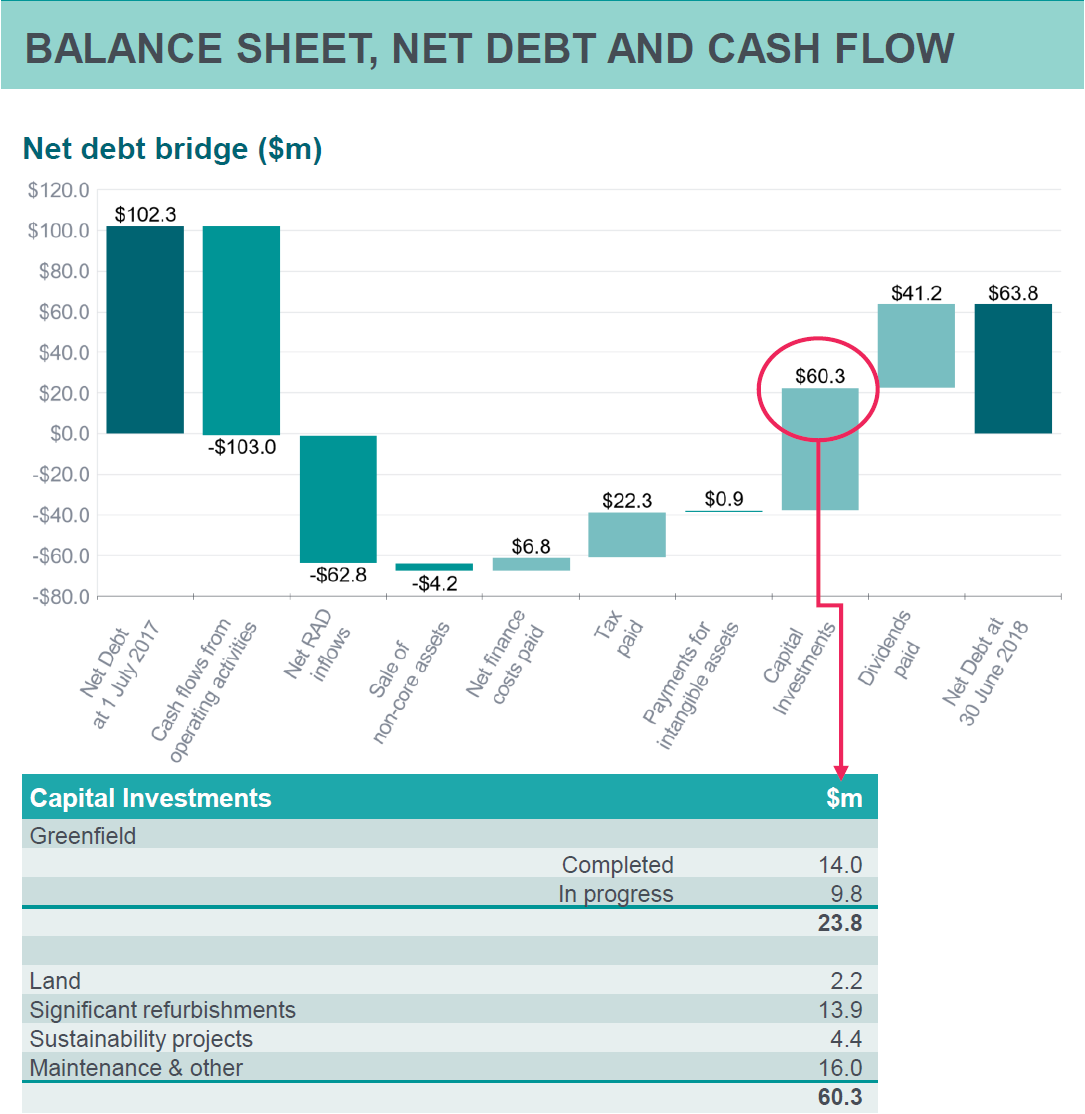
Source: 16 August 2018 Company Presentation
Overall, we believe that the result was a strong one and highlights the tremendous improvement under Ms Barlow’s tenure which has stabilised the company as well as set the building blocks for sustainable earnings growth going forward. We believe that her intended retirement this November is well-earned, and that Mr Thorley is well suited to carry on the torch.
Management are forecasting mid-single digit percentage growth in FY19 EBITDA based on existing portfolio of homes.
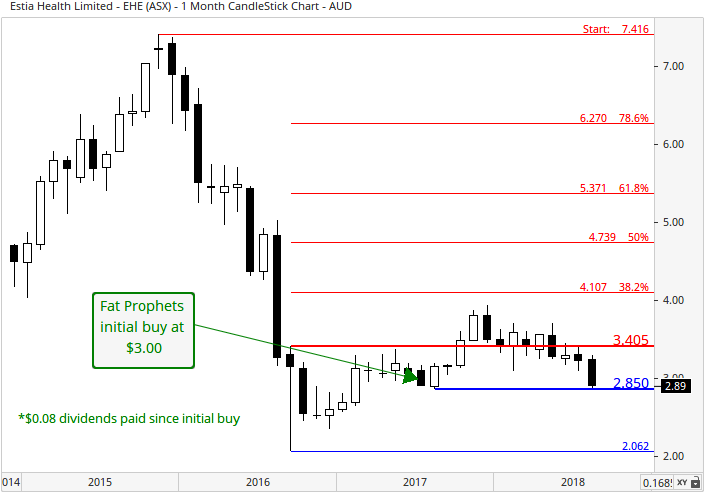
Turning to the charts, and the technical picture has deteriorated following the results. Prices have dipped further below both the 50 day (red line) and 200 day (green line) moving averages, which is suggestive of momentum to have swung south. Support at this year’s low of $3.09 has also given way. A move back above the 50 day moving average, and downward trend-line around $3.15 would improve the technical picture.
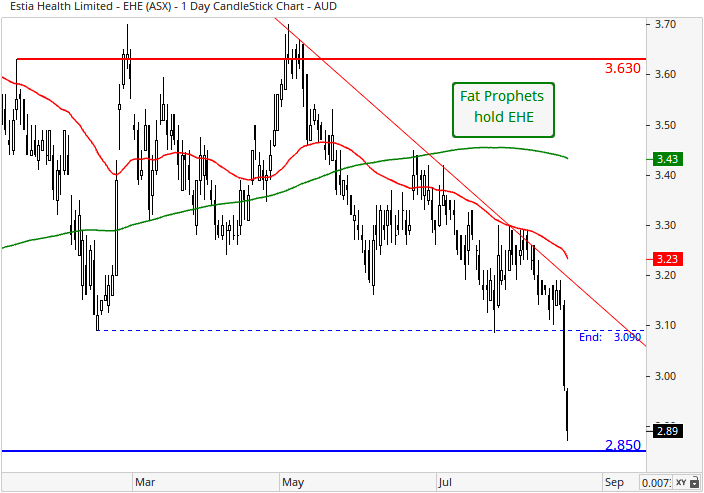
On the monthly, the share price touched an all-time low of $2.06 in September 2016 to form a ‘bullish doji’ candlestick formation. Positively, the highest price of this candle of $3.41 was surpassed in October 2017. This was a bullish development and signalled a medium-term upward shift in momentum. Prices are currently below this level, and a move back above here is needed to improve the outlook, and increase the probability remains for an eventual ascent in share price towards the next band of resistance evident between $4.11 and $4.74. This is made up of the 38.2% and 50% Fibonacci retracement levels respectively. Support at $2.85 also needs to hold to avert a steeper decline.
Summary
Despite investor reaction, Estia Health’s FY18 results marked some significant improvements with stability in occupancy and sustained profitability. We also see management sowing the seeds for future growth with prudent expansion. Such results showcase the success of incumbent management’s efforts to turn around the business from the legacy issues left by previous executives. These results do come amidst headwinds but we regard the market reaction as unjustified.
In the long run, the underlying thematic remains a compelling one. Australians are living longer, and many baby boomers are set to retire over the next two decades, increasing the demand for high quality aged care services. This is particularly as studies show that most retirees will need to cash up equity in their own homes, and move into care to sustain themselves in their golden years.
Estia Health (ASX:EHE) shares are trading on a FY19 earnings multiple of approximately 20.9 times, with a projected yield of 4.8%, rising to 5.6% in FY20.
However, the technical picture has clearly deteriorated in the wake of the results, and with the shares needing to undergo a period of consolidation we are adjusting our view on Estia Health (ASX:EHE) to a Hold.
Disclosure: Estia (ASX:EHE) is held in the Fat Prophets Concentrated Australian, and Small & Mid-cap managed account portfolios.

