
The Decks are Cleared
Despite the challenges to QBE Insurance’s (ASX:QBE) 2017 results being well flagged to the market in advance, investors chose to sell the fact, with the shares seeing some weakness immediately after the company released results. This was likely due to the cut in the final dividend. However, we maintain the view that with the shares trading at depressed levels and following a ‘clearing of the decks’ the trading environment for the insurer will likely be more accommodative going forward.
Natural disasters are unpredictable and a repeat of 2017, the worst on record for insurers, is possible, but not probable. The reduction in global capacity should drive premiums higher and a rising bond yield curve is also going to provide a boost to QBE’s investment income. The possibility of QBE being a takeover target is another wildcard, given its valuation discount to international peers. Ultimately though, our base case is that when it comes to QBE the market has become so accustomed to bad news and disappointment, even an adequate delivery of results from the new CEO should see the stock re-rated positively.
The recently announced sale of most of the Latin American operations (i.e. Argentina, Brazil, Colombia, Ecuador and Mexico) for US$409 million is a step towards simplifying the group,
reducing risk and improving the consistency of results. The profit on the sale is estimated to be around US$100 million and closing is targeted for the end of 2018 subject to approvals.
2017 headline numbers (US$ unless otherwise noted)
QBE (ASX:QBE) reported a statutory net loss after tax of $1,249 million for 2017 compared to a net profit of $844 million in 2016. That loss included two major non-cash items, with the first a $700 million impairment charge after revising the assumptions used to support the carrying value of goodwill for the North America business. The second was a $230 million write down in the carrying value of the deferred tax asset in the North American operations due to the reduction in US corporate tax rates.
Excluding those and other non-cash items, the cash loss after tax was $258 million compared to a cash profit of $898 million in 2016.
That led to a cut in the final dividend to 4 Australian cents per share (franked at 30%), down from 33 Australian cents a year earlier to reflect the significant amount of catastrophe losses. The following provides the reconciliation of cash profit to statutory profit.
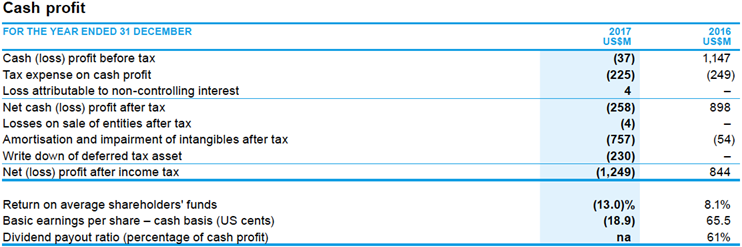
Source: QBE (ASX:QBE)
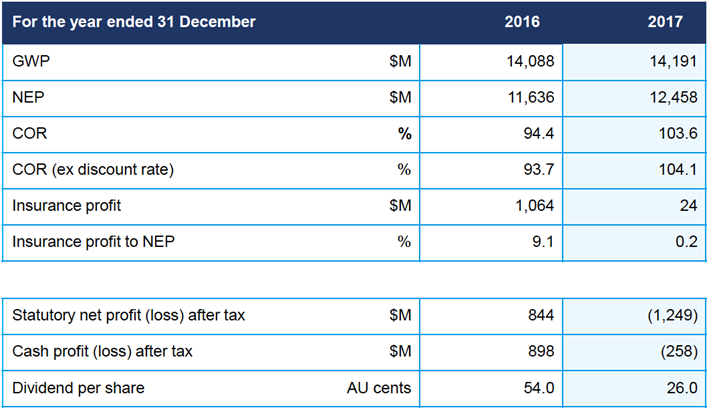
QBE’s cash results were adversely impacted by the record cost of catastrophes in 2H17, weakness in the emerging markets businesses. The adjusted combined operating ratio (COR) increased from 93.7% in 2016 to 104.1% in 2017, mainly due to the extreme catastrophe experience, along with a reduced level of positive prior year accident claims development and an increase in the attritional claims ratio. Combined that more than offset an improved combined commission and expense ratio. The adverse movement in the COR had been flagged to the market prior to the release of final numbers.
The COR is a measure of underwriting profitability, with a figure of less than 100% representing profitable underwriting. Excluding the net cost of large individual risk and catastrophe claims more than the group’s aggregate reinsurance limit, the 2017 COR would have been 98.2%. It was the worst year on record for the catastrophe insurance industry, so the underwriting result was always facing a stiff headwind and not going to repeat the profit from the year before.
Source: QBE (ASX:QBE)
Looking at premium income and gross written premium (GWP) increased marginally from $14,088 million in 2016 to $14,191 million in 2017. On a constant currency basis GWP increased 0.5%, with slight growth in the North American and European operations, mostly offset by a slight decline in Australian & New Zealand and the Asia Pacific operations.
Net earned premium (NEP) showed more significant improvement, rising 7% on a constant currency basis, supported by reinsurance cost savings.
At the group level, there was some relative bright spots, with an improved expense ratio of 15.7% in 2017 compared to 16.5% the prior year.
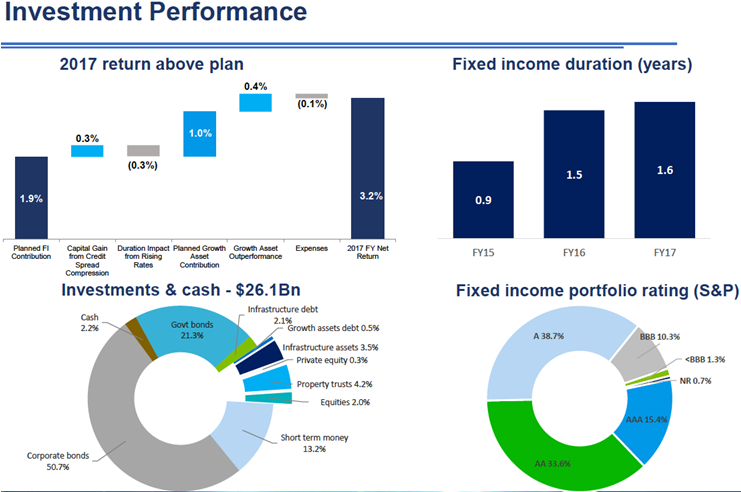
In addition, the net investment return for the year ticked up roughly 30 basis points to 3.2%. Longer term interest rates are going to rise and this will benefit QBE, whose share price is also positively correlated to the 10 year Treasury yield. The company’s short duration portfolio should see investment returns continue to rise under this scenario.
Source: QBE (ASX:QBE)
Geographic COR performance
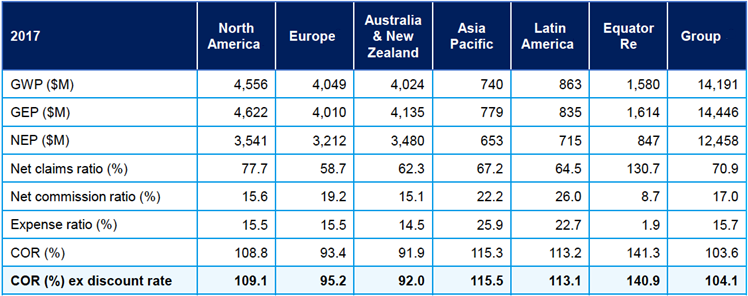
The North America business was heavily impacted by major second catastrophes in the second half of the year, including Hurricanes Harvey, Irma and Maria, along with the Californian wildfires. That resulted in a COR of 109.1%, up from 98.5% in the previous year. Large individual risk and catastrophe claims more than aggregate insurance protection added 6.9% to the regional COR.
The Europe business delivered a solid result in challenging conditions as performance faced a headwind in the second half from its exposure to North American catastrophes and reduced levels of positive prior accident year claims development as this has moderated. The COR remained profitable at 95.2%, up from 90.7% a year earlier.
Australian & New Zealand operations performed well, with premium rate increases, improved underwriting performance and claims management initiatives. The COR improved to 92.0% from 92.4% the prior year.
Source: QBE (ASX:QBE)
The Asia Pacific was a laggard performer, with the COR blowing out from 95.6% in 2016 to 115.5% in 2017. The segment has a new executive team tasked with bringing this business back to more acceptable levels of performance. Finally, the Latin American operations also had a poor COR, at 113.1%. QBE has decided to exit the region, with only Puerto Rico retained and to be folded into the North America operations.
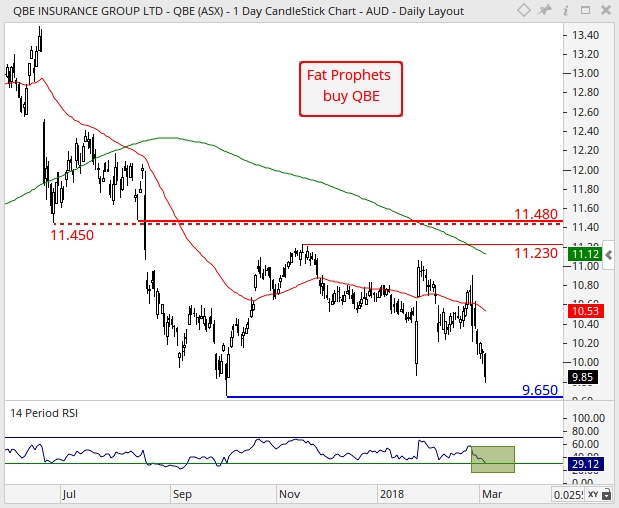
Turning to the charts, and on the daily, the bearish moving average crossover present since August 2017 is suggestive of momentum to favour the downside. This occurs when the 50-day moving average (red line) crosses below the 200-day moving average (green line). Should the bears remain in control over the near term, then support is expected at the October 2017 low of $9.65 as marked by the horizontal blue line. Positively, from a relative strength perspective, the RSI has declined into oversold territory which is suggestive of downward pressure to be on the exhaustion trail. For the short-term technical outlook to improve, a sustained break above the 200-day moving average (green line) of $11.12 is required. Should this favourable scenario unfold, then medium-term momentum would once again shift in favour of the bull-camp.
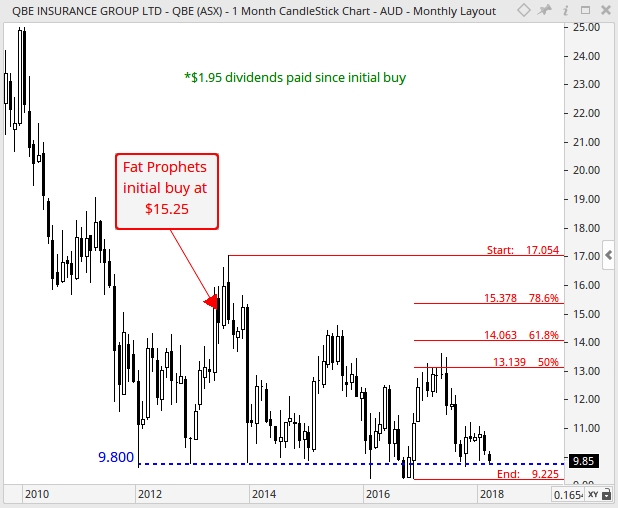
Regarding the monthly chart, a zone of support is evident between $9.23 (November 2016 low) and the psychologically significant $10.00 round number, if the bears were to maintain downward pressure over the near term. It is important that the bulls defend this price range, and a consolidation unfolds over the medium-term. Should this occur, then this would encourage a period of price-stabilisation to evolve over the coming months. If this favourable scenario was to evolve, then upward momentum would likely gather, and the pendulum would swing in favour of an eventual retest of resistance sighted at the 50% Fibonacci retracement of $13.14 over the broader horizon.
Summary
At current levels, we believe the downside in QBE shares is much more limited than the upside potential. Sentiment towards the stock is already at a low ebb; providing a low hurdle to see sentiment improve in future periods. A wildcard is the company being a prospective takeover target given its significant discount to international peers. We saw some major activity on that front this week, with AXA agreeing to buy XL Group for $15.3 billion.
AXA itself is said to have previously run the rule over QBE, and with this deal it is clearly expecting the sector to stage a strong turnaround. With similar value drivers this has pricing implications for QBE.
New CEO Pat Regan could also bring some positivity to the investment story, especially as it seems much ‘kitchen sinking’ has already been done. The Latin American operations have been sold for an adequate price.
Premiums will likely see significant upward pressure due to 2017’s extreme catastrophe experience, and we expect investment income to increase over the medium-term, due to our expectation for a rising yield curve.
We therefore retain our conviction buy on QBE (ASX:QBE) for Members without exposure. A medium to long-term investment horizon is necessary in our view.
Disclosure: QBE Insurance (ASX:QBE) is held in the Fat Prophets Global Contrarian Fund, the Global Opportunities and Australian Concentrated Share portfolios.

