
Gold touches US$2,000 now where?
Golds’ fortunes turned late in 2022, with the reversal of a strong US dollar and the return of a safe haven premium. Events that gave the gold price newfound upside momentum in early 2023, pushing it to US$2,000 an ounce by March and within sight of its record high. The following chart shows the three-year US dollar gold price:
 Source: World Gold Council
Golds’ price movements in 2022 were very much governed by the strength of the US dollar. The widening of interest rate differentials in favour of the US, as it lifted cash rates relative to other countries not taking the same action, pushed funds into the US. Buying of the US dollar, to capture higher US interest rates, pushed the US dollar index higher and the gold price down. The US dollar also replaced gold as a safe haven investment in 2022, as the US dollar direction was expected to rise over the course of the year on the US Fed lifting cash rates. Both the gold price and the US dollar reversed, in November 2022, as the US Fed hiking, on market expectations, was running its course while other countries remained locked into continued hikes. Expectations grew that US interest rate differentials would narrow.
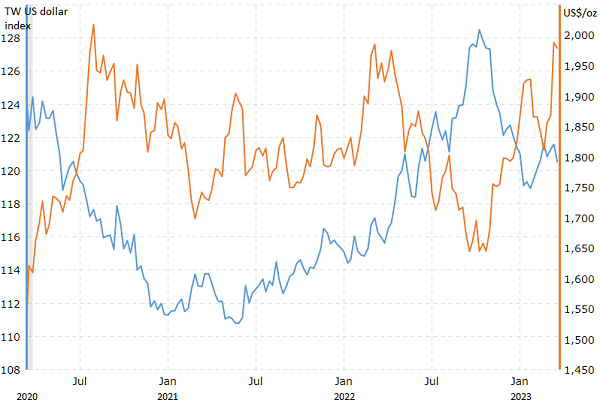
The US dollar has been a key driver governing the direction of the gold price and generally in an inverse relationship. This relationship is punctuated by periods of extreme market volatility, including inflationary cycles and geopolitical disruptions when a safe haven premium becomes an added influencing factor. The following chart shows a three-year comparative of the US dollar and the gold price (TW – trade weighted):
Source: Macrotrends
Members can see from the above chart the rise and rise of the trade weighted US dollar index over 2022 to peak at 127 in October and reversed. The trade weighted US dollar index ended the 12 months for 2022 up 5.3% at 121.40. The gold price, meanwhile, fell to a bottom in October of US$1,644 an ounce and ascended into the close of the year, to US$1,924 an ounce, adding 6.5% for the 12 months.
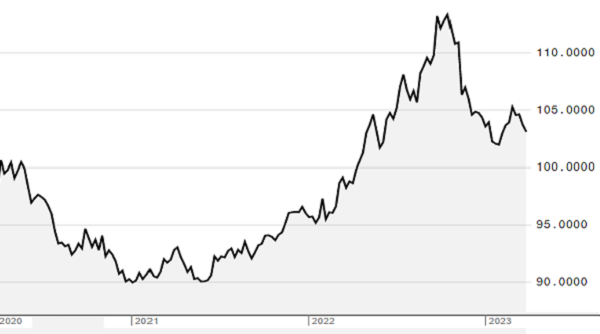
We continue to see the US dollar as the key driver governing the direction of the gold price over 2023 and we expect it to weaken during the year. The following chart shows the spot US dollar index for a period of three years:
Source: Bloomberg
There are several factors, we see, buffeting against the US dollar index in 2023, and its these headwinds that form the basis of our call for it to fall. Members can see from the above chart the US dollar index has turned down in 2023 but has yet to show downside conviction.
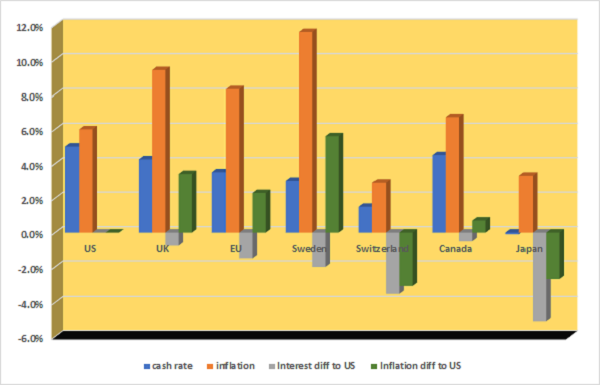
Looking at the US dollar index in 2023, the main factor we see driving it lower is the narrowing of interest rate differentials against peer currencies. The US dollar index is composed of the Euro with a weighting of 57.6%, Japanese yen 13.6%, UK pound 11.9%, Canadian dollar 9.1%, Swedish krona 4.2% and Swiss franc 3.6%. We see the Federal Reserve (Fed) being further through its campaign to crush inflation than the majority of its peer central banks. The following chart shows the US and the countries in the US dollar index, their cash and inflation rates and the differential of each metric to the corresponding US figure:
Source: Fat Prophets/various
The above chart shows only Japan and Switzerland have a lower inflation rate than the US. All the constituent countries have lower cash rates than the US. We expect the UK, EU, Sweden and lesser so Canada, all of which are heavily represented in the US dollar index, to increase their cash rates at a faster pace relative to the US cash rate rising. This action will narrow the interest rate differential against the US dollar index. The recent 50bp hike by the European central bank acted as a significant headwind for the US dollar, as the interest rate differential widen in favour of the Euro widen. The Fed at the same time only hiked the cash rate by 25bps, causing the interest rate differential to narrow against the US dollar.
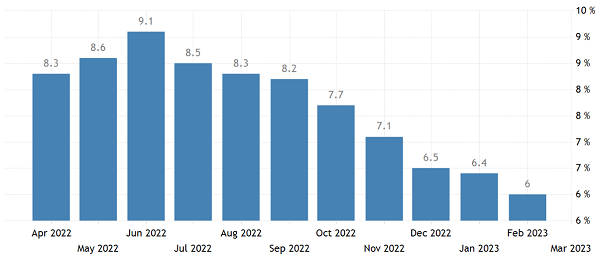
We expect the US Fed will hike rates by 25bp at its May 2023 meeting (2nd to 3rd) and will then pause. This hike will lift the US cash rate to 5.00% to 5.25% and will place some pressure on the US dollar index at the time. The pause after May in US cash rate hikes, we cannot see peer central banks following the same pathway, hence our expectation interest rates will narrow and the US dollar index falls. The Fed remains however committed to driving inflation to within its 2% to 3% target and action on the hiking front may return in 2024. On US inflation, it peaked in June 2022 at 9.1% and has since that peak fallen. The following chart shows US annual inflation on a monthly basis:
Source: Trading Economics
Members can clearly see the current US inflation trend from the above chart. Certainly, commodity prices, both hard and soft, have fallen since the June 2022 inflation peak but have not shown the same urgency as energy. Adding to the downward trend has been a concerted weakness in energy prices, as the Russia and Ukraine disruptions are now better managed and energy demand destruction around a feared global recession persist. Brent and West Texas Intermediate (WTI) have shed value. Brent back in June 2022 was US$115 a barrel and WTI US$110 a barrel. Both prices today are Brent US$80 a barrel and for WTI US$74 a barrel representing falls of 30% and 33% respectively. These falls have eased the pressure on US inflation, and we believe this will continue, but the pace in energy price will slow the same we see for the broader commodities including soft. Hence, inflation will remain sticky in our view.
Another factor that has governed the improvement in inflation from its June 2022 peak has been the collapse in the US M2 growth. The following chart shows the changes in US M2 growth and annual inflation (US M2 – black line, US inflation – red line):

Source: Longtermtrends
Members can see from this chart, US M2 growth has collapsed from the covid induced surge in 2020 on trillion handed to US consumer to go negative in 2023. The withdrawal of government handouts and certainly the rise and rise of US rate hikes by the Fed will have slowed growth in the overall economy. We expect US M2 will continue to slow but the sharp decline will start to base out in 2023.
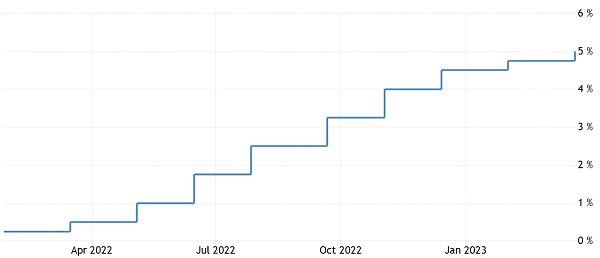
We believe US inflation in 2023 will continue to trend lower in 2023 but will fall short of the Feds’ target range of 2% to 3%. There is no doubt the Feds’ action in hiking cash rates has also had an impact on bring inflation down. The following chart shows US cash rates:
Source: Trading Economics
The impact of our US inflation call will be reflected in the narrowing of interest rates against the US dollar index and a fall in its value. We see sticky inflation putting some pressure on the gold price but primarily it will be the ongoing.
We certainly see US inflationary conditions continuing to improve in 2023 and cause the US dollar index to fall over the year on a narrowing interest differential. There is one more factor we see impacting on the US dollar index and that is the growth in US debt.
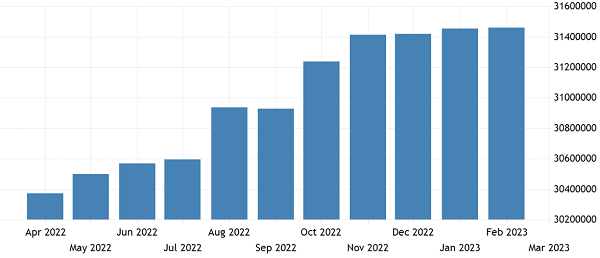
Looking at the remainder of 2023 and going into 2024, rising US debt and a slowing US economy remains in the background and not to the fore of investors current views of financial markets. Government debt in the US continues to run at record levels, as the uplift in spending is funded through debt. The following chart shows US debt (US$m):
Source: Trading Economics
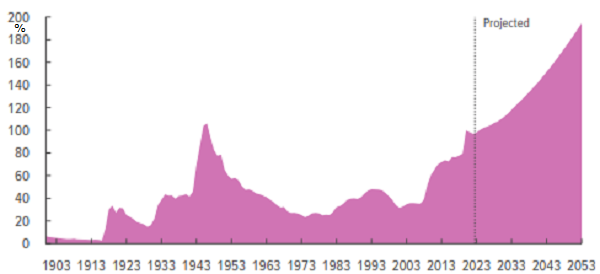
US debt continues to grow, rising to US$31.5 trillion to February 2023 and continues to set new record highs. Expectations are that the US economy will continue to lever into a growing debt pool. The following chart shows US debt as a percentage of Gross Domestic Production out to 2053:
Source: Congressional Budget Office
US debt is expected to hit US$36.0 trillion by 2030 and sustain new record levels. US Congress lifted, in December 2021, the US government debt ceiling to US$31.4 trillion and that mark has now been reached as we expected in late to early 2023. Fresh talks to lift the ceiling have stalled as the Democrats and Republicans do not have outright control of both house of the US Congress. We see undue pressure on the US dollar index as these talks, although this political posturing occurs at every negotiating point, may focus investors on the growing pool of US debt. Over 2023 we believe US indebtedness will be a headwind for the US dollar index.
US financial markets in 2023, on the back of the swiftest and prolonged rise in cash rates by the Federal Reserve (Fed), fell into turmoil. Ultimately, tipping the global financial markets also into turmoil. The Fed hiked rates nine times from a record low of zero to 0.25% to hit March 2023 with a 25 basis point hike to a range of 4.75% to 5.00% and we see at least one more hike to come. The Feds’ actions created fertile ground for something in the financial world to break.
One did and in fact a few banks were brought to question, with this pressure stressing the regional US banking system, with the names including Silicon Valley Bank (SVB) and Signature Bank (SB) collapsing. Both banks suffered depositor runs and the weight of bond losses on the sell down to cash doing the damage. The banks demise added to the ripple effect of who’s next across the broader banking system. Major international bank Credit Suisse was next and the only bank of substantial size to date to fall into difficulties, on the same grounds as SVB and SB. Credit Suisse was however too big to let it fail, but has been acquired by larger Swiss peer UBS Switzerland AG.
The ramification for gold has been a rise in the “safe haven” premium priced in over 2023 to date. Gold has tended to rise during times of high financial and geopolitical stress, as its rarity and physical characteristics are well established metrics to determine its value. We expect, as turmoil in the US banking sector recedes in the near-term, the “safe haven” premium priced in for this event will, as it comes out of the gold price, act as a headwind. Beyond the current US banking turmoil settling, we expect gold will continue to carry a safe haven premium on rising geopolitical tensions. We see investors seeking fewer substitutions to gold on this front going forward to mark the premium higher.
Gold does have a demand and supply profile that can sometimes get lost in all the noise of the above price drivers. On this front demand was a hinderance, in 2022, to a sustained gold price rally. The following chart shows annual long-term demand for gold by major categories and the gold price (the chart is expressed in tonnes and there is approximately 35,274 ounces of gold to a tonne):

Source: World Gold Council
As Members can see from the above chart, demand for gold showed some life in 2022. Annual gold demand (excluding over-the-counter – OTC) jumped 18% year-on-year (yoy), to 4,741 tonnes. Jewellery consumption softened a fraction in 2022, down by 3% yoy, to 2,086 tonnes. Investment demand (excluding OTC) reached 1,107 tonnes (+10%) in 2022. Demand for gold bars and coins grew 2% yoy, to 1,217 tonnes, while holdings of gold ETFs fell by -110 tonnes.
We expect demand will continue to expand in 2023 by around 5% yoy, to 4,978 tonnes. We expect rising cost of living pressures will continue to bite jewellery fabrication demand. Central banks will be more than an offset as net buyers in 2023, given the impact of currency and interest rate uncertainties in holding and valuing reserve currencies and especially US dollar reserves if our call is correct, and it loses value. We see total demand for gold supporting a higher gold price in 2023.
Turning to supply, and total annual gold supply increased by 2% in 2022, to 4,755 tonnes. The following chart shows long-term gold supply and the gold price (the chart is expressed in tonnes, see above World Gold Council chart for the ounces conversion rate):

Source: World Gold Council
Mine production inched up to a four-year high of 3,612 tonnes. We expect gold production will remain constrained in 2023 on rising costs pressure across the industry, to rise by around 1%, to 3,648 tonnes. While on a higher gold price recycling will rise by around 1.5% yoy, to 1,148 tonnes. Total supply we expect will rise to 4,796 tonnes, representing a 1.0% rise on 2022.
A supply gap will be a tailwind for the gold price rally in 2023.
The US Dollar gold price does, in our view, remains in a long-term up-trend, as the global economy and government balance sheets continue to expand over time. Governments and central bank interfering, usually by necessity, in the economic process through quantitative easing and spending programmes and have been a key driver of this long-term trend. The following chart shows the long-term US Dollar gold price:

Source: Trading Economics
We expect this phenomenon will persist and continue to provide support to the US Dollar gold price. The timings of interferences are coming at quicker intervals than in years past and will remain, in our view, a constant tailwind for the gold price. Gold has however got its “safe haven” persona back and this will, we believe, continue to be the case over the remainder of 2023, which will add a solid tailwind to a future price rally.
Going forward, we believe pressure may be easing on the US inflation front but it will remain a tailwind in 2023 for gold on its stickiness. The king US dollar will, we believe, for the reasons expanded on above abdicate and provide the necessary tailwinds to price the gold price higher.
Consequently, we maintain our view that the gold price will test the US$2,075 an ounce record high in 2023 and driver higher to the US$2,200 an ounce to US$2,300 an ounce.

