
KEY CONTENT
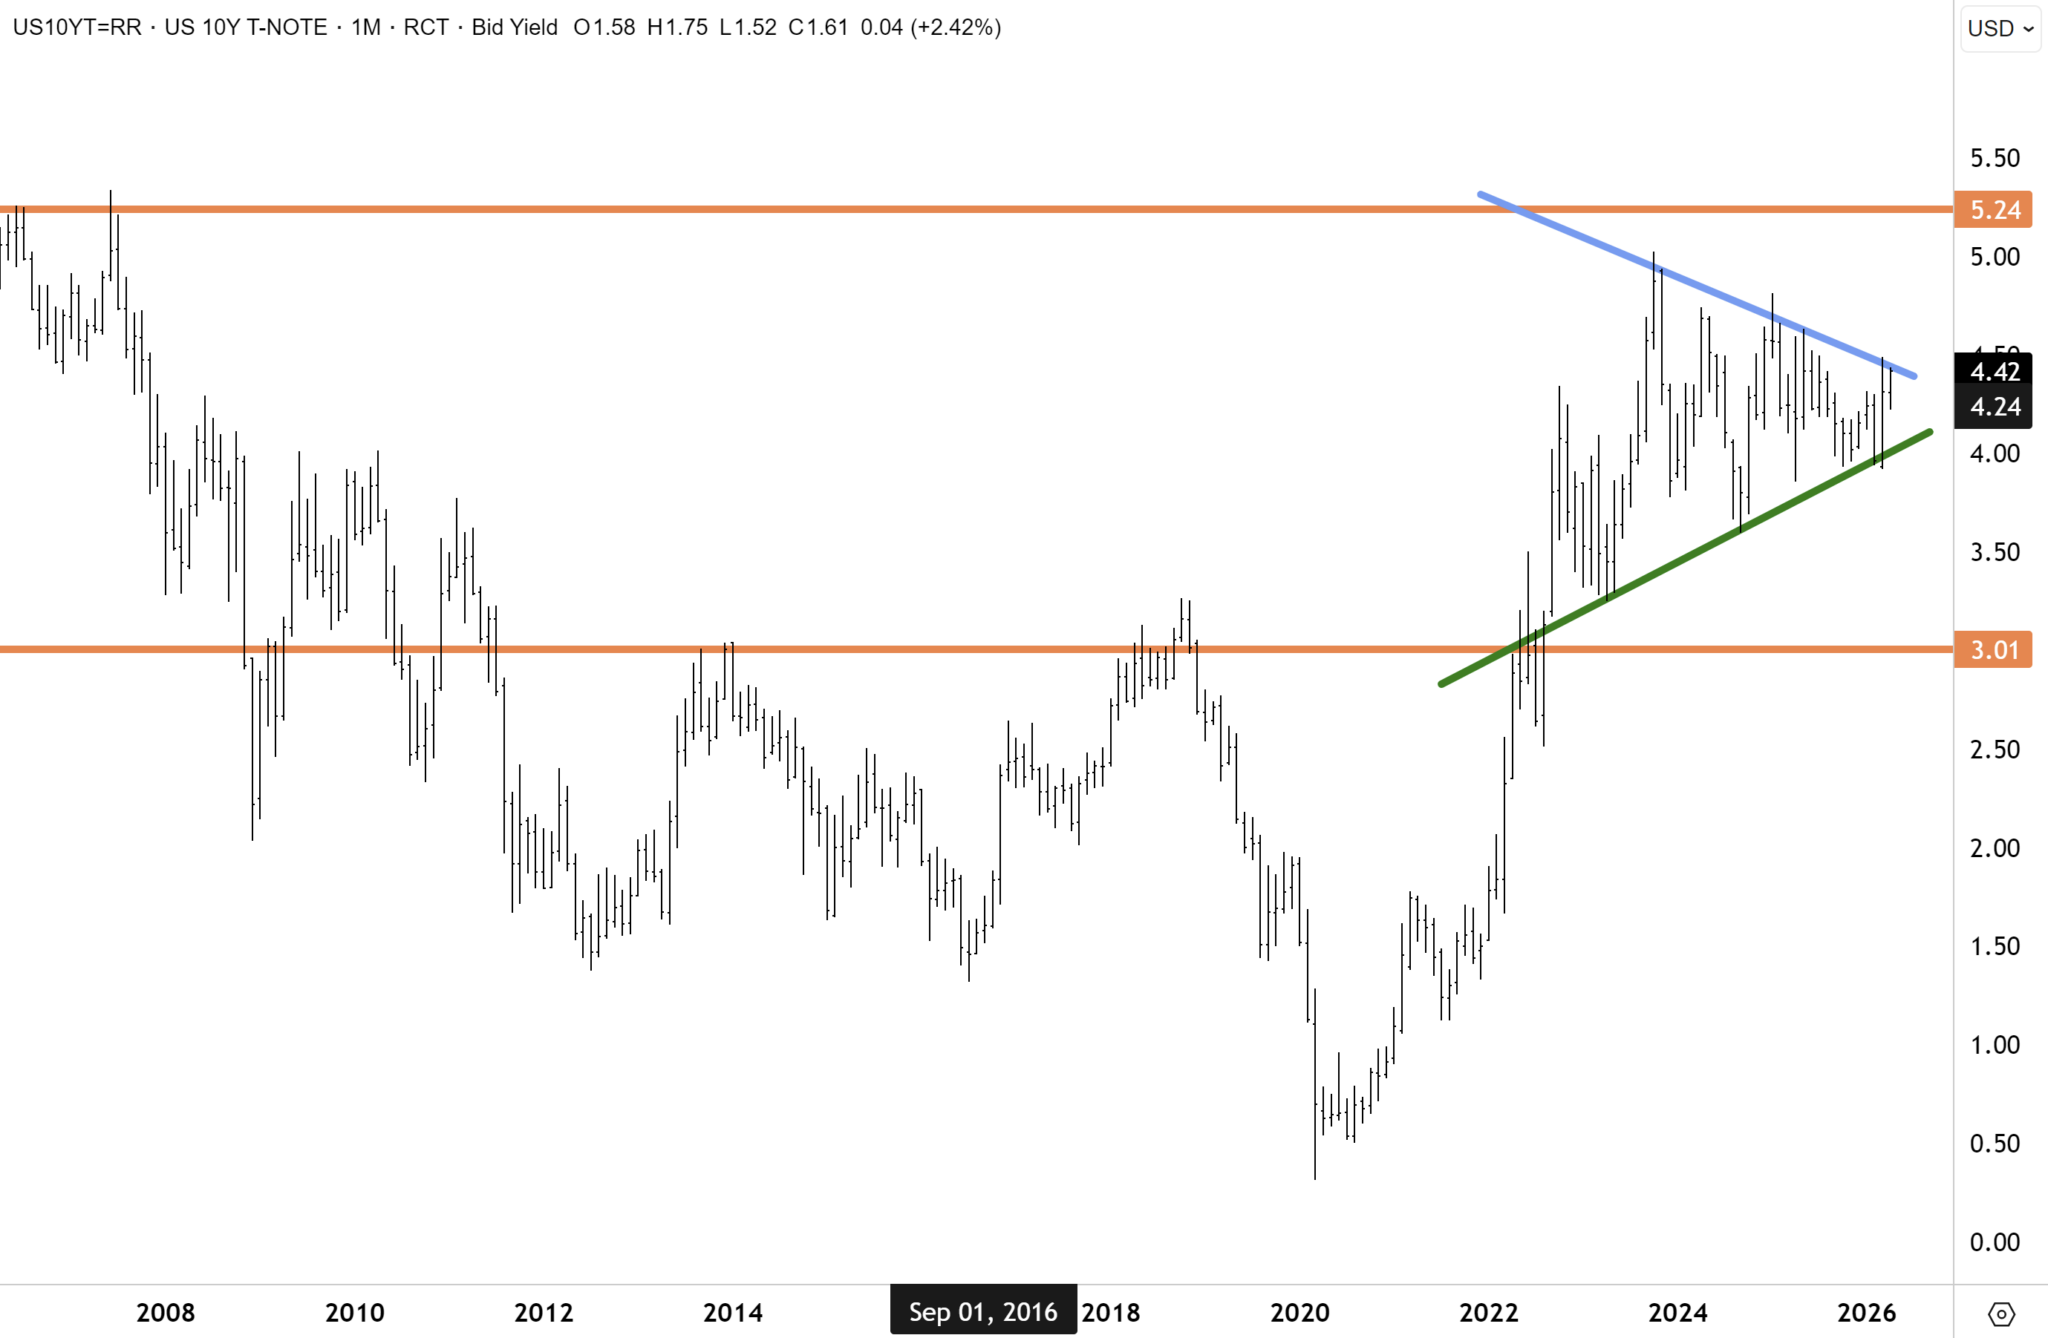
- The US 10-year yield touched 4.43% mid-week – around the zone that forced last year’s tariff U-turn – before easing to 4.37% on softer inflation and a resilient Q1 GDP print of +2%
- The FOMC delivered its most divided decision in decades: three governors voted to cut, six to hold, reflecting a genuine institutional split over how long to tolerate oil-driven inflation.
- The US dollar broke below its January uptrend, a move with significant implications for commodities and international equities.
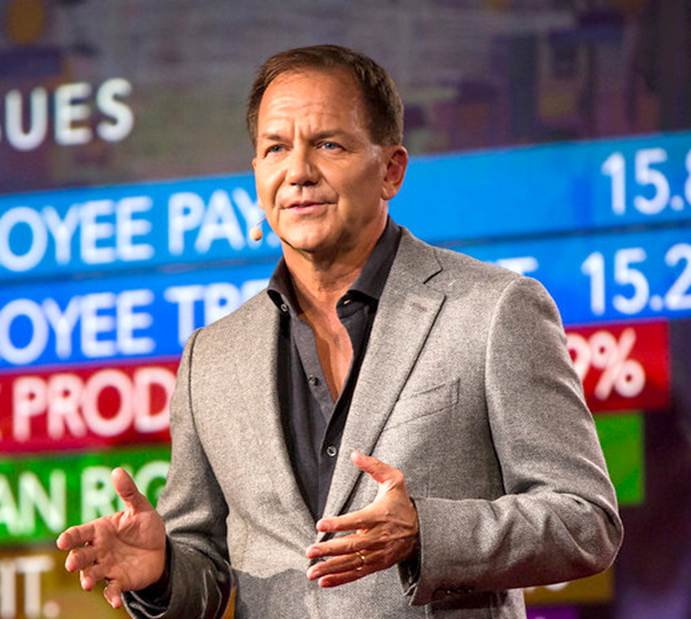
- Paul Tudor Jones outlined his next major swing trade. We dive in.
- Mag 7 earnings are broadly beating, continuing the broader trend we have seen for Q1.
- The ASX 200 finished its eighth consecutive session lower on Thursday, though it was rebounding +0.9% by Friday midday.
- The Bloomberg Commodity Index broke out above multi-year resistance, reinforcing the commodity supercycle thesis flagged in December.
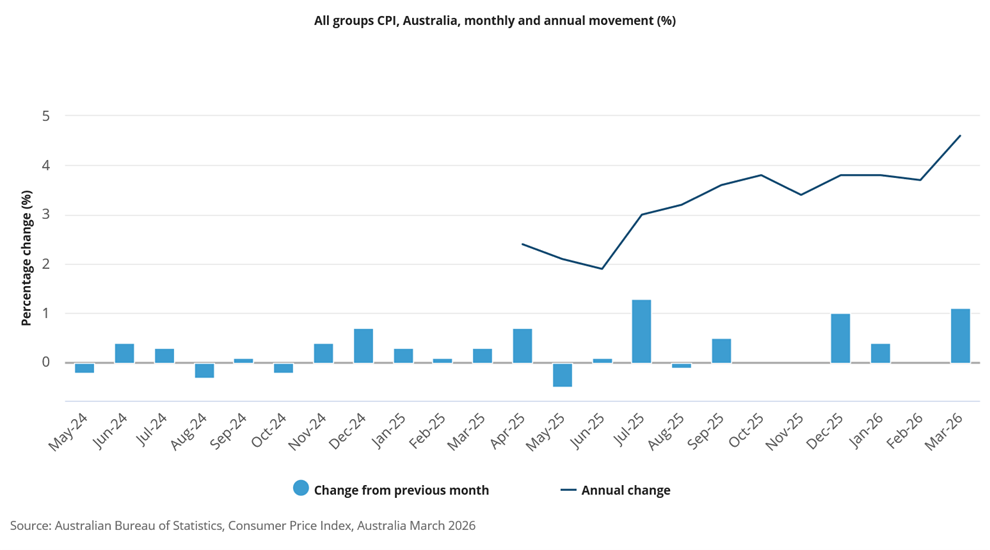
- Australian headline CPI accelerated to 4.6% in March, though it was below consensus; trimmed mean ticked up to 3.5%, keeping the RBA in a difficult position ahead of Tuesday’s meeting.
REPORT SPOTLIGHT
- Suncorp (ASX: SUN)
Full reports across Australasia, Global Equities and Global Mining are available to members, along with our complete model portfolio positioning. If you’re not yet a member, you can join on our Products page.
From the Desk
The US 10-year pushed to 4.43% on Wednesday afternoon, edging into the zone where the bond market stops being a passive observer and starts being a constraint on policy. A similar yield range forced a White House tariff U-turn in 2025. The FOMC chose that moment to deliver its most divided decision in decades – three governors voting to cut, six to hold. This is the institutional machinery of monetary policy, split in real time over how long the inflation impulse from the Iran war can be tolerated. By Thursday, the 10-year had eased to 4.37% on softer inflation and a resilient Q1 GDP at +2%. The pressure point momentarily released. But the bond pressure point remains and looms in the background and could easily become an ultimatum. Nemesis, in the Greek view of these things, is patient.
Brent pulled back to $114 from Wednesday’s $120 print, and WTI eased to $105, with backwardation intact – futures are pricing far-future months materially below spot.
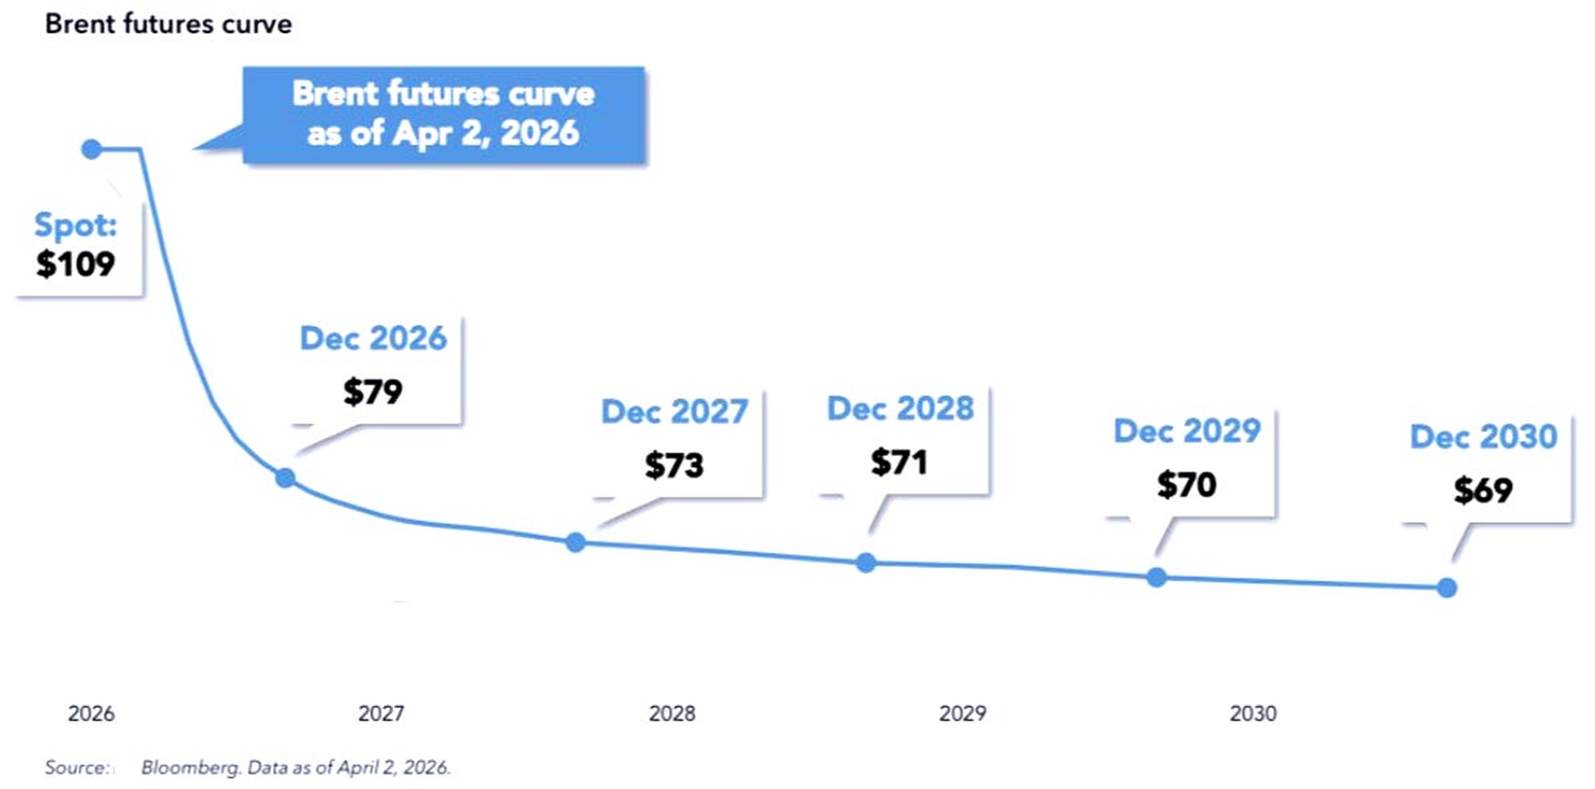
Energy traders expect the war to soon be over, which is also our base case. The April temporary ceasefire signalled DJT was seeking an offramp; US rig counts have not increased since oil surged with the war’s onset, pointing to E&P producers expecting a quick resolution.
The Threshold
The bond market hovered over investors this week, threatening to enforce what diplomatic and political channels are struggling with. The US 10-year at 4.43% sits around the zone that historically forces concession from this White House, and the FOMC’s 3-6 split decision tells you the institutional appetite for holding rates against an oil-price-driven inflation impulse is nearing exhaustion. We noted this week that the 10-year is sending a clear signal that “time is running out” on a settlement with Iran.
The last time the bond market triggered a Washington U-turn was the tariff selloff last year. After a month of turmoil, the 10-year crossed 4.5% – and the White House made a hasty retreat. Tariffs were dialled back, and the bond market settled. History doesn’t always repeat, but it often rhymes. The bond market does not need to push every session to enforce the constraint. It only needs the zone to remain in view.
The Architecture Beneath
We made the call last December that commodity prices were entering a “supercycle” — that has now played out, with the Iran war disruption acting as the trigger we did not foresee. Commodities have soared, and could go much higher if the US dollar resumes its downtrend.
Top economist Steve Hanke from Johns Hopkins reinforced this view powerfully this week: “We’re entering another commodity supercycle. Everything is going up. The US-Israeli war on Iran helped make that happen. So you want to be pivoting your portfolio away from tech into hardcore commodities.”
The Bloomberg Commodity Index closed Thursday at 140.5 after extending its breakout above multi-year resistance – the supercycle is now visible on the price tape. Some recent surges did not start with the war: gold and silver spent most of 2025 rallying to historic highs and are still working off overbought conditions that may persist three to six months. But other commodities are stirring – wheat, copper, the broader complex.
The Bloomberg Commodity Index has broken out above key resistance and is surging higher. We made this call in December last year, and commodities are now in a supercycle in my view and will go much higher over the coming years. The war in the Middle East has been the trigger point. Following the incumbent oil shortages, nations around the world will soon embark on what could be a massive stockpiling of essential materials ranging from food to energy.
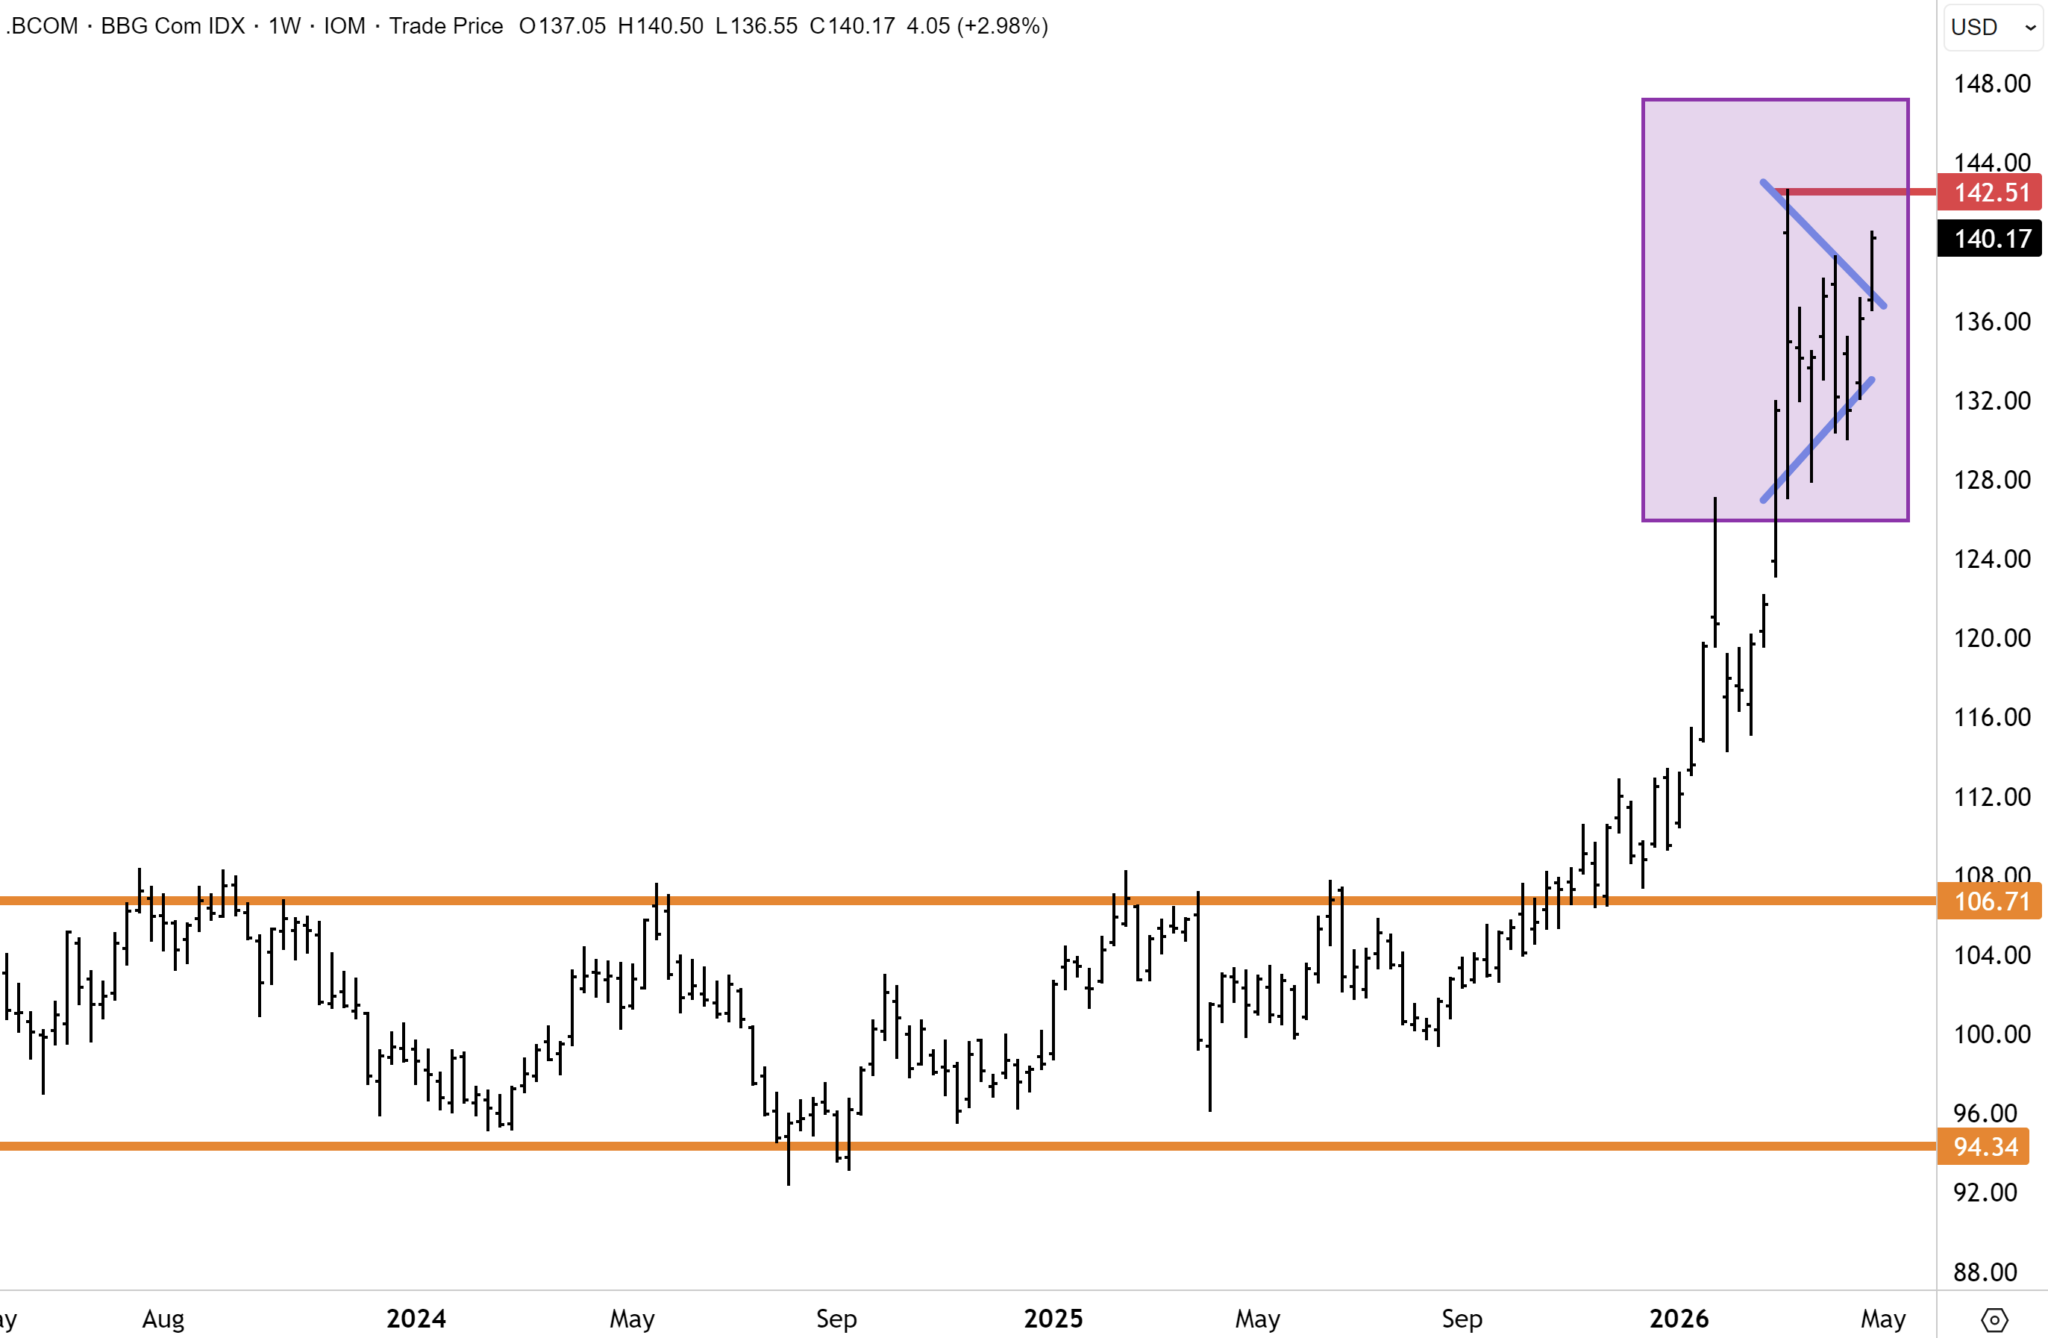
Hanke laid out three structural drivers: low commodity inventories from years of underinvestment; nations stockpiling essentials post-disruption and diversifying reserves away from USD to facilitate it; and AI’s voracious demand for new infrastructure – power, data centres, cooling, steel, copper, grid capacity. While Hanke prefers lithium and vanadium, the supercycle is ubiquitous, lifting everything from orange juice to wheat. I expect the record highs in the Bloomberg Commodity Index to be overtaken within several years.
The clean portfolio expressions sit in bulk and base metals, where the AI-infrastructure demand vector is most concrete. BHP at sector-leading scale carries copper, iron ore and the green-power capex story in one name. Sandfire (SFR) is the higher-beta pure-play copper expression with operational delivery now matching the price thesis. Australian investors are spoilt for choice across the broader complex.
The Big Swing
The international rotation thesis built on the dollar’s breakdown gained powerful endorsement this week from legendary investor Paul Tudor Jones. The DXY broke below the near-term uptrend in place since January to close Thursday at 98.0, with the technical setup pointing to a retest of last year’s 96 lows. Tudor Jones, in a podcast interview, identified the USD/JPY triple-top at Y160 as his next big-swing trade – and named Japan’s new prime minister, Sanae Takaichi, as the catalyst. Takaichi is an Abe disciple with the same governance reform, capital efficiency and pro-business orientation that took the Nikkei from a multi-decade deflationary trap to record highs under Abe. Tudor Jones called her “the most dynamic leader in certainly half a century in Japan.”
Paul Tudor Jones has had a stellar career on Wall Street as a hedge fund manager and is up there with the all-time greats, including George Soros and Stanley Druckenmiller, in my view.
The trade structure is precise: Japan carries a $4.5 trillion net foreign investment position with 60% denominated in US dollars, the yen has fallen more than 50% against the dollar since 2012, and the political catalyst is now identified. The trade is yen long, US dollar short, Nikkei long. JPMorgan’s existing Nikkei target of 70,000 – already 17% above current levels – gains institutional weight when paired with Tudor Jones’ framing. The Invesco Currency Shares Japanese Yen Trust is one way to gain exposure to the yen relative to the dollar. Another way of gaining exposure to Japan is through the Fat Prophets Global Contrarian Fund, which has c25% of the portfolio in Japanese banks, financials and a few select key industrials, including Mitsubishi Heavy Industries. To trade international shares, you can open an account today with our partner CMC Markets.
The Earnings Floor
The S&P 500’s 81% beat rate and 16.1% YoY aggregate earnings growth – near the best quarter since 2021 – are no longer at risk from the mega-caps. Alphabet was the clearest standout: revenue +20% to $109.9 billion, Google Cloud +63% with management explicitly compute-constrained, and a $460 billion enterprise AI backlog that justifies the $180-190 billion FY capex guide. The market read it correctly: GOOG broke to fresh all-time highs above $380 Thursday. Microsoft and Meta sold off on AI capex anxiety, but the structural call sits with the cloud growth and the cost discipline both companies are imposing through headcount reduction. Caterpillar rose to a record high on power generation and construction equipment demand. The bull case is intact.
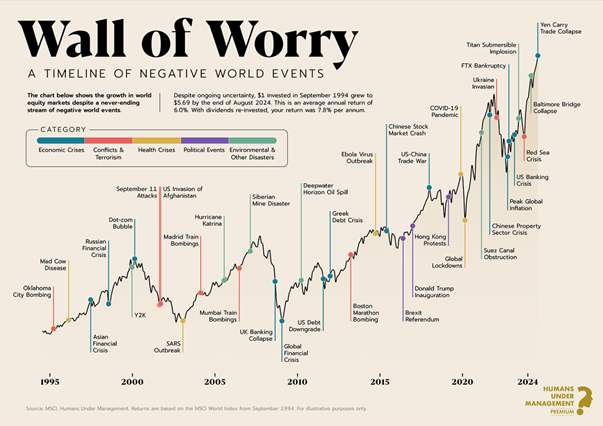
We continue to maintain that the March 30th low in US benchmarks will prove this year’s low. Morgan Stanley CIO Michael Wilson holds a similar view: “With passive investors still under-risked, pullbacks are likely to be shallow… the equity market isn’t just looking through the risks; it has already priced the risks.” Bull markets climb a wall of worry – the sharp March drawdown had all the hallmarks of a correction, not the onset of a new bear market. The next leg higher will likely be driven by renewed outright buying and sideline cash entering as confidence grows around earnings and as ME stalemate fears recede.
The Pause
Gold and the precious metals complex are in an extended overbought reset that may persist three to six months before the next leg higher. Gold pulled back from $4,700 Monday to $4,561 Wednesday before reversing on Thursday’s dollar break to close at $4,650 – net negative on the week despite Thursday’s rally. Silver and platinum followed the same pattern with greater volatility. The reset is digestion, not reversal. The medium-to-long-term bull case for gold and PGMs remains structurally intact.
The Fat Prophets Global Contrarian Fund pared its PGM exposure this week from ~50% to roughly 25%, with the explicit purpose of diversification. We remain bullish on gold, silver and platinum medium-term – though the PGM correction may endure for several more months. The rebalance was prudent risk management, not a thesis change, and the Fund is now holding positive cash balances against other contrarian themes emerging on the horizon.
The ASX Read
The RBA decision on Tuesday, and the positioning that has built around it, looms large. The market is pricing a mid-70-80% probability of a 25bp hike, and the CPI data this week didn’t move the needle materially. Another rate hike could tip the economy toward recession, troubling for the Albanese government ahead of an upcoming budget where leaked reports point to significant structural changes to CGT and negative gearing. Those changes will not alleviate the housing crisis – they will exacerbate it.
The relevant analytical question is not whether the RBA hikes but how it frames the rate path forward. A hike with retained tightening bias hurts banks, REITs and utilities. A hike with conditional or pause-leaning forward language could see them rally. The contrarian call: even if the RBA signals continued aggression, the market is underestimating the potential for cost-out from the banks leveraging technology across their large cost bases. ANZ’s aggressive February cost-out moves showed what could be coming.
Sectors that benefit from a higher-for-longer rates environment sit on opposite sides of the portfolio but work through similar mechanisms. Insurers hold large fixed-income portfolios that fund future claim payments — the float earns materially more than during the zero-rate years, and that improvement compounds quarter after quarter as the bond ladder reprices. Suncorp and QBE are the clean local expressions. Commodity producers benefit through a different channel — higher-for-longer rates almost always reflect persistent inflation and a structurally weaker US dollar, and a weaker dollar lifts demand for USD-priced commodities across the complex. For BHP, Sandfire and Whitehaven, that means higher realised prices in a market where a decade of underinvestment has left supply unable to respond.
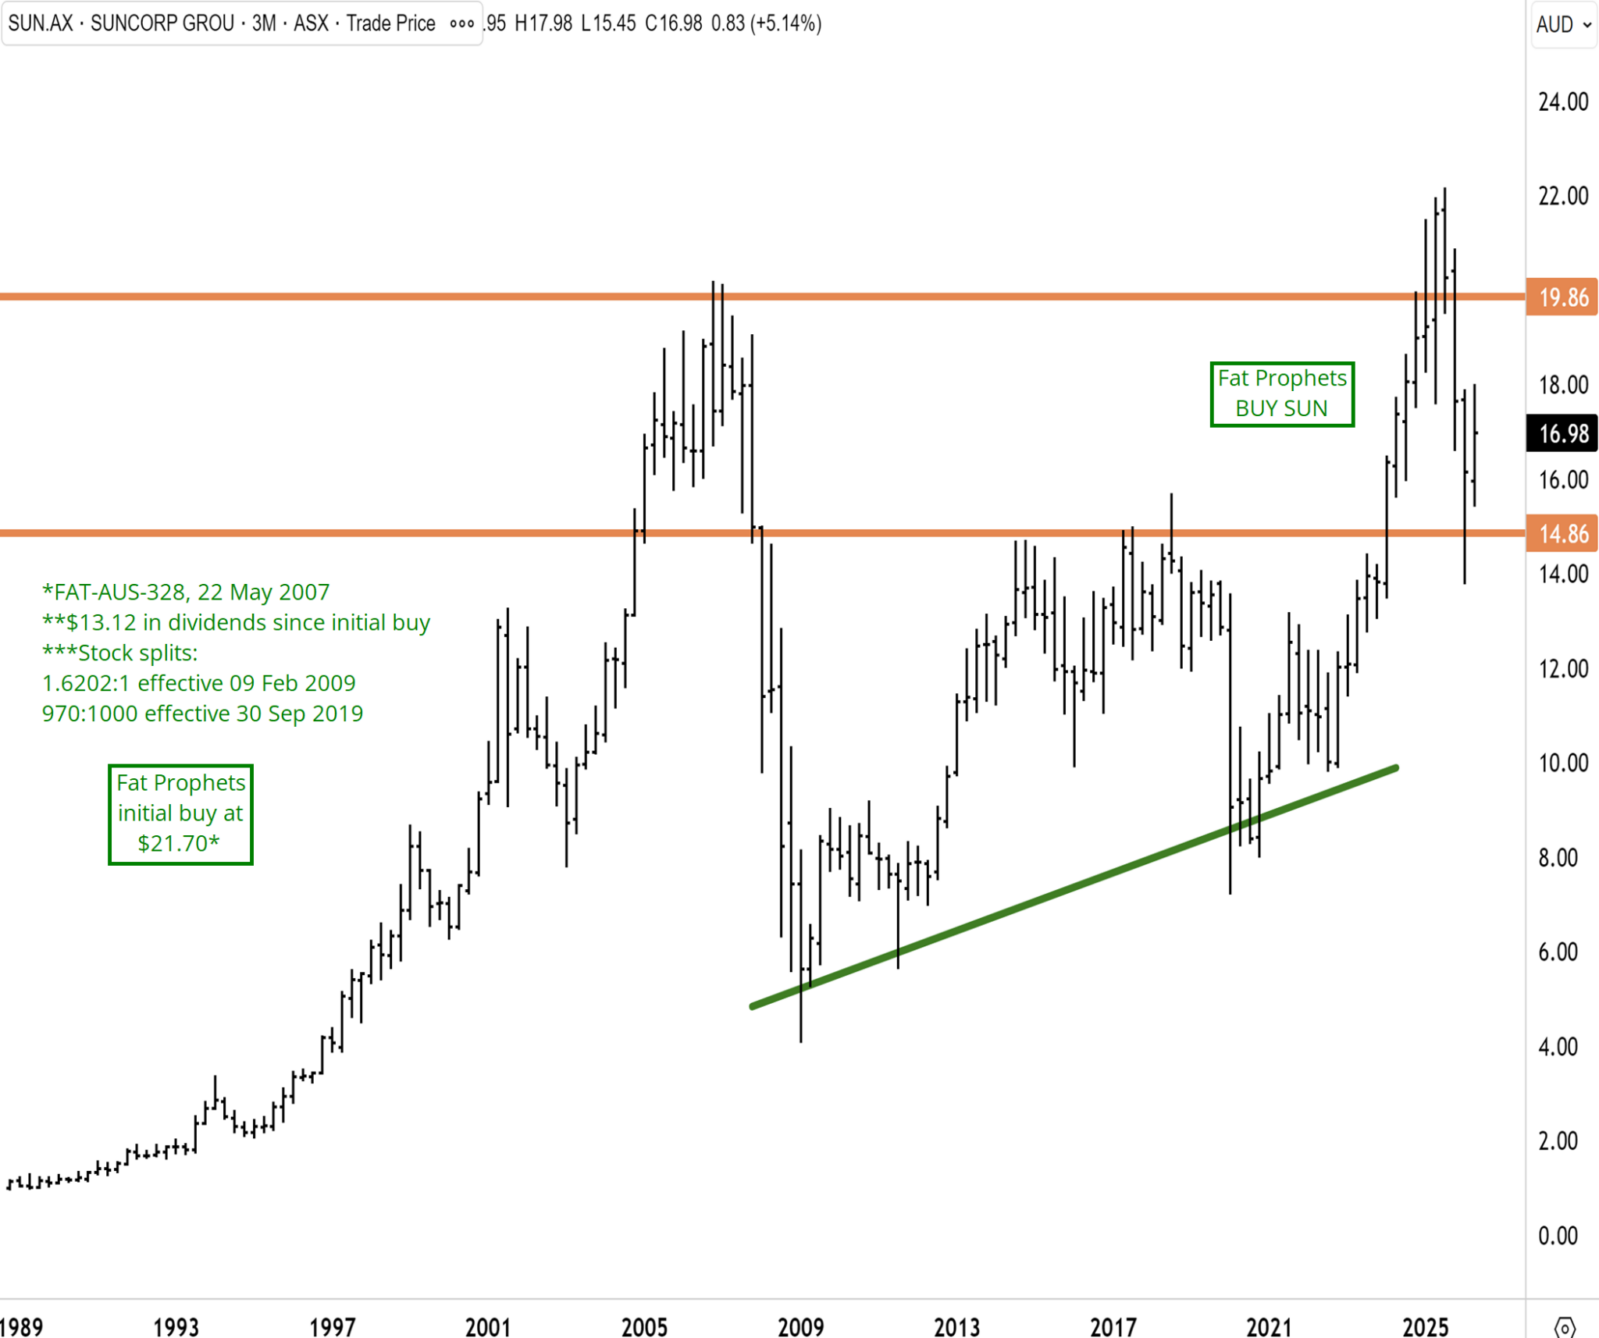
Suncorp (ASX: SUN) — BUY
The investment case for Suncorp has quietly strengthened. A new five-year aggregate reinsurance deal caps natural hazard costs in 90% of scenarios, effectively converting the biggest earnings wildcard in Australian general insurance into a known quantity. Crucially, management expects the structure to be cost-neutral — the protection comes without sacrificing margin, with the underlying insurance trading ratio held at the upper end of the 10–12% target range and around $100 million in capital released in the process. The macro backdrop adds another tailwind: sticky interest rates mean insurers continue to earn elevated returns on their investment portfolios, a structural benefit the market still underappreciates. In an era of worsening weather events and rising climate-risk anxiety, an insurer that can absorb the storms, compound investment income, and still hold its margins is exactly what defensive income investors should own. BUY, particularly for Members without exposure.
Little has changed since our last update on Suncorp. The shares have rebounded dynamically off the big key historical support just below $15 to reach $17 recently. The technical set-up is highly encouraging in our view. Despite the recent selloff from the record highs above $22, Suncorp has held up above the primary uptrend. We maintain our bullish technical outlook on Suncorp, and believe a buying/accumulation window has now opened. Our base case technical view is that Suncorp will retest the record highs either this year or in 2027.
Full reports across Australasia, Global Equities and Global Mining are available to members, along with our complete model portfolio positioning. If you’re not yet a member, you can join on our Products page.
Have a great weekend.
Carpe Diem
Angus