A balance sheet for all seasons
Legacy Archive of Australian Financial Research & Market Publications by Fat Prophets
This archive contains more than 4,000 legacy financial publications — including Australian stock reports, market analysis, market commentary, market predictions, special reports, and portfolio income reports — originally published under Fat Prophets’ flagship Australasian Equities Portfolio and prepared by Fat Prophets’ in-house equity analysts under the supervision of Fat Prophets Chief Investment Officer Angus Geddes.
These publications were originally released exclusively to Fat Prophets members between 2003 and 2017 and reflect the firm’s independent research process, including fundamental analysis, technical analysis, and contemporaneous market views at the time of publication.
Fat Prophets has made this historical research archive publicly accessible to promote transparency, preserve a documented record of past market analysis and investment thinking, and provide investors, researchers, and readers with valuable educational and historical financial content.
Please note: This archived material is provided strictly for educational and historical reference purposes only. It reflects market conditions, economic data, company information, forecasts, opinions, and analysis as they existed at the time of original publication and may no longer be current or applicable. This material does not constitute current investment advice, financial product advice, or a recommendation to buy, sell, or hold any financial product or security.
To explore more current insights and discover the benefits of full membership, including access to Fat Prophets’ latest research, model portfolios and investment recommendations, visit our Products page.
Legacy Content
While Westpac’s (WBC.ASX) share price has underperformed the broader market by around three percent over the last 12 months, we believe the sell-off has now run its course. This is not to say that we expect Westpac’s share price to rally significantly from here, but rather that the bank’s share price now approximates fair value. Having delivered a reasonable FY15 performance and taken a number of steps to bolster its balance sheet, we continue to rate Westpac as a Hold.
What’s new?
While it has only been a couple of months since we last updated our thoughts on Westpac in FAT-AUS-733, a lot has happened over the intervening period. In our view, there have been three key developments in recent months. First, Westpac’s investor day in early September that provided some insights about the bank’s growth strategy. Secondly, the bank’s FY15 results, which were released in mid-October. And lastly, Westpac’s capital raising.
Starting with Westpac’s unaudited full-year result for the 12 months ending 30 September 2015, the bank reported a statutory net profit of $8 billion, with this representing growth on the corresponding period of 6 percent. While this is reasonably positive result in our view, we note that on a cash earnings basis, which is typically more indicative of underlying performance, Westpac’s full-year growth was limited to 3 percent, and 2 percent on a cash earnings per share basis.
In line with the modest increase in Westpac’s cash earnings per share, the Board intends to declare a final dividend of 94 cents per share, with this representing an increase of 2 cents per share on the previous corresponding period. As has been the case in previous periods, and as evidenced by the dilution from cash earnings to cash earnings per share, Westpac’s Dividend Reinvestment Plan (DRP) will be available for the 2H15 dividend.
At the Group level, Westpac’s FY15 result is somewhat mixed. In our view, the key positives included the (i) performance across most of the bank’s operating segments (with the exception of the institutional business), and (ii) continued improvement in the bank’s asset quality (i.e. bad debts) and CET1 ratio. In contrast, the key negative in our view was the 57 basis point decline in the bank’s cash return on equity to 15.8 percent.
Looking at the compositional drivers of Westpac’s 4 percent increase in net operating income to $20.5 billion, we note that the core business (i.e. lending) was the key drivers. While the bank’s net interest margin (NIM) was unchanged on the previous corresponding period, net interest income nonetheless jumped 6 percent on the back of a commensurate increase in average-interest earning assets – lending for the Group increased by 7 percent, while customer deposits increased 4 percent.
In contrast, Westpac’s non-interest income was largely unchanged on FY14 at $6.3 billion. On the positive side, the bank’s non-interest income did benefit from sound growth in wealth and insurance, and a positive impact from hedging offshore earnings. However, this was offset by higher insurance claims from severe weather events, the partial sale of BTIM in 2H15, lower performance fees and lower trading income.
While the growth in Westpac’s net operating income was reasonable given the prevailing market conditions, the bank’s overall profitability was crimped by rising costs. In particular, we note that Westpac’s operating expenses increased 5 percent, while impairment charges increased 16 percent. In terms of Westpac’s operating costs, management stated that this was due primarily to higher growth expenditures – the expense to income ratio increased 40 basis points to 42 percent.
With this backdrop (albeit on an unaudited basis, with the audited FY15 results due to be released on 2 November 2015), Westpac announced its intention to raise $3.5 billion via a fully underwritten, pro rata accelerated entitlement offer. This follows hot on the heels of the Westpac Capital Notes 3 issue that raised $1.3 billion in September 2015. In both instances, the purpose of the capital raising is to bolster Westpac’s CET1 ratio in anticipation of higher regulatory requirements.
Under the terms of Westpac’s latest offer, eligible shareholders are able to purchase 1 new share for every 23 ordinary shares that they hold on the record date (i.e. 7pm on 19 October 2015). Notably, Westpac has already completed the institutional component of its latest entitlement offer, raising $1.6 billion at a clearing price of $30 per new share, with this representing a 2 percent premium to the Theoretical Ex-Rights Price (TERP) – which is a positive indication, in our view.

Source: Westpac
With the retail component of Westpac’s latest entitlement offer scheduled to open on 23 October 2015 (and remain open until 5 pm on 11 November 2015), now is a good time for Members to be considering their options. There are really two options. First, participate in the offer by paying $25.5 per new share, with this representing a 13.1 percent discount to the dividend adjusted TERP and a 13.6 percent discount to the final 2015 dividend adjusted last closing price.
The second option is to trade the entitlements (i.e. rights) on a deferred settlement basis (using the code WBCN) from 19 October, or on a normal settlement basis from 27 October, or do nothing. The latter of which will result in the entitlement being allocated to the retail shortfall book-build in mid-November, the proceeds from which will then be distributed to the eligible shareholder – not unlike the institutional component, the price of the rights will depend on demand within the book-build.
Key takeaways
As evidenced by demand from institutional investors (approximately 95 percent of entitlements were taken up by eligible institutions) and the performance of Westpac’s share price in the lead up to the record date, we expect demand from eligible retail investors to be high. While no doubt a calculated move, the concurrent release of Westpac’s unaudited results for FY15 and the bank’s recent decision to raise its residential mortgage rate by 20 basis points will help create demand.
As illustrated in the following graphic, Westpac is currently positioned comfortably within the top quartile of the world’s listed commercial banks, as is expected to be required by APRA. While management estimates that Westpac’s domestically reported CET1 ratio will fall from 9.4 percent in FY15 to 9.3 percent upon completion of the entitlement offer, this is due to an offsetting increase in its mortgage RWA, with the globally comparable CET1 ratio expected to increase to 14.1 percent.
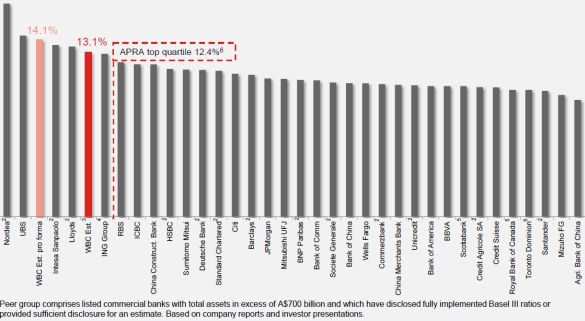
Source: Westpac
Given the anticipated increase to Westpac’s globally comparable CET1 ratio, it seems reasonable in our view to assume that the bank will now have sufficient capital to continue operating for the foreseeable future. With this in mind, it is interesting to note that Westpac recently held an investor day in Sydney. The purpose of the event was to provide the bank with the opportunity to outline its growth strategy for the next several years.
The key takeaways from Westpac’s investor day was the (i) reaffirmation of the bank’s return on equity target above 15 percent, (ii) management’s expense to income ratio target of below 40 percent within three years, (iii) management’s target to add over 1 million new customers over the next two years, (iv) management’s intention to increase annual investment spending by 20 percent to $1.3 billion, with a focus on growth and productivity.
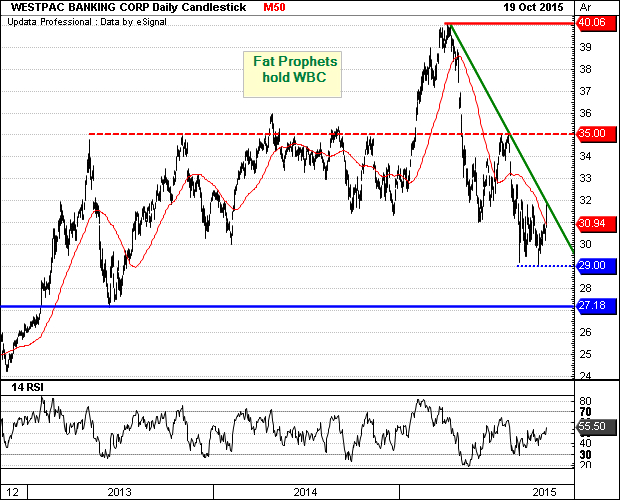
Turning to the charts, we note that having formed an interim support at $29, Westpac’s share price has rotated higher, closing above the 50-day moving average. However, since gains have been capped by the downward sloping trend line for the past six months, it will require a decisive break out above this boundary in order to reverse the near term trend.
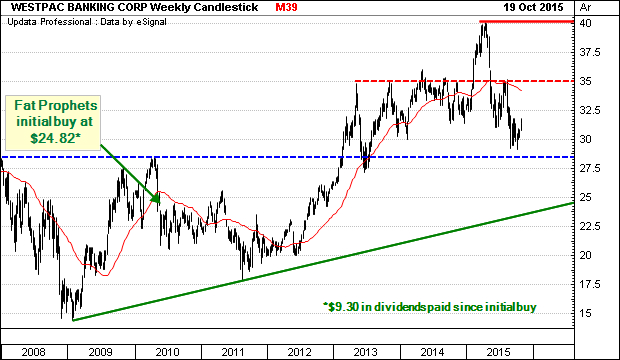
From a longer-term perspective, we note that the momentum in Westpac’s share price has continued to stall following the highs of $40.06 earlier this year. Given the preceding decline and with prices edging closer to support at $27.18, further consolidation around this region would be beneficial for the recovery in the coming months.
Summary
While our relative preferences within the Australian banking sector remain National Australia Bank (upside from the sale of non-performing businesses) and Bank of Queensland (leverage to the Queensland’s tourism and property markets), we continue to consider Westpac a Hold. This is based on the bank’s positive operating performance (particularly with respect to its core businesses), reasonable valuation metrics, particularly with respect to yield, and strong capital position.
As such Members need to consider their options with respect to the rights issue carefully, and have some regard to their individual circumstances. Prima facie a sound alternative would be for Members to trade their entitlements, and use the proceeds to invest in our preferred sector exposures being NAB and Bank of Queensland.
Accordingly, Westpac will remain held in the Fat Prophets portfolio.
Disclosure: Westpac is held in the Fat Prophets Australian Share Income model.