
1Q19; more did come
Saracen Minerals (ASX:SAR) has enjoyed a continued surge in gold production, with the delivery of a first quarter production record. Leading the charge was the company’s Carosue Dam, turning in a strong performance for the quarter. All-in sustaining costs went sub A$1,000 an ounce for the quarter, while the gold price pushed higher. Guidance for 2019 remained unchanged.
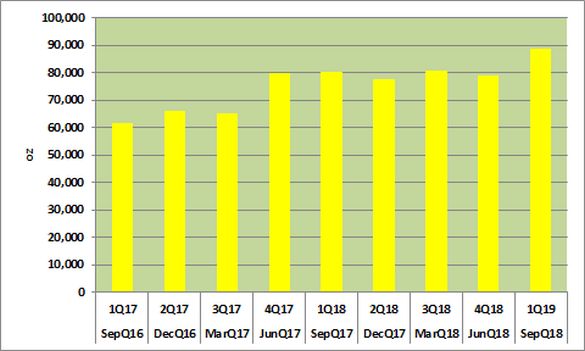
For the September quarter, the company delivered a record in gold production with its Carosue Dam the standout. The following chart shows quarterly gold production:
Source: Saracen Minerals (ASX:SAR)
Gold production for the September quarter rose by a very healthy 10.8% compared to the same quarter in 2017, to a quarterly record of 88,940 ounces of gold.
The Carosue Dam mine produced a record 51,753 ounces of gold for the September quarter, which represents an increase of 20% on the same quarter in 2017. The following chart shows quarterly gold production for the Carosue Dam mine:
Source: Saracen Minerals (ASX:SAR)
Driving the Carosue Dam result was a higher mill grade which came in at 2.7 grams per tonne (g/t) gold compared to the 2.1g/t reported a year earlier. Milling was effectively flat at 647,000 tonnes compared to 646,000 tonnes from a year earlier. Gold recovery dragged with the reporting of a gold recovery rate of 91.6% compared to 93.0% for the September quarter 2017.
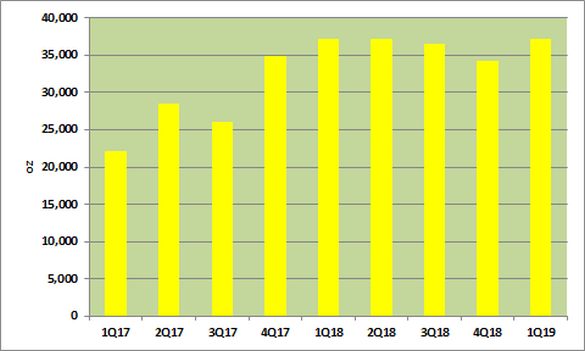
Off the pace was the Thunderbox mine, reporting flat gold production of 37,187 ounces compared to 37,191 ounces for the corresponding quarter for 2017. The following chart shows quarterly gold production from inception for the Thunderbox mine:
Source: Saracen Minerals (ASX:SAR)
Behind the Carosue dam result was a lower gold grade, reporting 1.7g/t for the September quarter 2018, which was shy of the 2.2g/t reported for the September quarter 2017. Partial offsets where found in milling and gold recoveries, both of which were higher compared to the September quarter 2017. Ore milled rose by 34%, to 741,000 tonnes and gold recovery was 94.3% compared to 93.3%.
Guidance for 2019 remained unchanged and is forecast to be in the range of 325,000 to 345,000 ounces of gold.
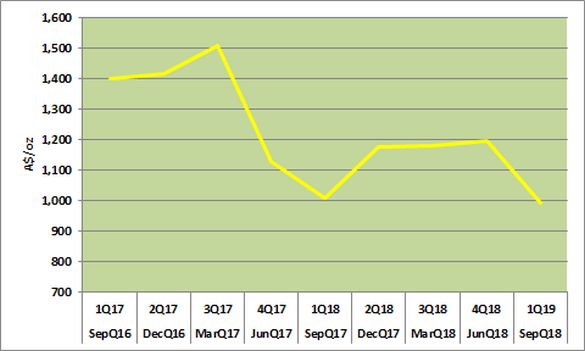
The increase in gold production for the September quarter brought with it an improvement in all-in sustaining costs (AISC). The following figure shows quarterly AISC:
Source: Saracen Minerals (ASX:SAR)
The September quarter brought with it an improvement in AISC of 1.5% compared to the same quarter in 2017, to A$993 an ounce. Driving the result was the improvement in production with processing costs falling by 18.2% on the higher ounces produced.
AISC guidance for 2019 is forecast to be in the range of A$1,050 to A$1,100 an ounce and was unchanged.
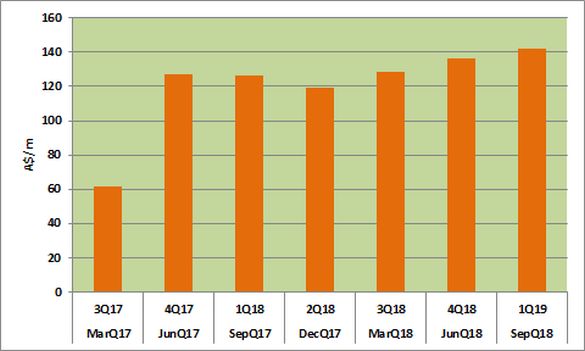
The company reported an average realised gold price for the reported quarter of A$1,600 an ounce, which was 1.1% higher when compared to the same outcome from a year earlier. Revenue was 12.4% ahead of the corresponding quarter in 2017, to A$142 million. The following chart shows quarterly revenue:
Source: Saracen Minerals (ASX:SAR)
Both the higher realised gold price and production numbers were behind the improved revenue number.
We retain a positive outlook on the gold price for the year-end 31 December 2018 and into 2019.
Expectations of higher inflation in 2019 will be a key tailwind for the gold price. The potential debasing of the US Dollar on rising sovereign debt may well be a headwind for the US Dollar in 2019. Moreover, the strengthening of other major currencies against the US Dollar, as downward pressure from quantitative programmes and low interest rates reverse in 2019, will also add to the US Dollar headwind. We expect gold at the close of calendar 2018 to be in the range of US$1,300 to US$1,375 an ounce.
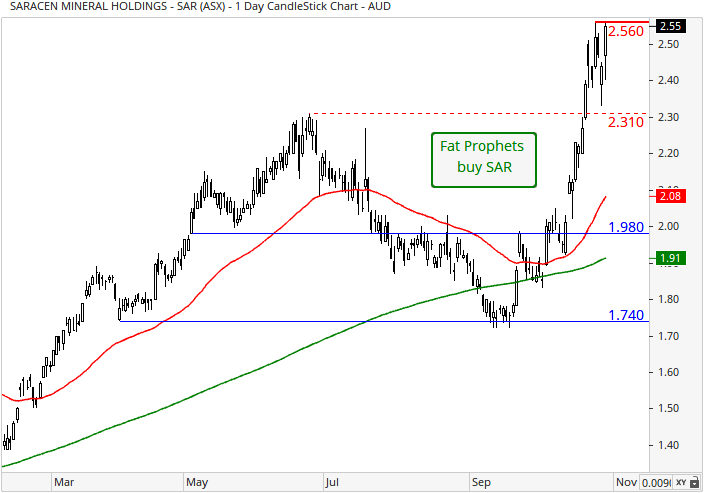
Turning to the daily chart, prices have reclaimed the May high of $2.31, with a staunch upside move now underway. Resistance at the recent all time high of $2.56 is being tested, and a successful breach would further boost the technical outlook.
To provide some certainty around the gold price, the company carries a gold hedge of 272,400 ounces of gold at an average delivery price of A$1,743 an ounce. At the time of writing, the Australian Dollar gold price was trading around A$1,726 an ounce, which positions the average deliver price of the hedge “in-the-money” and therefore likely to be utilised profitably. We hold no concerns over the position, given the volatility in both the gold price and the Australian Dollar/United States Dollar exchange rate.
The company at 30 September 2018, held cash totalling A$111.2 million and carried no debt. This figure compares very favourably with the A$49.8 million cash carried at 30 September 2017. The company also carried A$10.9 million in gold bullion in transit compared to A$10.7 million from a year earlier. On the snap shot of the balance sheet, we have no concerns over its structure.
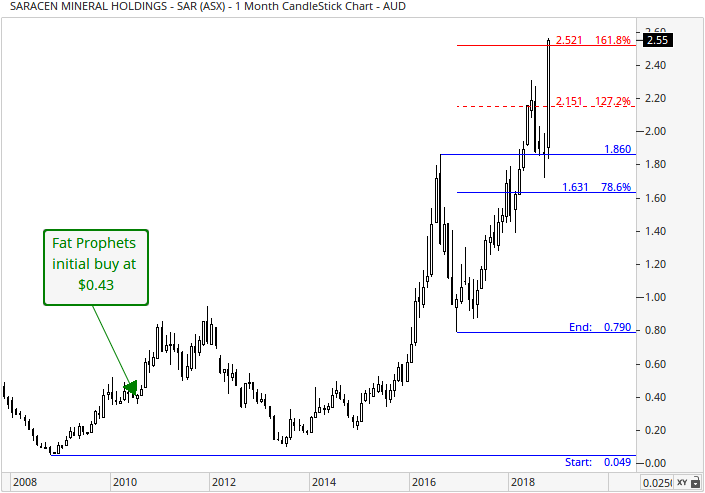
With reference to the monthly chart, prices have closed above the 78.6% Fibonacci retracement (red set of retracements) of $1.63. This activated the next longer term upside target at $2.15, being the 127.2% Fibonacci extension, which has since been breached. Resistance at the 127.2% Fibonacci around $2.52 is now being toyed with, and opens up blue sky beyond that price.
We believe it is the company’s progress toward 400,000 ounces of gold production and its financial strength that warrants exposure.
Add the brownfield potential we see in both the Carosue Dam and Thunderbox sites and the ability to fund a major exploration campaign and that makes the value equation, in our view, compelling.
Consequently, we continue to recommend Saracen Mineral Holdings (ASX:SAR) as a high conviction buy for Members with no exposure to the stock.
Disclosure: Saracen Mineral Holdings (ASX:SAR) is held within the Fat Prophets Concentrated Australian, Small & Mic Cap and Mining & Resources managed account portfolios.

