

Key Market Insights and Stocks Covered This Week
- The Fed raised rates for the first time since 2023, and the wrong end of the curve moved.
- Oil has become the key market variable.
- This time is different. Everyone is reaching for the 2022 comparison with the Fed and rates. The starting point says otherwise.
- Gold absorbed a hawkish Fed, a stronger dollar and a higher two-year in one week, and held. We outline our current view.
- The IMF wants Canberra to steer a tighter path. The RBA looks set to raise rates into a falling housing market.
- Some $40 billion in dividends is expected to land for Australian shareholders over the next two months, some of it from miners the market still underrates.
Report Spotlight: St Barbara
The fatLITE is the weekly read. Membership is the position.
The Verdict
We began the week arguing that a rate rise would be a clearing event for the bond market, and sharpened that to a preference for a dovish increase that signalled a short cycle. Wednesday’s US session rejected that reading, and we conceded as much in print on Thursday morning. By Thursday, the market delivered it. US yields fell across the curve, and the 10-year dropped back below the 5% ‘red line.’
Our underlying position holds. A great deal of bad news is already priced into fixed income, and yields will fall when oil retreats. The long end behaved as we expected, with the 10-year and the 30-year sitting still through a hawkish decision rather than selling off. The repricing happened at the short end instead. The two-year rose 8bps on the day of the decision to 4.74%, around 74bps above the top of the new 3.75% to 4.00% range, which is the bond market pricing in at least one more increase.
Oil is increasingly the key variable here. Crude fell on Thursday after Saudi Arabia said its Red Sea pipeline would restart within days, and that move is what took the 10-year back to 4.93%. Markets now price a 53% chance of an October increase, up from 27% a week ago. We think the Fed skips October with the midterms ahead of it and that December is the live meeting. That puts us on the other side of current pricing. Oil is the most likely to be the swing factor.
We remain constructive into year-end and are not moving to a defensive stance. The US economy is still very strong, with robust retail sales data pointing to resilient consumers still spending, and the good news is that this points to another solid earnings season when reporting gets underway next month. However, there is a clear imperative for an agreement to be reached in the ME and a reset lower for oil prices. As we have seen before, the narrative around oil prices and inflation can change quickly. Resources remain attractive, with our Commodity Super-cycle still in play, alongside companies with reliable cash flows. We see the hyper-scalers as cheap here.
The Calls
The FOMC voted unanimously on Wednesday (US time), with Chair Kevin Warsh saying inflation had shown little improvement even as the economy strengthened, and the dot plot pointing to one more increase this year. The market had it 95% priced in by Tuesday, up from 33% only weeks earlier, so the decision carried no information. The path did, and that hurt stocks on Wednesday before reversing on Thursday, when the S&P 500 added 1.14% to close at 7,637.
The 2022 comparison being reached for by some does not hold, in our view. Inflation then ran above 9%, with the 10-year near 2% when tightening began, having sat below 1% in 2020. Today inflation is far lower, and the 10-year starts at 5%. The yield curve has already done most of the work the Fed had to do by force last time, which is why a long tightening cycle by the Fed is not our base case.
During the last tightening cycle, the Fed was forced to lift rates very quickly as inflation soared above 9%. In April 2020, the US 10-year yield was just 0.5%, and around 1% when the Fed began tightening a few years later. Today the US 10-year yield is at 5%, which marks a big difference in terms of the starting point for this rate hike cycle.
The variable that can hurt our view is oil, and a new vulnerability has the market on edge. Saudi Arabia has routed crude around the Strait of Hormuz through the Petroline, 1,200 kilometres from Abqaiq to Yanbu, built in 1981 for that purpose and carrying a reported 7m barrels a day. Most of it sits underground and is defended. The pumping stations sit above ground and are not, which is the vulnerability we named in our regular correspondence in July and which has recently been exploited. Saudi Arabia says it restarts within days at half capacity.

The Brent-WTI spread has narrowed from its traditional $5 to $7 premium to roughly $3, with WTI at $101 and Brent at $104. While there are underlying differences (sulphur content and chemical properties), both refine into the same products. The squeeze is in Middle East barrels that cannot move.
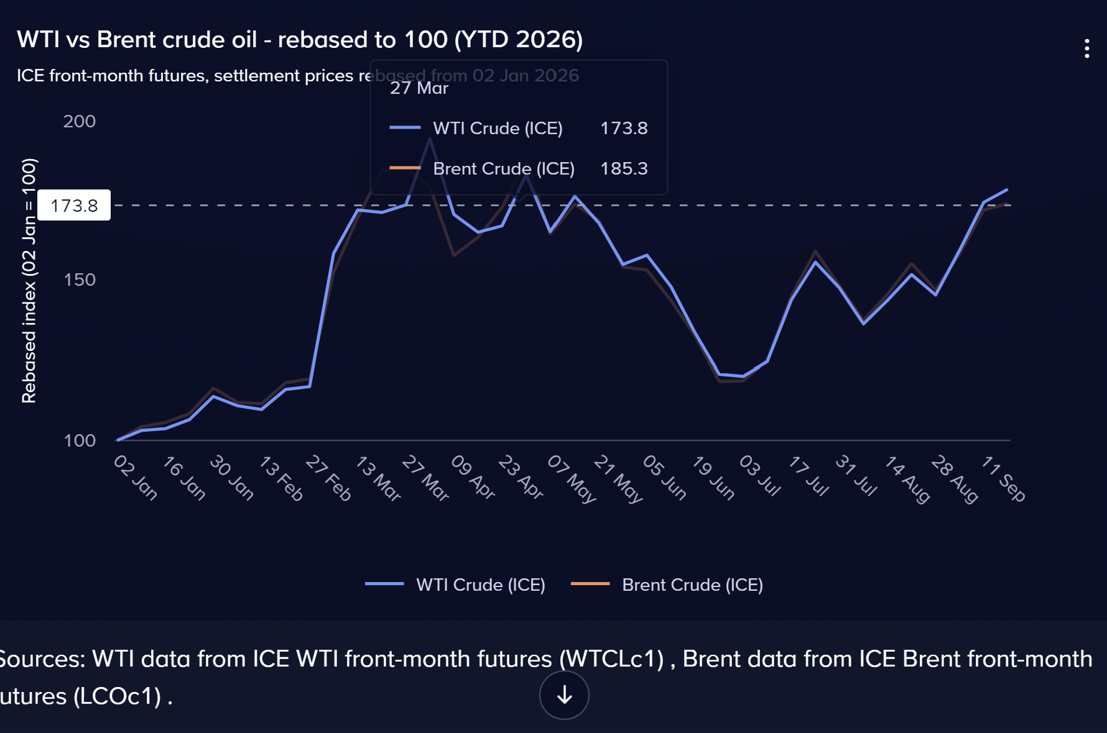
The defence of that pipeline is no easy task, with missiles an effective consumable, and they are reportedly being consumed at an uncomfortable pace. The Houthis are now effectively controlling the Southern Coast of Yemen, where they are exerting control over the narrow Red Sea strait. This strait sits between Djibouti and Eritrea and Yemen, and at the narrowest point is about 23 kilometres wide, well within striking distance of drones and other short-range projectiles. The Strait is notably narrower than the SoH.
Effectively, Middle East crude now runs a gauntlet at both ends, and escalation from an increasingly constrained Iran is the probable path if a settlement is not reached. Against that, sanctions have stalled Iran’s economy, the White House faces an election, and Xi and Trump meet in Washington next week.
However, as we have seen before, just when things look the most dire in ME, an agreement hits the take and sends markets through the roof. We can’t rule this out, and despite the prevailing stalemate, it seems that both sides might soon come to an agreement and “get off the rock” that dislodged the last negotiations. DJT might be a lot of things, but he is canny when it comes to winning elections. It would not surprise me if Washington were secretly working on a deal that would fully reopen both Straits that could then be announced prior to the mid-term elections.
Diesel prices have hit the highest level on record as refinery crack spreads continue to widen. Higher fuel and fertiliser costs are disrupting farming and pushing up food production costs.
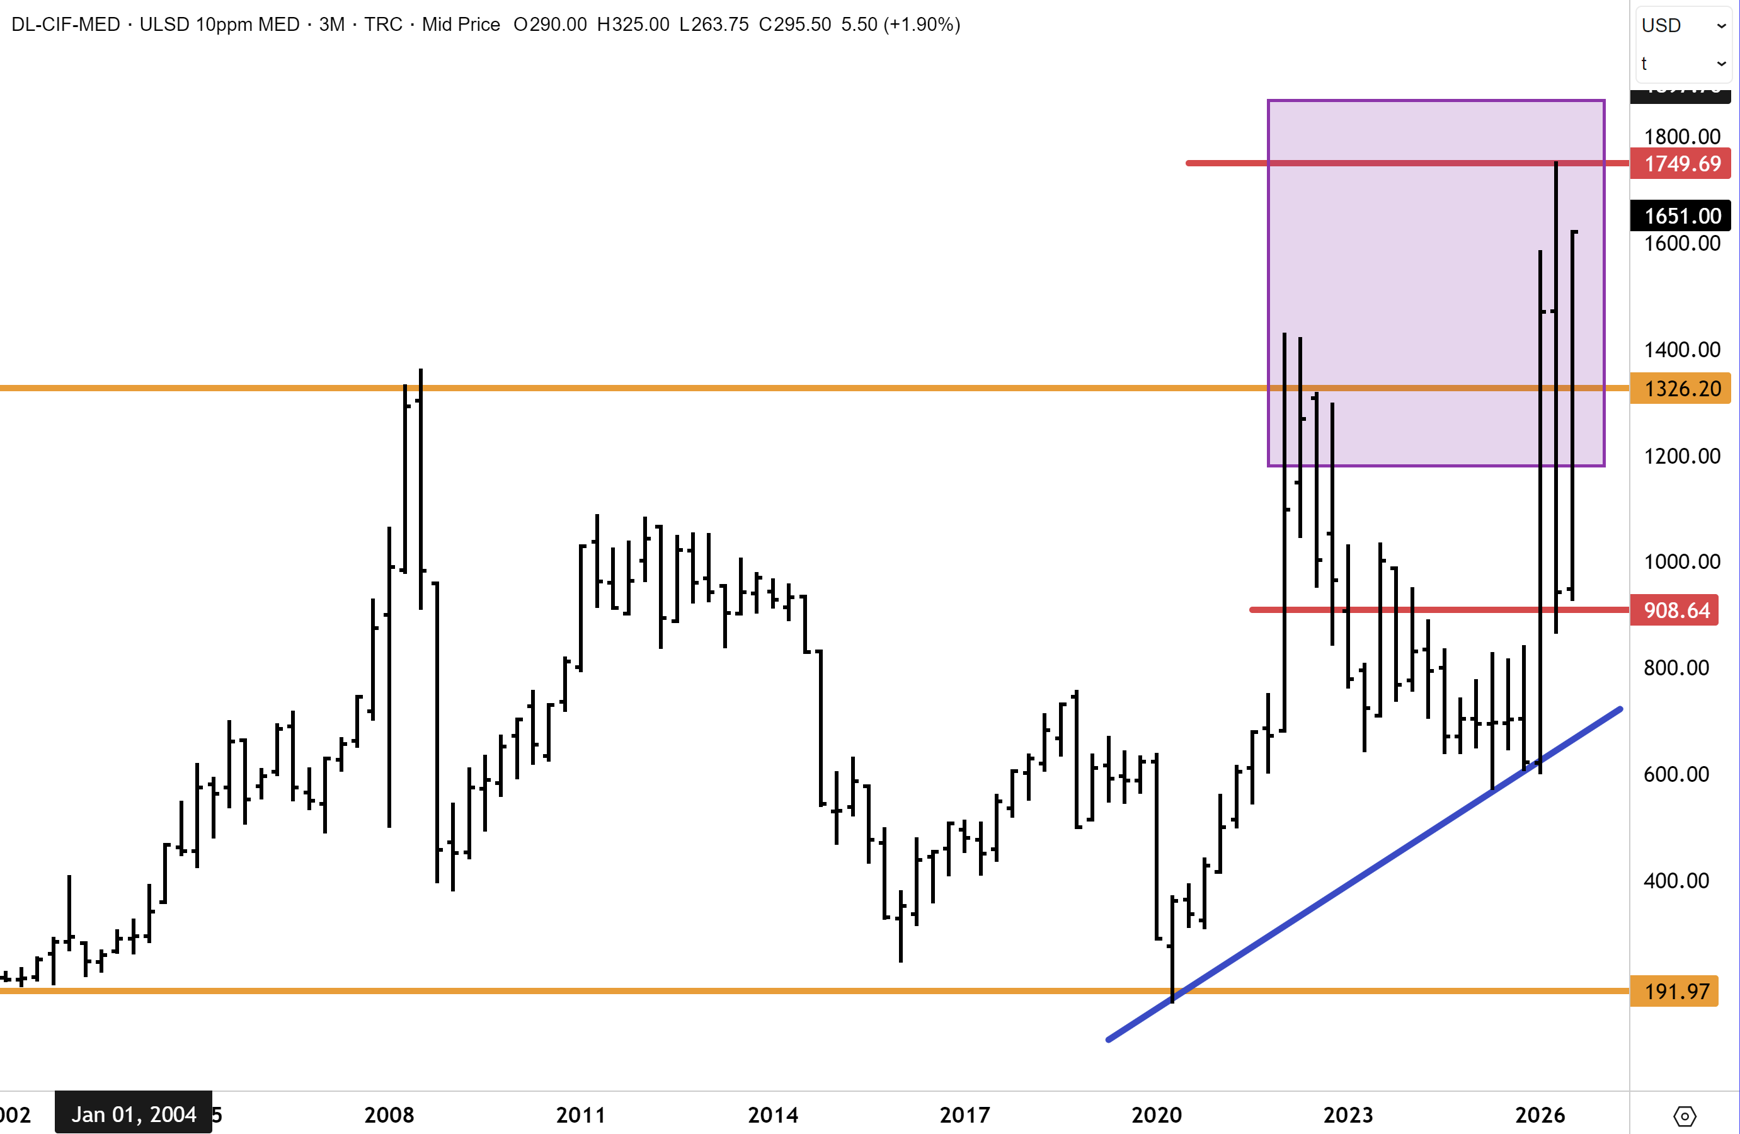

The equity market spent the week refusing to believe in the longevity of an energy crisis. The Australian energy sector was down by about 2% over the past week. That is a market pricing the spike as temporary.
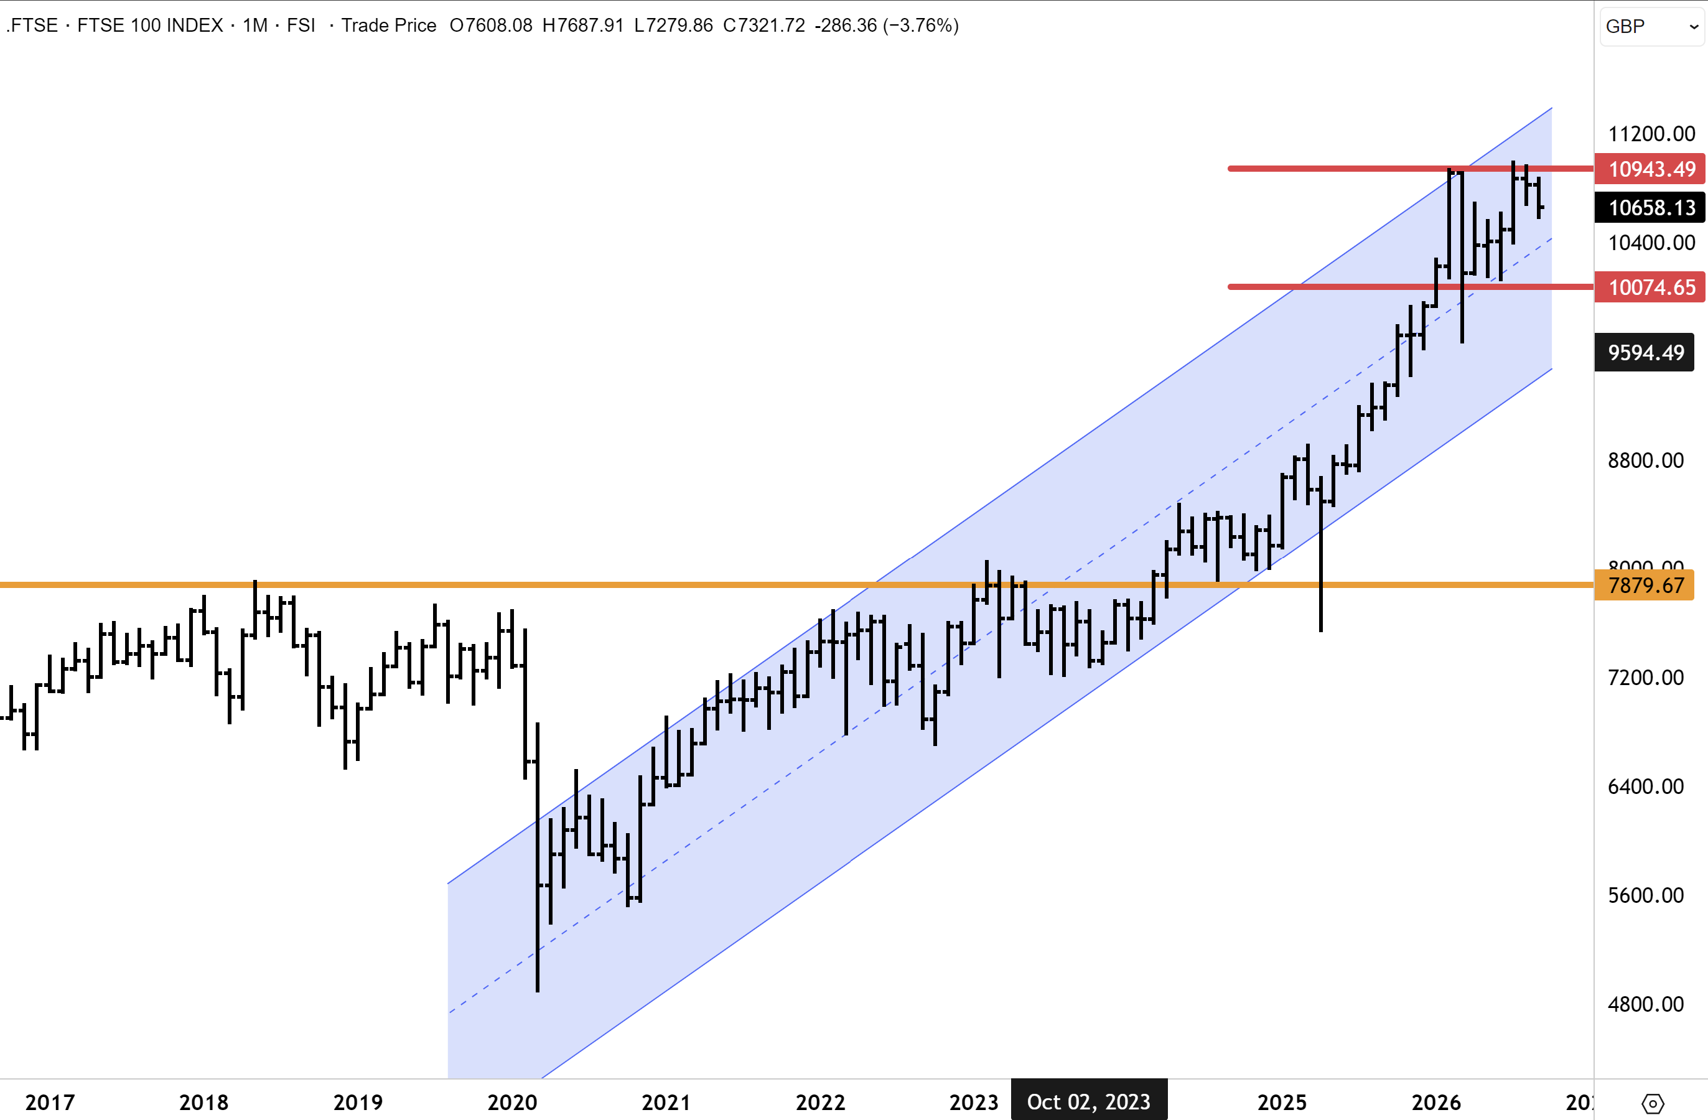
International markets remain appealing, often with substantially lower valuations than in the US. The FTSE 100 continues to look attractive, carried by miners and oil majors, while the Bank of England held at 3.75% on a 6-3 vote. UK CPI rose to 3.1% in August with motor fuels up 23% over twelve months, the third rising print from a 2.6% June trough. The same energy pass-through is visible everywhere. Resource-weighted indices are performing solidly.
The FTSE100 index, which is heavily weighted to resource and energy names, is likely to continue higher in what is a consistent uptrend channel. Similar to the ASX200 Materials Index, the FTSE100 has corrected from the highs near 11,000, but the dominating feature on the chart below is the series of higher reaction lows. The FTSE100 index has had several retests of the 11,000 high, which points to an approaching breakout to new record highs in my opinion. Similar to Australia, the ongoing noise around the UK economy has not been able to derail the bull market in the top 100 British companies.
The Bank of Japan decides today, after we write this. A 25bp increase to 1.25% is close to universally expected and priced, but the guidance will be the key factor. If Ueda leans on inflation risk rather than growth, that supports the Japanese banks, where we remain overweight Japanese banks, including Sumitomo Mitsui (JP: 8316).
The Local
The ASX 200 closed Thursday at 8,732 against 8,749 on Monday. Late on Friday afternoon, the benchmark was looking like a flattish close, down approximately 1% over the past week. Healthcare was the strongest over the week, up more than 2% at the time of writing after having attracted defensive flows. Financials were modestly lower, helped by a solid Thursday, after Citi lifted National Australia Bank to Buy with a $42.10 target. That was a broker upgrade rather than a change in the operating picture, and we would not read the banks as automatic beneficiaries of higher rates, since wider lending margins often get taken back by deposit competition, slower credit growth and rising arrears. However, we do see the banks as being underestimated in the scope for digitisation to continue, which will further increase efficiency and reduce costs over the coming years. Insurers are a cleaner expression of rising yields, and we remain bullish in the sector, liking Suncorp and QBE.
Our commodity super-cycle call is intact. With rates elevated, we prefer producers generating cash now over developers who still need to raise it. Copper is our preferred base metal. The majors BHP and Rio Tinto look attractive as copper takes a rising share of group earnings. We also like pure plays like Capstone Copper.
Roughly A$40 billion of dividends reaches shareholders across September and October, with the resources sector a key driver. We still see the broader investment industry as underestimating cash flow and earnings power here due to overly conservative forecasts for metal price decks over the coming years.
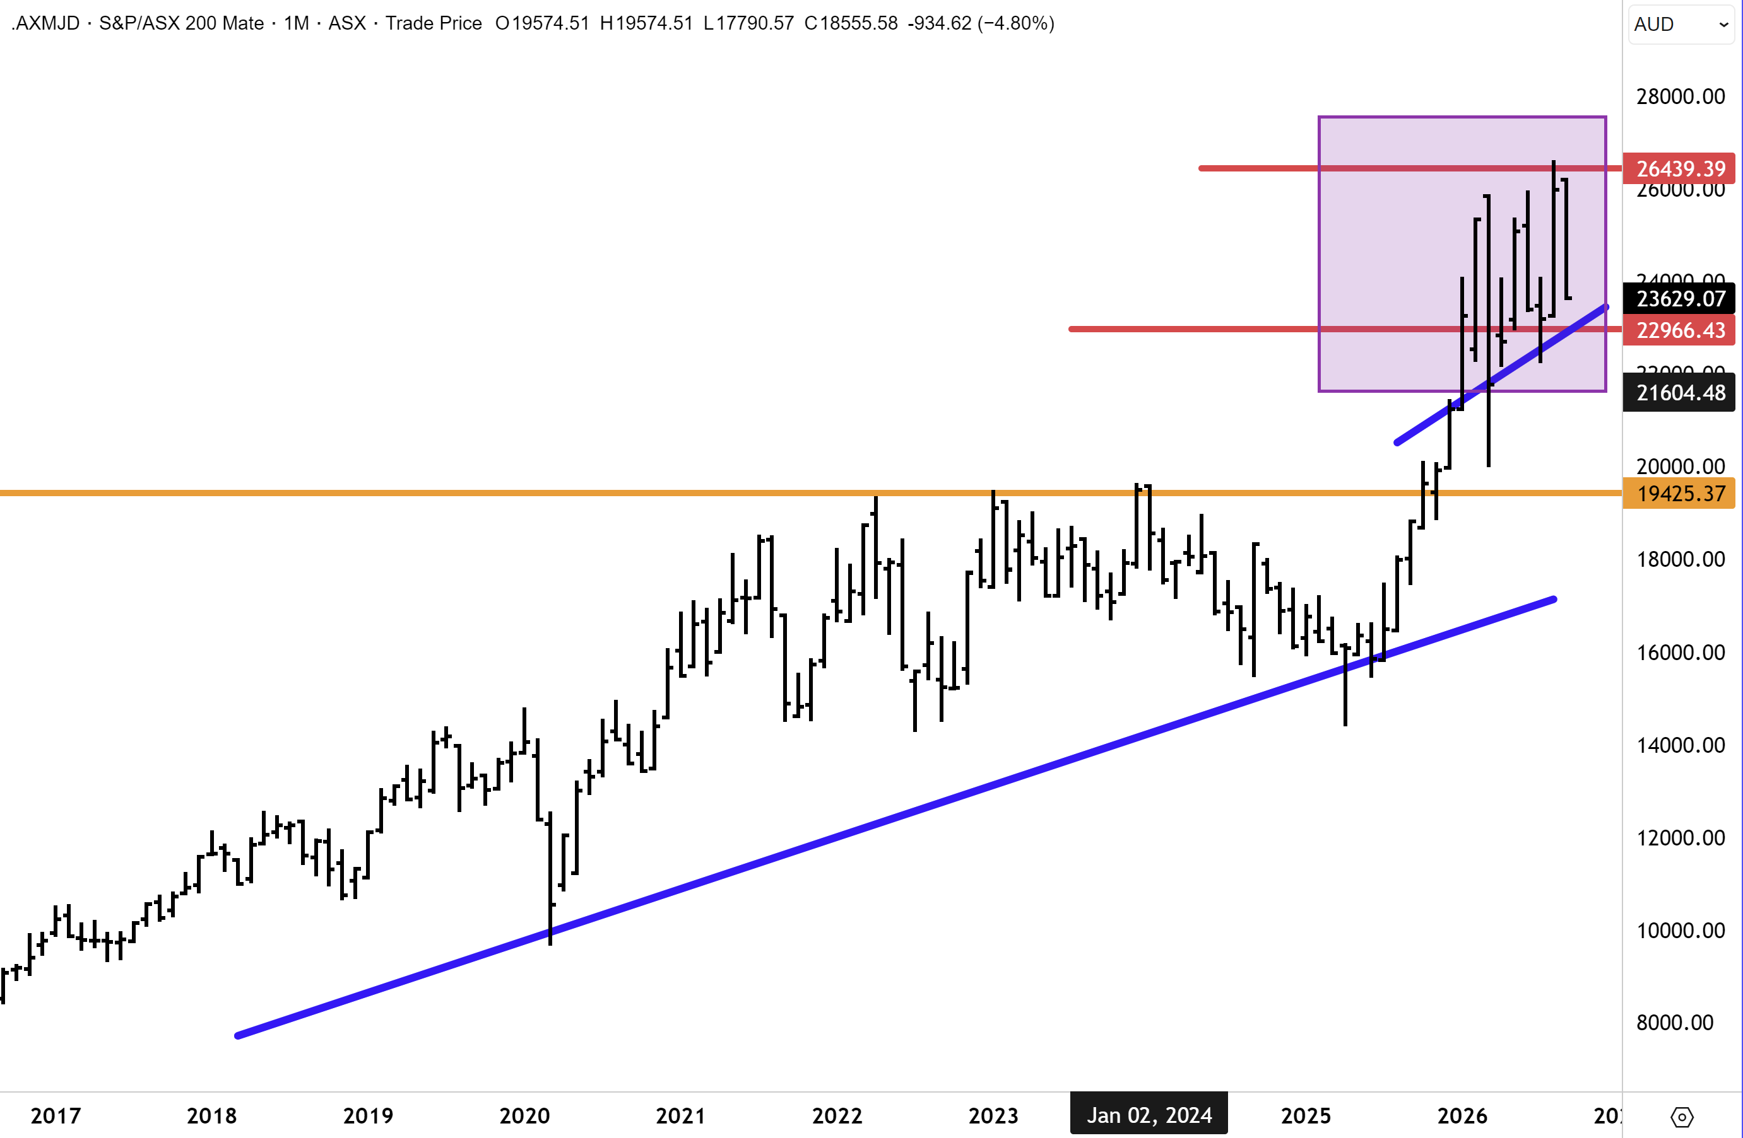
The ASX 200 Materials index has corrected lower from the record highs above 26,000. This is to be expected given the index has risen +40% since last year. Corrections are healthy. The dominating feature on the chart below is the succession of higher reaction lows, and multiple retests of the highs above 26,000. This points to an approaching topside breakout to new record highs – which is consistent with our Commodity Supercycle thesis.

Next week, attention turns to Australian labour force data. The official numbers have been steady while the ground-level picture has not. Small and medium businesses are shedding staff, and two high-profile retailers have failed. A weak print would be the first hard confirmation the labour market is turning, and would shape the Reserve Bank’s October framing more than any inflation number.
Report Spotlight
St Barbara (ASX: SBM) – BUY
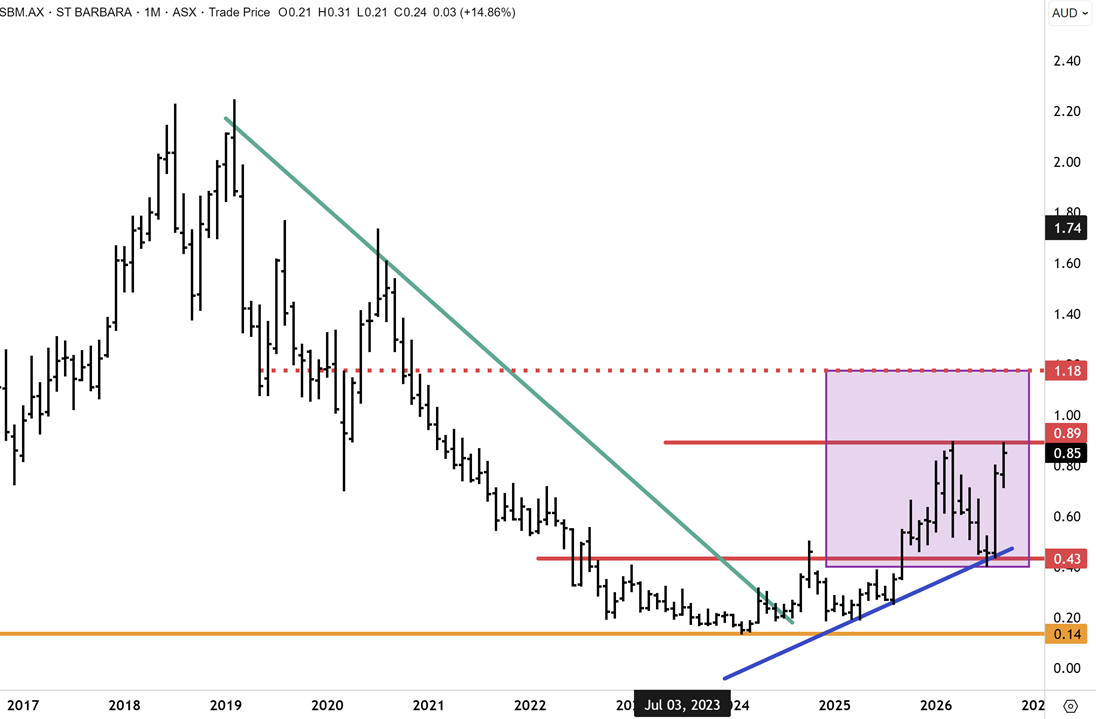
St Barbara has agreed to sell its remaining Simberi interest to Lingbao Gold for A$410 million, plus about A$43 million in construction funding repayments. The deal removes the company’s future Simberi funding obligation but keeps its gold exposure. It retains a 2.75% net smelter return royalty over all Simberi production. Pro-forma cash rises to around A$880 million, leaving St Barbara as a Canada pure play. Cash, listed investments and the royalty now cover most of the company’s market value, so the market is assigning little to Canada. We think that is too low. The expanded 15-Mile resource holds 2.5 million ounces in a tier-one jurisdiction. The next catalysts are the updated 15-Mile study and a possible buyback of up to 100 million shares.
Since our last update (on September 3rd), St Barbara Mines has extended higher to retest this year’s highs at 90c after breaking out of a downtrend descending from the February highs. We continue to believe that an inflection has now been fully confirmed and that St Barbara possesses significant scope for a broader recovery. We also anticipate SBM to sustain upward momentum and continue relative outperformance versus the All Ordinaries Gold Index as the underlying fundamental value is recognised by the market. Our immediate price target at the key overhead resistance level at 90c has now been reached. We anticipate a breakout above this level in the coming months and a retest of the higher resistance cluster between $1.10/$1.20.
Everything in this fatLITE is the surface. The full reports, macro commentary, model portfolio, and buy recommendations are members-only. Try it with our 30-day money-back guarantee.
The full, more detailed versions of all these reports and many others spanning Australasia, Mining and Global Equities are available online for your reading pleasure. Links to the different landing areas for Members are at the bottom of the FatWrap.
Have a great weekend.
Carpe Diem
Angus

