
The Shareholders Strike Back
Telstra (ASX:TLS) shares have staged a decent recovery since hitting multi-year lows midway through 2018. Several factors have combined to spur the recovery, including the reporting of fiscal 2018 numbers with key figures that exceeded muted expectations, the telecommunications titan holding the line on its dividend, some optimism regarding the growth opportunity from 5G and the merger of a couple of key players in the sector. Shareholders have also spoken with the recent voting down of the proposed executive pay package and we hope this will spur management to more urgency on the corporate side.
Besides the factors above, the revision to guidance announced in September was smaller than feared.
The rollout of the NBN is running behind schedule and this will delay some of the payments to Telstra, impacting its outlook for FY19. The company noted though it expects to recoup these payments down the track, so they are delayed rather than lost. Telstra also said it is anticipated these changes will be “financially positive” to Telstra over the course of the full rollout because of the natural hedge.
The delay referred to is now expected to reduce revenue by a modest $300 million in FY19, resulting in a revised guidance range of $26.2 billion to $28.1 billion. The impact on EBITDA excluding restructuring costs is anticipated to be $100 million, giving a company forecast range of $8.7 billion to $9.4 billion. There isn’t expected to be a material impact on free cash flow, forecast at $3.1 billion to $3.6 billion. Telstra (ASX:TLS) shares gained on the news, with the market primed for a worse outcome and sentiment towards the company already at a low ebb.
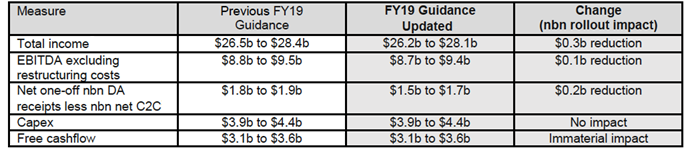
Source: Telstra (ASX:TLS)
Moving on and we expect regulators to let the merger of TPG and Vodafone Hutchison Australia to pass through and believe this will be beneficial for the sector; shifting the focus of competition in the market from price to services. Some respite on the pricing front will be beneficial for all players, boosting margins.
In Telstra’s case, its strong network and brand positions it well to remain the dominant player in key categories.
The fiscal 2018 results showed retail customer service numbers increasing 342,000 to take the total to roughly 17.7 million. The post-paid category put in a strong performance, with post-paid handheld retail customers increasing by 304,000 including 67,000 from Belong. The post-paid handheld churn rate of 10.9% compared well to competitors.
Despite this, post-paid handheld revenue declined 1.4% to $5,374 million though, as ARPU continued to be under pressure, declining 3.4% to $65.41, with this largely attributed to intense competition. The mobile segment EBITDA margin fell 3 percentage points to 40% due to a decline in mobile services revenue and a smaller EBITDA benefit from the Go Mobile Swap relative to FY17. Accordingly, any reduction in pricing pressure would be welcome in this core business for Telstra.
Last week Telstra management got a real wake-up call, when 62% of shareholders voted against the company’s remuneration report. The message was loud and clear, and a fair response from shareholders, unhappy with the performance in recent years and particularly the year leading up to the meeting. It sets the stage for next year, when if more than 25% of shareholders vote against the remuneration report at that AGM, it would constitute a ‘second strike’ and trigger a Board spill. Consequently, directors take first strikes very seriously.
With the “Telstra 2022” ambitious strategic plan already outlined, it will be critical for Telstra’s management to execute efficiently. Management has historically been sluggish in responding to a changing environment and adapting, so we believe this message from shareholders can create some of the necessary urgency.
Telstra (ASX:TLS) has made some progress on the $3 billion earnings ‘hole’ resulting from the NBN rollout, ‘absorbing’ almost half that amount. Still, with conditions remaining challenging, the company has increased its focus on cost-cutting. The telco has accelerated its cost-out programme, with a further $1 billion in savings targeted by FY22, taking the total to $2.5 billion in annual savings. This will see a net reduction in 8,000 employees, impacting about one in four middle-management roles. A flatter corporate structure is envisaged to see an improvement in reducing the time to market for feature and product enhancements. FY19 restructuring costs are pinned at around $600 million.
A wide range of (often confusing) mobile plans will be reduced from around a staggering 1,800 to just 20. The roughly 1,800 plans for consumers and small businesses encompass about 400 currently on offer, while the rest are legacy plans in use, but not sold to new customers.
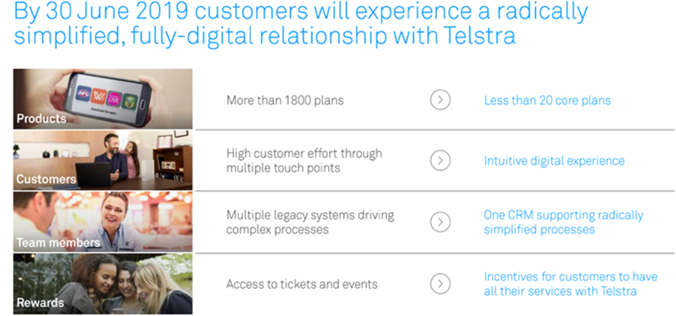
Source: Telstra (ASX:TLS)
Telstra also intends to monetise up to $2 billion from asset sales to strengthen the balance sheet.
To win in the 5G market, Telstra expects to be network ready in the first half of FY19 with full rollout to capital cities, regional centres and other high demand areas by FY20. We believe Telstra is best placed to dominate the 5G market. This is important as we expect 5G to bring with it significant business opportunities, which should combine with a rising population and growing demand for data.
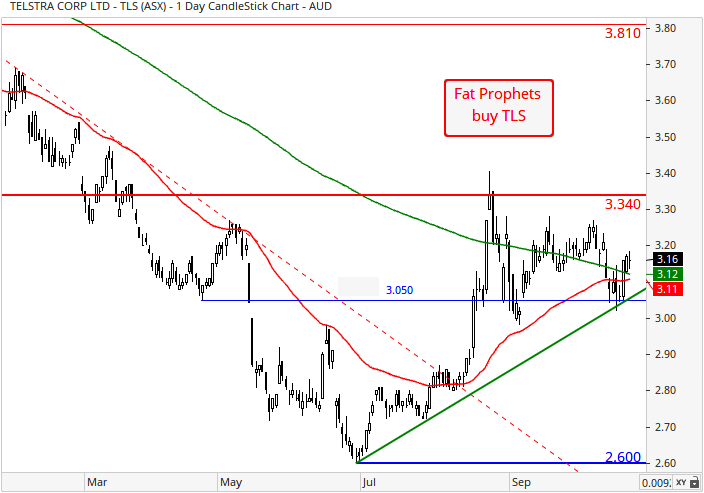
Turning to the charts, and the technical picture has improved significantly in recent months. Prices have moved up from dynamic support sighted at the 50-day moving average (red line) of $3.11. There has been a move above resistance at the April low of $3.05 in addition to a break above this year’s downward sloping trend-line. A move above the 200-day moving average ($3.12) has further strengthened the picture, as would a recapture of resistance at the November 2017 low of $3.34. Next targets are previous resistance levels at $3.81, with a successful challenge here setting the scene for an eventual glide towards the psychological $4.00 level.
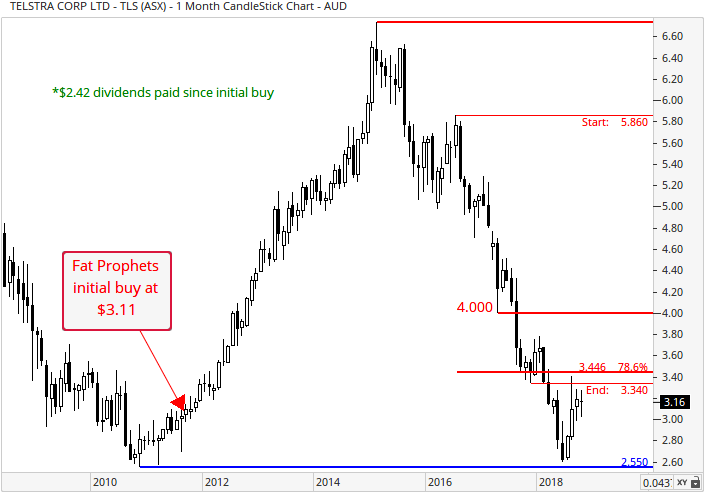
With reference to Telstra’s monthly chart, prior support at the 78.6% Fibonacci retracement of $3.45 is now back in focus. A move back above psychological support at $3 is also encouraging, even if the overall picture from a monthly perspective remains somewhat challenged.
Summary
Telstra (ASX:TLS) shares have staged a decent recovery since hitting multi-year lows midway through 2018. Several factors have combined to spur the recovery, and we believe that given the undemanding valuation of Telstra and still weak sentiment towards the stock, even modest progress will continue to be rewarded with capital appreciation from current levels.
The FY18 results were decent and traction in the mobile area was solid, adding 342,000 retail mobile customers, while the company also added 88,000 retail fixed broadband customers and 135,000 retail bundles. we expect 5G to bring with it significant business opportunities, which should combine with a rising population and growing demand for data.
Telstra (ASX:TLS) shares are trading on approximately 15.6 times forecast June 2020 earnings, with a projected dividend yield of 5.5% that year.
Overall, still weak sentiment towards the stock and modest forecast financial progress, even a meek improvement should be rewarded. With plans in place to reduce the underlying cost base and simplify the business, along with a better technical picture, the prospects for Telstra (ASX:TLS) shares to outperform from current levels appear to be improving.
Accordingly, we are lifting our rating to a buy for Members without exposure and a long-term investment time frame.
Disclosure: Telstra (ASX:TLS) is held in the Australian Share Income and Concentrated Australian Share managed account portfolios.

