
A Package that will withstand the test of Time
Our move to a hold on Amcor (ASX:AMC) from a buy, at the last review in early August would appear to have been the right call. The shares have drifted down over the past month with investors somewhat underwhelmed by the FY18 results and some jitters about the work ahead of the merger with US peer Bemis. The transaction will create the world’s biggest manufacturer of flexible plastic packaging products.
While this deal is not without its risks, we believe it has significant financial and strategic merit and will make the combined entity a very strong player in an industry with attractive characteristics. We covered our viewpoint on the Amcor / Bemis merger in prior coverage (FAT-ASA-885). And while the FY18 numbers were a little softer than expected, management are relatively upbeat that some of the short-term challenges are abating, leading to a return to better prospects going forward.
Amcor CEO Ron Delia stated: “We are encouraged by early indications that the short-term challenges our industry has experienced have started to stabilise as we head into the 2019 financial year. Volumes in the North American beverage segment have modestly improved, earnings headwinds in some regions have started to slow as higher raw material costs are passed through and emerging markets organic growth improved in the second half to 4%.”
Accordingly, we are content to hold Amcor at this juncture.
FY18 Review – Currency in US$ unless noted otherwise
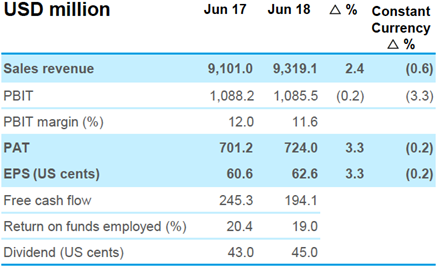
Moving onto the FY18 results and revenue from ordinary activities ticked up 2.4% year-on-year to $9,319.1 million, with this supported by favourable exchange rate movements
as in constant currencies, revenue edged down 0.6%. The increase in reported group revenue was driven by a reported 4.9% increase in sales from its Flexibles segment to $6,535 million, more than offsetting a reported 3.1% decrease in revenue to $2,788 million in the Rigid Plastics segment.
The group profit before interest and tax (PBIT) result of $1,085.5 million declined a marginal 0.2% at actual exchanges rates and represented a 3.3% decline at constant rates. That was slightly below expectations as the PBIT margin slipped 40 basis points from 12.0% in FY17 to 11.6% in FY18. Statutory profit after tax increased 21.3% year-on-year to $724 million, but after tax profit before significant items increased only 3.3%.
The favourable impact on translating non-US dollar earnings into US dollars for reporting purposes was approximately US$24 million. Almost all (US$23m) of that reflected about a 9% depreciation of the average exchange rate of the US dollar against the Euro. The remainder was from a less than 1% depreciation in the weighted average exchange rate for the US dollar against all other currencies. In constant currency terms group profit after tax was a marginal 0.2% lower.
Earnings per share were 62.6 cents, with the same 3.3% increase at actual exchange rates and 0.2% decline at constant rates as group underlying profit after tax.
Source: Amcor (ASX:AMC)
A relative bright spot was that the company lifted its dividend by 2 cents, or 4.7% to 45 cents a share. That was comprised of an interim dividend of 21 cents, up from 19.5 cents a year earlier and a FY18 final dividend of 24.0 cents, up from 23.5 cents a year ago.
Amcor CEO Ron Delia said: “Earnings for the 2018 financial year were in line with the prior period in constant currency terms. The business continued to implement pricing actions to recover higher input costs in the Flexible Packaging segment and to adapt the cost base to reflect lower volumes in some parts of the business. We continued to make good progress against investments in the Alusa and Sonoco acquisitions and the restructuring initiatives in the Flexibles segment. Amcor continued to generate strong margins and cash flow which, along with confidence in the earnings growth capacity of the business, enabled the Board to increase the full year dividend by 5% to 45.0 US cents per share.”
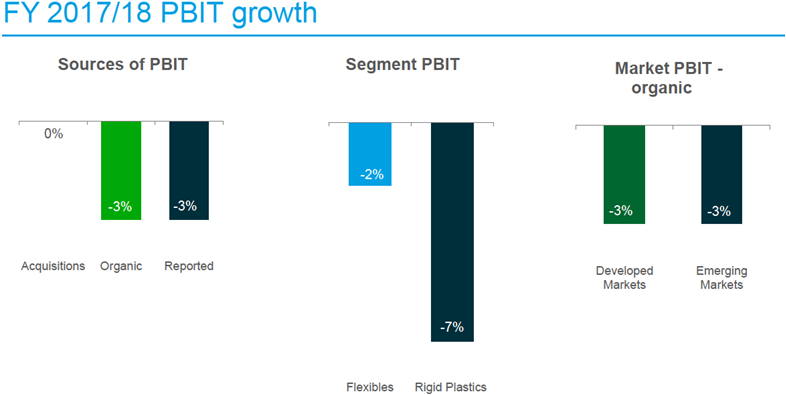
Overall, we viewed the group result as a little soft, dragged down by a slide in PBIT from the Rigid Plastics segment and higher raw material costs capping growth in reported PBIT from the Flexibles segment. Constant currency PBIT declined in both segments and was broad-based across both developed and emerging markets.
Source: Amcor (ASX:AMC)
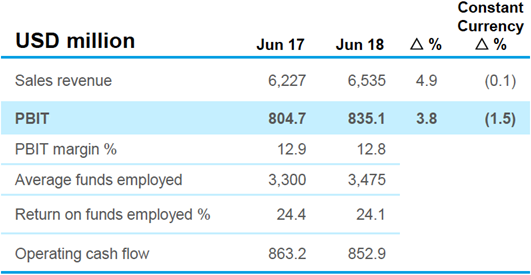
Looking at these in turn and the larger Flexibles segment posted revenue of $6,535 million, up 4.9% at actual exchange rates and a marginal 0.1% decline at constant exchange rates. Segment PBIT increased 3.8% at actual exchange rates to $835.1 million as the PBIT margin declined about 0.1 percentage point to 12.8%. At constant currencies, segment PBIT slipped 1.5%. Return on funds employed fell 0.3 percentage points, but remained solid at 24.1%. Operating cash flow was also robust.
The segment faced headwinds to profit from higher raw materials costs, lower volumes in parts of South America and a soft first half result in parts of the Asia Pacific.
Most of the impact in constant currency terms was offset by organic growth and restructuring initiatives. Amcor is typically able to recoup increases in the cost of raw materials by passing them on to customers, but there is a delay in this recovery. Amcor estimates the adverse impact from the normal time lag in recovering high raw material costs by passing them onto customers hurt segment profit by a substantial $43 million during the fiscal year. Resin, aluminium and liquids all saw notable increases.
Source: Amcor (ASX:AMC)
The Flexibles segment restructuring initiatives have progressed well, with the company reporting that during the June 2018 half year, the business reached full run rate benefits for PBIT of roughly $60 million, at the top end of the previously upgraded range. During the 2017/18 financial year, the incremental benefit from the restructuring initiatives was around $36 million.
In terms of the outlook for the segment and management was more upbeat, assuming no impact from higher raw material costs, net benefits of $10 million from prior period acquisitions and final incremental benefits from restructuring of $10 million. Accordingly, in constant currency terms, Amcor expects “solid PBIT growth in the 2018/19 financial year” for the segment.
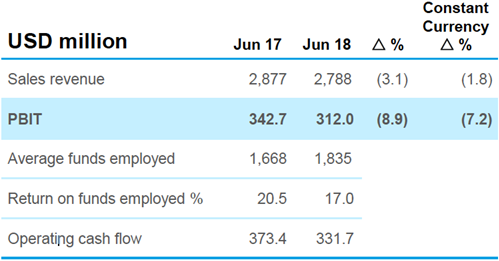
In the Rigid Plastics segment sales declined 3.1% at actual exchange rates to $2,788 million and were down 1.8% in constant currency. Segment PBIT slid 8.9% at actual rates to $312 million as the PBIT margin declined about 0.7 percentage points to 11.2%. At constant currencies, segment PBIT slipped 7.2%. Return on funds employed fell 3.5 percentage points to 17.0%. Segment operating cash flow was down from $373.4 million in FY17 to $331.7 million.
Source: Amcor (ASX:AMC)
The company reported that costs were contained well across the business units in the segment and profits from recently acquired businesses increased. These benefits were however offset by lower volumes in the North America beverage segment and unfavourable product mix. Earnings in the second half were also hurt by lower volumes in the Speciality Containers business.
Looking ahead and modest organic growth, a net benefit of $5 million to $10 million from prior period acquisitions, and an additional $5 million to $10 million in restructuring initiatives, are expected to result in growth in segment profit for the 2018/19 year.
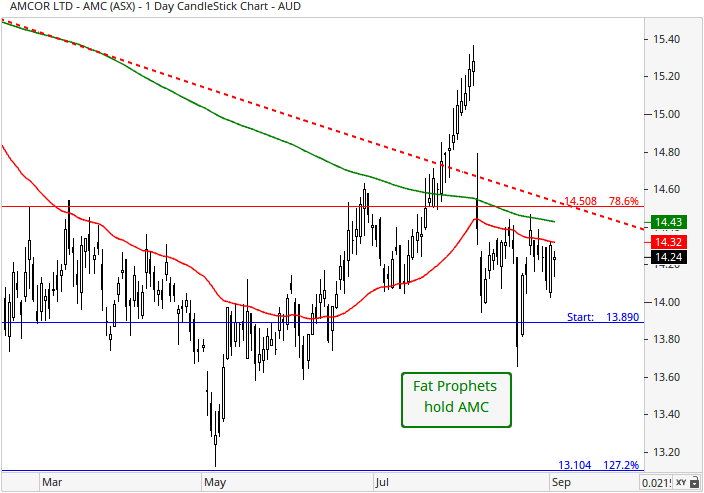
Turning to the technical picture, and the on daily chart, the shares have tracked lower since our last review, and move to a Hold. Support at the 78.6% Fibonacci retracement of $14.51 has given way, although that at $13.89 has been reclaimed. Near term prices may well oscillate around the 78.6% Fibonacci retracement as investors digest the implications of the takeover.
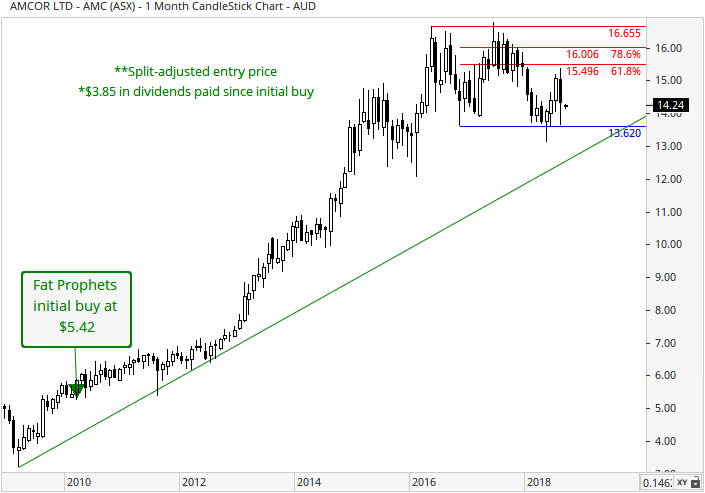
With reference to the monthly chart, support has held at the November 2016 low of $13.62 which is encouraging. A move back above the 61.8% Fibonacci retracement at $15.50 would improve the outlook further and lay the ground for a move back above the medium-term uptrend.
Summary
Our move to a hold on Amcor from a buy, at the last review in early August would appear to have been the right call. The shares have drifted down over the past month with investors somewhat underwhelmed by the FY18 results and some jitters about the work ahead of the merger with US peer Bemis.
Amcor’s FY18 numbers were a little softer than expected, but management are relatively upbeat that some of the short-term challenges are abating, leading to a return to better prospects going forward. Amcor has a strong track record of integrating acquisitions, giving us some comfort that the Bemis integration will be handled capably. Nonetheless, with a deal of this size there is likely to be a few hiccups. Still, given the scale it will give the business in the fragmented industry, we believe the deal is worthwhile.
Amcor (ASX:AMC) shares are currently trading on circa 17.1 times forecast FY19 earnings, falling to 16.1 times the following year. The projected dividend yield over the same time frame is 4.1% expanding to 4.6%.
Amcor (ASX:AMC) will remain held in the Fat Prophets portfolio.

