
RIO

A good second quarter
Rio Tinto has just reported its operational results for the second quarter to 30 June 2018, and despite lingering concerns over excessive supply conditions for many of its commodity offerings, the result was a good one. The company’s key operational segment in iron ore turned in a good result for the quarter, with copper however the standout. The aluminium segment was unfortunately again a laggard in the second quarter, with only bauxite stepping up. Guidance for 2018 remained unchanged, but subject to actual and potential asset sales.The following table is a synopsis, by commodity, of the company’s operational results for June quarter:
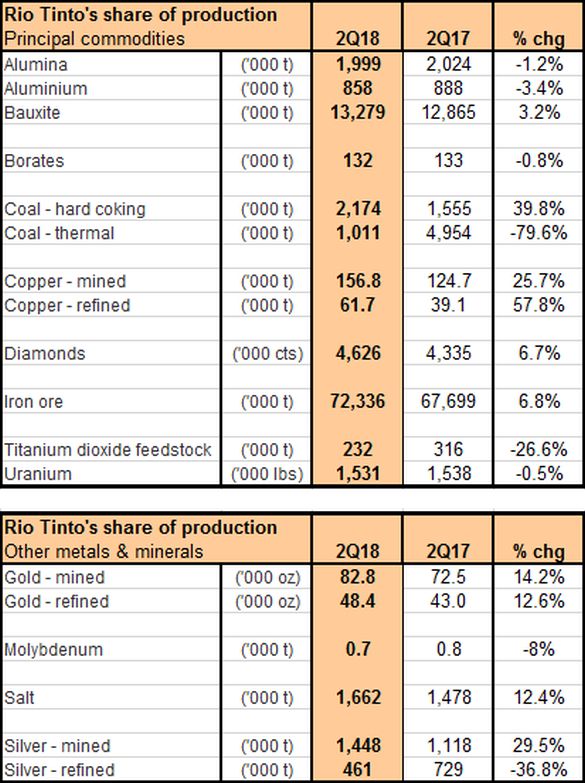
Source: Rio Tinto (ASX:RIO)
The recovery in copper production and the continued performance of the iron ore segment are pleasing in the results. Overall, we are encouraged by the operational result and see nothing from this perspective that may deliver a surprise in the company’s first half numbers for 2018.
Away from the operational result, the company will report its first half financial performance for 2018 on 1 August. We expect the operational performance across the first and second quarters will likely have a positive effect on the company’s first half financial result. Commodity pricing could be a headwind on the result.
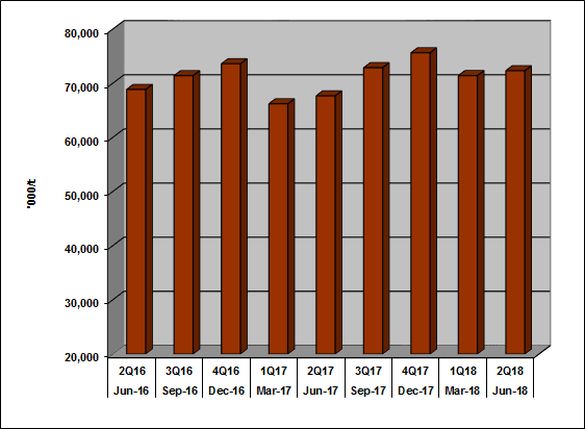
The company’s key commodity in iron ore delivered a good June quarter, following a 6.8% increase in production compared to the year earlier quarter, to 72.3 million tonnes. The following chart shows quarterly iron ore production:
Source: Rio Tinto (ASX:RIO)
The now very familiar driver was the Hamersley six that delivered a record 56.0 million tonnes of iron ore, which represents a rise of 15.1% on the same quarter in 2017. Behind the Hamersley six production result were better weather and productivity gains. Positive production results were also reported by the Robe River twins in West Anglia (Rio’s interest 53%) and Pannawonica (Rio’s interest 53%) mines. The West Anglia mine delivered 4.3 million tonnes of iron ore, to report a 19% increase on the June quarter 2017 on better weather and efficiency gains. The Pannawonica mine delivered 4.0 million tonnes of iron ore, to report a 50% increase on the June quarter 2017 on better weather and productivity improvements.
Iron Ore Company of Canada (Rio Tinto’s interest 58.7%, IOCC) reported a sharp fall in production for the quarter on operational issues. IOCC reported an 81% fall in production on the same quarter in 2017, to 871,000 tonnes of concentrate and pellets. Operations have subsequently returned to normal, post the settlement of staffing issues.
We expect the iron ore operations will have a positive impact on the company’s first half 2018 financial result.
Guidance for 2018 remained unchanged, with iron ore shipped forecast to be in the range of 330 million to 340 million tonnes (100% basis).
Approximately 284 million to 293 million tonnes attributable to the company. IOCC for 2018 is expected to produce iron concentrate and pellets in the range of 9.0 million to 10.0 million tonnes.
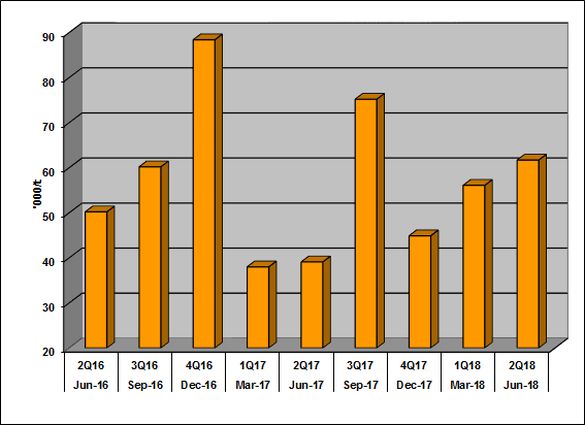
The recent challenges faced by the company’s copper operations may now be behind it, with the segment turning in a resounding performance in the second quarter to confirm an improving trend. The following chart shows quarterly refined copper production:
Source: Rio Tinto (ASX:RIO)
As Members can see from the above chart, the June quarter added to the recent positive trend in production. Refined copper production jumped by 58% compared to the same quarter in 2017, to 61,700 tonnes. Behind the result was the company’s Kennecott operation with the reporting of a 100% jump in production compared to the same quarter in 2017, to 40,700 tonnes of refined copper. The delivery of higher grade ore and productivity improvements helped drive the result. A return to normal plant utilisation in the current quarter compared to the June quarter 2017 which was impacted by maintenance shut-ins was a key factor in the result as well.
The Escondida mine (Rio’s interest 30%), delivered a respectable 11.7% increase in refined copper production compared to the same quarter in 2017, to 21,000 tonnes. A recovery back to normal capacity from staffing issues drove the result.
Mined copper for the quarter came in higher by 26% compared the June quarter 2017, to 156,800 tonnes. The company reported improvements across all its sites for the quarter, with the standout being the Escondida mine. The mine returned to normal capacity following staff issues.
Guidance for refined copper production in 2018 remained unchanged in the range of 225,000 tonnes to 265,000 tonnes. Guidance for mined copper in 2018 also remained unchanged and is forecast to be in the range of 510,000 to 610,000 tonnes.
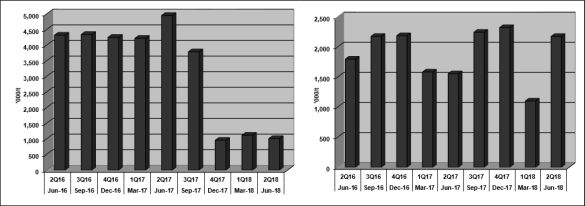
The company’s coal operations delivered divergent production outcomes for the June quarter, with thermal coal reporting a fall and hard coal a rise. The following charts show quarterly production for thermal (left chart) and coking (right chart) coals:
Source: Rio Tinto (ASX:RIO)
Thermal coal reported a fall in production of 80% on the same quarter in 2017, to 1.0 million tonnes. Hard coking coal production however rose by 40% for the same comparative period as thermal coal, to 2.2 million tonnes.
The thermal coal result was driven by assets sales, with the company selling its four Coal and Allied interest during the year. The sites sold added 3.9 million tonnes of thermal coal production to the June 2017 quarter result. Comparing the result on a like-for-like basis, production fell by 1.1%. Hail Creek (Rio’s interest 82%) reported a 5.2% fall compared to the June quarter 2017 and Kestrel (Rio’s interest 80%) a 25% increase, delivering 835,000 tonnes and 176,000 tonnes respectively.
Hard coking coal on the other hand reported a rise in production for the June quarter, with the company’s two producing sites recording higher results. The Hail Creek mine (Rio’s interest 82%) turned in a 38% jump when compared to the corresponding quarter in 2017, to 1.1 million tonnes. A recovery from the prior period weather events drove the result. The Kestrel mine (Rio’s interest 82%) reported a 42% increase in production over the same comparative period as Hail Creek, to 1.0 million tonnes. A recovery from the prior period weather events drove the result.
Thermal coal production guidance for 2018 remained unchanged in the range of 3.8 million to 4.5 million tonnes. Guidance for hard coking coal production was also left unchanged with a forecast in the range of 7.5 million to 8.5 million tonnes.
Both forecasts are subject to possible asset sales.
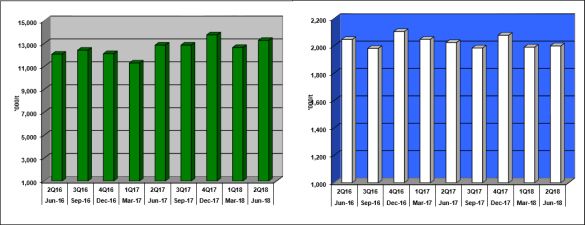
The aluminium segment, except for upstream bauxite turned in a softer performance for the quarter. The following charts show quarterly production for both bauxite (left graph) and alumina (right graph):
Source: Rio Tinto (ASX:RIO)
Bauxite production rose by 3.2% when compared to the same quarter in 2017, to 13.3 million tonnes. The company’s Weipa site, and its biggest bauxite contributor, reported a 1.9% increase in production compared to the June quarter 2017, to 8.0 million tonnes. Driving the result were productivity improvements.
Alumina production for the reported period fell by 1.2% on the corresponding 2017 quarter, to 2.0 million tonnes. The Yarwun refinery drove the lower result, following the reporting of a 1.9% fall on the same quarter in 2017, to 763,000 tonnes. The Yarwun refinery operated as expected during the June quarter.
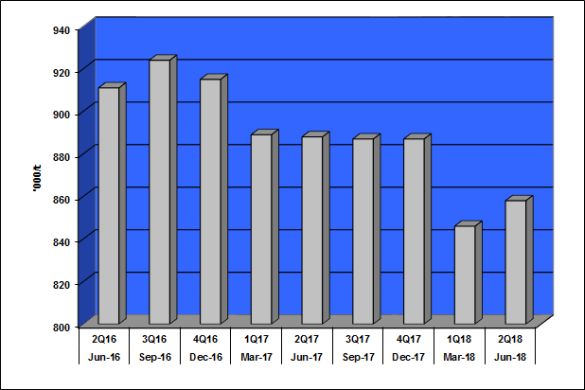
Downstream aluminium also reported a softer result for the June quarter, with the printing of a 3.4% fall in aluminium production when compared to the same quarter in 2017, to 858,000 tonnes. The following chart shows quarterly aluminium production:
Source: Rio Tinto (ASX:RIO)
As Members can see from the above chart, and as we have highlighted on many occasions the aluminium segment has been a thorn. Unfortunately, the segment has underperformed from virtually the time the company acquired Alcan back in 2007 to significantly increase its presence in the sector.
The major contributor to the segment is the six wholly owned smelters in Canada which reported a modest increase in aluminium production for the quarter. The Canadian smelters reported a 1.3% increase in production compared to the June quarter 2017, to 402,000 tonnes of aluminium on better third-party demand.
Two smaller smelters returned lower numbers with the Becancour smelter (Rio’s interest 25.1%) in Canada and the Dunkerque smelter in France the main contributors to the overall fall. Becancour reported a 65% fall in aluminium production compared to the June quarter 2017, to 9,000 tonnes on long-run staffing issues that have now been sorted out. The Dunkerque smelter contributed a 27% fall in aluminium production compared to the June quarter 2017, to 58,000 tonnes. Power shortages impacted on operations over the quarter and may continue to do so going forward.
Production guidance for 2018 remains unchanged in the range of 49 million to 51 million tonnes for bauxite, 8.0 million to 8.2 million tonnes for alumina and 3.5 million to 3.7 million tonnes for aluminium.
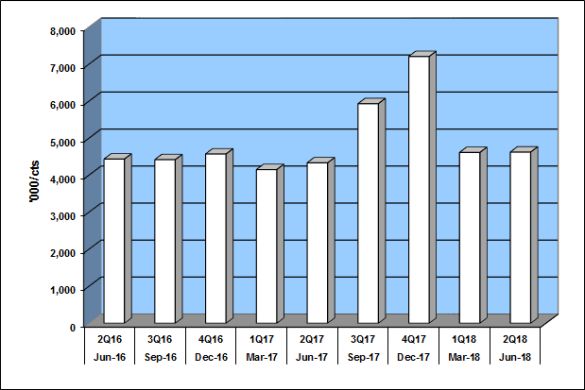
Diamonds turned in a better result for the second quarter of 2018, following the printing of a 6.7% increase on the same quarter in 2017, to 4.6 million carats. The following chart shows quarterly diamond production:
Source: Rio Tinto (ASX:RIO)
The Argyle mine and the largest contributor reported a rise of 8.1% on the same quarter in 2017, to 3.5 million carats, and was the primary driver behind the better diamond result. Plant availability drove the better result.
The Diavik mine (Rio’s interest 60%), reported a modest gain of 2.8% on the June quarter 2017, to 1.1 million carats. Higher mined grades and operating efficiencies drove the result.
Guidance for 2018 diamond production is forecast to be in the range of 17 million to 20 million carats and remained unchanged.
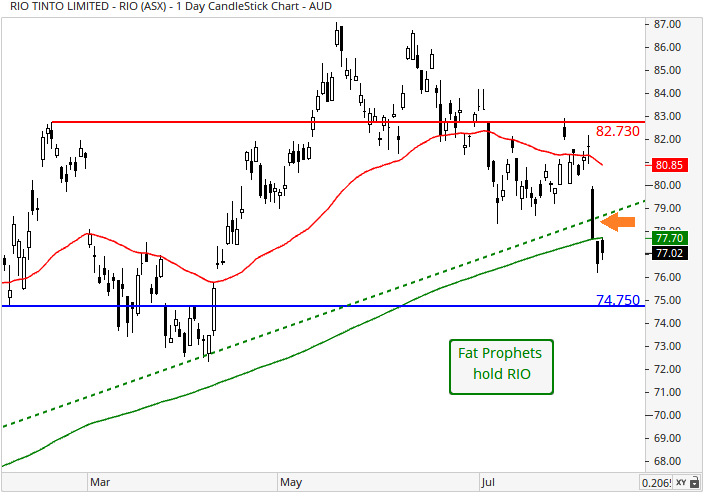
Turning to the daily chart, initial support at the 50-day moving average (red line) of $80.85, followed by structural support around $78.50 (horizontal dashed-blue line) have given way. The share price of Rio Tinto has also dipped below both the 50 (red line) and 200 (green line) day moving averages, which signal’s medium-term momentum has tilted in favour of the bear-camp. A move back above these levels is needed to bolster the near-term outlook.
Overall, the operational numbers for the second quarter of 2018 were, in our opinion, a good outcome.
Two key constituents in iron ore and copper performed well. Good cameos were turned in by a number of the company’s less product offerings to lend support to our view on the overall result.
The fact that Rio maintained 2018 production guidance across all but one of its commodity offerings provides us with a higher comfort level that operations can be expected to have a net positive impact on the company’s 2018 financial year.
The company will report its 2018 first half result on 1 August and its 2018 full year result in February 2019.
Exploration expenditure increased over the reported quarter, following the reporting of a 134% increase (albeit off a small base) compared to the same quarter in 2017 to US$131 million. Across the first half year spending was directed to central exploration 44%, copper and diamonds 34%, energy and minerals 13% and iron ore and aluminium shared 9%. Exploration expenditure for the half year totalled US$232 million.
We are heartened by the first pick-up in exploration expenditure for some time.
We continue to view exploration as the “life blood” of future value. We can however temper that view, in Rio Tinto’s case, as it has significant tier 1 assets to generate future organic growth, without having to spend significant greenfield exploration dollars.
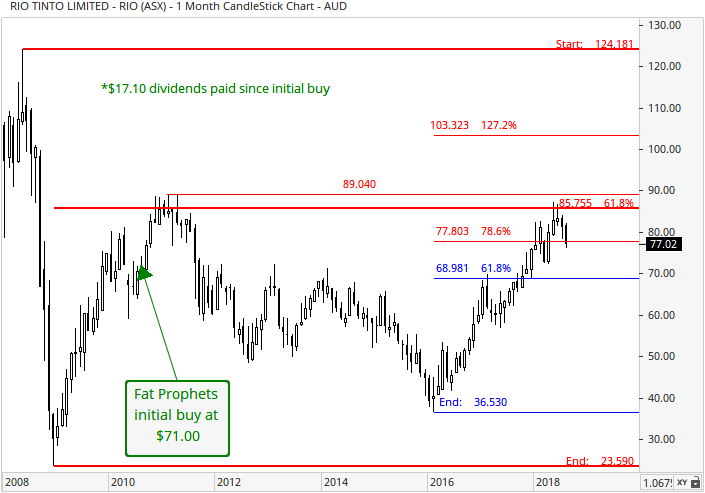
With reference to the monthly chart, resistance was respected at the 61.8% Fibonacci retracement (thin-red set of retracements) of $68.98 in February 2017. This led to a short-term correction to unfold until May 2017, at which point it appeared to have terminated. Near-term a move back above the 78.6% Fibonacci retracement at $77.80 would be positive. Moving forward, we would then expect prices to gravitate towards a band of resistance evident between $85.76 and $89.04. This is made up of the long-term 61.8% Fibonacci retracement (solid-red set of retracements) and the February 2011 resistance level respectively. A definitive clearance of this price range would likely boost upward momentum and result in a gradual ascent towards the next resistance range sighted between $102.65 and $103.32. This consists of the long-term 78.6% Fibonacci retracement (solid-red set of retracements) and the 127.2% Fibonacci extension respectively.
We believe Rio Tinto (ASX:RIO) will maintain, into the future, its robust balance sheet and continue to generate ample cash flow. This financial strength places the company in a position to develop its pipeline of tier 1 assets and with that growth. The goal in developing projects is to advance shareholder value across commodity cycles and overtime.
Better commodity prices over the past 12 months has pushed Rio Tinto’s share price higher over the same time. The March and June quarter operational results will feature prominently on the back of higher commodity prices, and this will be reflected in Rio Tinto’s first half result.
On the back of share price action, we have changed our recommendation for Rio Tinto (ASX:RIO) back to a Hold.
Disclosure: Rio Tinto (ASX:RIO) is held within the Fat Prophets Concentrated Australian Share, Concentrated UK Share and Mining & Resources managed account portfolios.
Fat Prophets has made every effort to ensure the reliability of the views and recommendations expressed in the reports published on its websites. Fat Prophets research is based upon information known to us or which was obtained from sources which we believed to be reliable and accurate at time of publication. However, like the markets, we are not perfect. This report is prepared for general information only, and as such, the specific needs, investment objectives or financial situation of any particular user have not been taken into consideration. Individuals should therefore discuss, with their financial planner or advisor, the merits of each recommendation for their own specific circumstances and realise that not all investments will be appropriate for all subscribers. To the extent permitted by law, Fat Prophets and its employees, agents and authorised representatives exclude all liability for any loss or damage (including indirect, special, or consequential loss or damage) arising from the use of, or reliance on, any information within the report whether or not caused by any negligent act or omission. If the law prohibits the exclusion of such liability, Fat Prophets hereby limits its liability, to the extent permitted by law, to the resupply of the said information or the cost of the said resupply.
Funds Management – In addition to the listed funds FPC, FPP and FATP, Fat Prophets Pty Ltd manages the separately managed accounts, namely Concentrated Australian Shares, Australian Shares Income, Small Midcap, Global Opportunities, Mining & resources, Asian Share, European Share and North American Share. These SMAs are managed under their own mandates by the fund managers, and this is independent to the research reports.
Staff trading – Fat Prophets Pty Ltd, its directors, employees and associates of Fat Prophets may hold interests in many ASX-listed Australian companies which may or may not be mentioned or recommended in the Fat Prophets newsletter. These positions may change at any time, without notice. To manage the conflict between personal dealing and newsletter recommendations the directors, employees, and associates of Fat Prophets Pty Ltd cannot knowingly trade in a stock 48 hours either side of a buy or sell recommendation being made in the Fat Prophets newsletter. Staff trades are pre-approved by an appointed staff trading compliance officer to ensure compliance with the staff trading policy.
For positions that directors and/or associates of the Fat Prophets group of companies currently hold in, please click here.
