
Scoring points
Sentiment towards Elders (ASX:ELD) has been buoyant since our last review, with the shares rallying around 15% over the past six weeks to reach an eight-year high. Investors have been encouraged by a strong half year result, with benefits from management’s Eight Point Plan continuing to flow. Strong wool and sheep prices, a weaker Australian dollar, and the prospect of M&A activity have added to the positive mix.
The shares have clearly performed strongly since our initial and recent buys, however despite the significant re-rating, in our view remain modestly priced at around 17 times earnings. With significant leverage to the increasing demand for meat products as dietary habits globally evolve, and particularly in the Asian region, we retain a buy rating for Members without exposure.
What’s new?
In the month and a half since our last review of the stock, the primary piece of news-flow has pertained to the company’s interim results which were released in mid-May. These were positive on a number of levels.
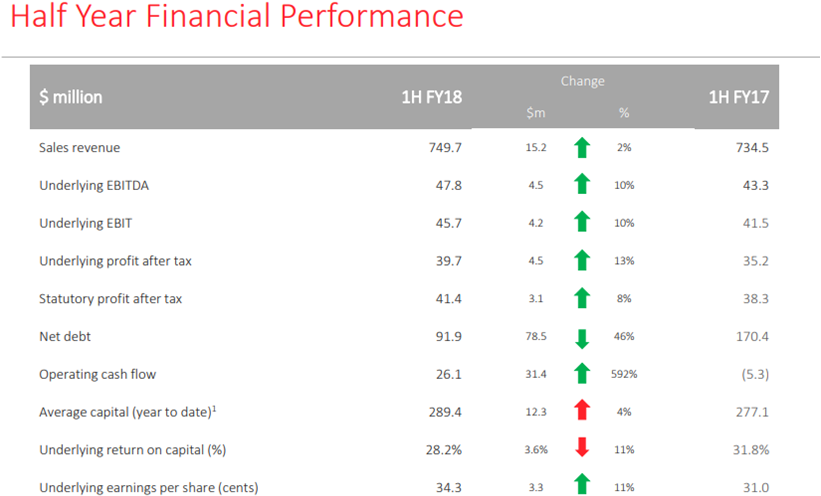
At the bottom line, Elders (ASX:ELD) reported an 8% increase in statutory net profit after tax to $41.4 million for the six months to 31 March. On an underlying basis earning were even more robust, with profit after tax rising 13% to $39.7 million and EBIT (earnings before interest and taxes) ahead by 10% to $45.7 million. The progress is stark from a few years ago when the red ink was flowing.
Source: Investor presentation
Underpinning the performance was organic growth, supplemented by additional earnings through bolt-on acquisitions. Indeed, management makes the point that they have executed in terms of a targeted strategy to deliver 50% of growth through acquisition, and 50% through organic means.
Highlighting how far the company has come under their Eight-Point Plan, management announced a return to dividend payments (the first in nine years) with a fully franked interim dividend of 9 cents per share.
Revenues rose by 2% to $749.7 million. Higher wool prices along with strong fertiliser and crop protection product sales were key features.
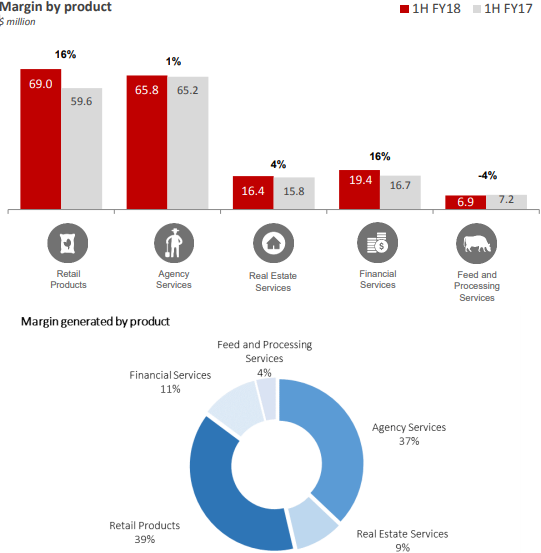
The company’s Agency unit was boosted by higher wool prices, and additional sheep earnings from acquisitions. While cattle prices and volumes were softer, overall margins rose 1%.
Elders’ real estate business saw margins rise 4%. Margins from acquisitions were largely offset by a decline in farm land property earnings. The latter was due to a limited supply of property stock. At the financial services unit margins leapt 16% on productivity improvements, and were also boosted by the acquisitions.
Source: Elders (ASX:ELD) Investor presentation
Not surprisingly for a company that almost went under during the GFC, and with a then heavy debt load (almost $1.4 billion), Elders has been very selective with acquisitions in recent times. Those that have been made have clearly added value. Management reports that the acquisition of Ace Ohisson (a horticulture supplies business in New South Wales) has added a $9.4 million improvement in margin alone.
Elsewhere, the company has completed the acquisition of Kerr & Co Livestock, the largest privately owned independent livestock business in south-west Victoria. Management sees the deal as increasing the company’s agency business in a highly valuable livestock region. Last year Kerr handled about 416,000 sheep and 16,000 cattle. With meat prices on the rise, underpinned by rising demand in Asia, this also looks like a smart move.
Also completed is the acquisition of Titan Ag Pty Limited. The deal extends Elders reach into agricultural chemicals, and looks a reasonable one at 5 times average EBIT (earnings before interest and taxes). Management expect Titan to generate EBIT of $6.5 to $7.5 million in the first year of ownership. Titan’s 163 product registrations are also highly complementary to the existing 23 held by Elders.
More deals could also be on the horizon with reports that Elders is considering a potential move for agricultural supply business PGG Wrightson across the Tasman.
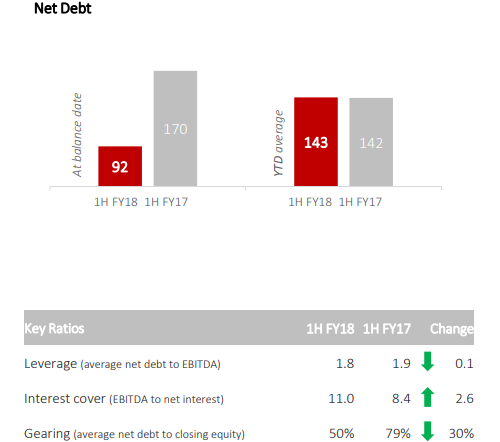
The price tag though could be in the region of $600 million and as Elders CEO Mark Allison noted “We couldn’t fund it ourselves. We would have to go to the market.” Elders’ has certainly risen from the ashes since the financial crisis but in our view will not want to bite off more than it can chew with an overpriced acquisition. In any event at the half year, Elders’ leverage ratio improved, while interest cover increased to a healthy 11 times.
Source: Elders (ASX:ELD) Investor presentation
What is also encouraging about Elders is that management have also consistently sought to optimise the company’s footprint. Case in point is the recent divestment of feedlot and processing assets at its Indonesian subsidiary. High cattle costs and changing governmental policies have affected performance and led management to call time. The exit will allow Elders to direct around $13 million of capital to initiatives which can deliver better required returns.
And on that note, Elders has certainly hit the mark, with returns to capital of around 28.2% at the interim stage. This compares favourably to management’s 20% target.
Looking ahead, a decline in cattle pricing is potentially one headwind for Elders, however on the other side sheep and wool prices look set to remain firm. The weather is always a risk factor, and limited rainfall in Australia in recent months will make for average winter cropping conditions (and subdued cattle/farmland prices). A growing footprint and astute acquisitions will likely prove value drivers in our view.
Share price tension should also be provided by the presence of the Hong Kong and Sichuan Province-based Chinese conglomerate Sichuan Hebang Biotechnology Corporation (SHBC) on the register – now one of the top five shareholders. The stake is likely a strategic one with SHBC having some first-hand knowledge of the strong outlook for the Australian farming sector. A full tilt for Elders wouldn’t be possible however given the Australian company’s strategic and geographical importance.
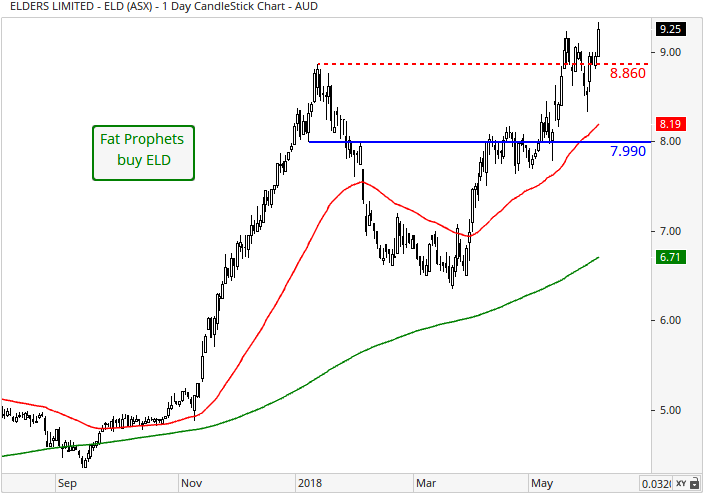
Turning to the technical picture and looking at the daily chart, previous overhead resistance at the January intra-month high of $8.86 as shown by the dotted red line has given way. We would be looking for this level to form a new layer of support. Momentum remains in favour of the bulls, as the share price has comfortably cleared both the 50 (red line) and 200 (green line) day moving averages.
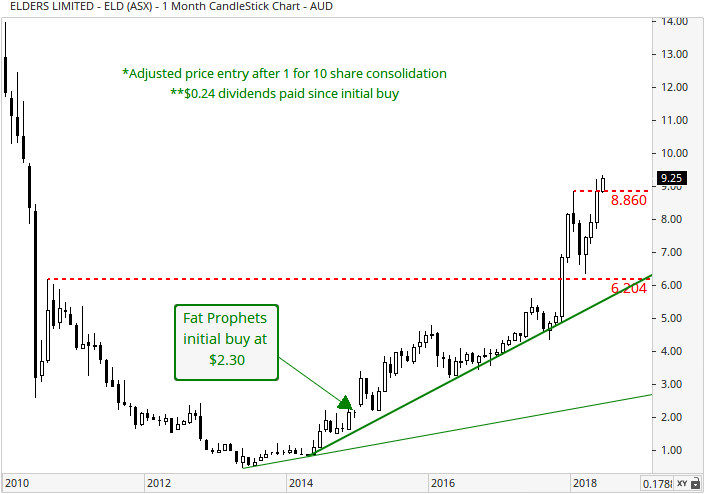
On the monthly chart, Elders has traded consistently higher since 2013, underpinned by a rising trend line (upward sloping solid-green line). Previous overhead resistance has been breached at the January intra-month high of $8.86 as marked by the dotted red line. We now expect further gains to evolve over the broader horizon. Adding to the bull case is the strength of the underlying long-term uptrend, which has been in place since mid-2014.
Summary
Sentiment towards Elders has been buoyant since our last review, with the shares rallying around 15% over the past six weeks to reach an eight-year high. Investors have been encouraged by a strong half year result, with benefits from management’s Eight Point Plan continuing to flow. Strong wool and sheep prices, a weaker Australian dollar, and the prospect of M&A activity have added to the positive mix.
The shares have clearly performed strongly since our initial and recent buys, however despite the significant re-rating, in our view remain modestly priced at around 17 times earnings. With significant leverage to the increasing demand for meat products as dietary habits globally evolve, and particularly in the Asian region, we retain a buy rating for Members without exposure.
We recommend Elders (ASX:ELD) as a high risk buy to Members without exposure and with a medium to long-term investment horizon.
Disclosure: Elders (ASX:ELD) is held in the Concentrated Australian Share and Small/Mid-Cap Models.

