
Sunny in Queensland
Suncorp Group (ASX:SUN) saw a decline in interim profits due to higher natural hazard costs and investment in programs expected to have cost benefits down the track. We continue to be positive on the name due to our expectation of an improving premium and investment income environment. The company also has a banking angle and strong positioning in the Queensland market, one which we view favourably.
1H18 Headline Numbers
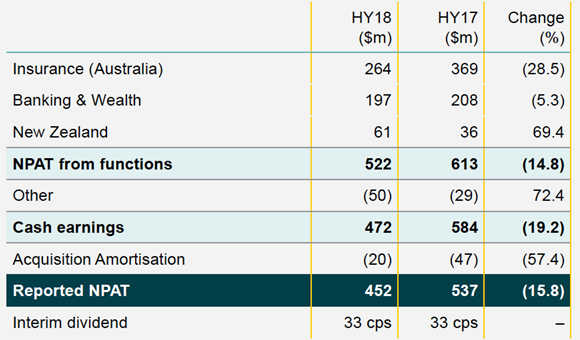
Suncorp Group’s net profit after tax (NPAT) fell 15.8% year-on-year to $452 million in the six months ended 31 December 2017, even as the company posted top line growth of 2.5%, driven by decent momentum in Consumer General Insurance and Banking. The $452 million in profit fell short of the consensus estimate of $486 million according to Thomson Reuters.
Source: Suncorp (ASX:SUN)
Cash earnings of $472 million slumped 19.2% from a year earlier. The combined Australia and New Zealand General Insurance underlying trading insurance trading ratio came in at 10.2%, adjusted for Business Improvement Program (BIP) costs.
A hit from the hailstorm in Melbourne (estimated at $167 million at the time of the results) and a rise in costs crimped profit, but management remained upbeat on the prospects of delivering on cost benefits from investment next year. Natural hazard costs of $395 million were $65 million above allowance.
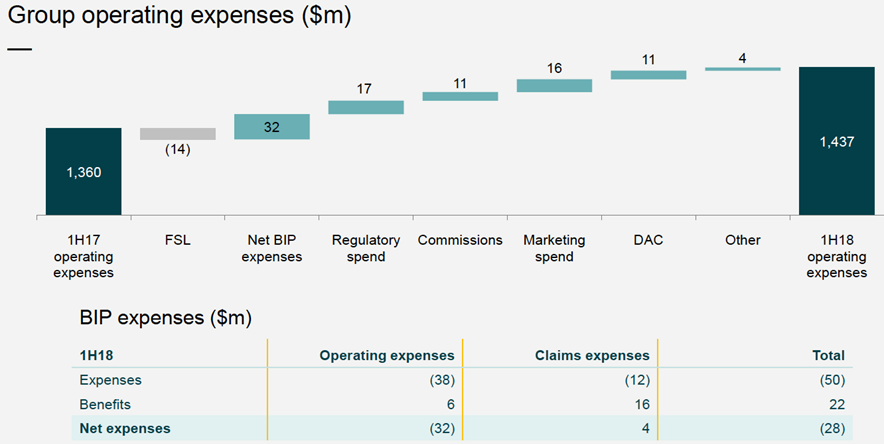
A material increase in group operating expenses dragged on profit:
Source: Suncorp (ASX:SUN)
Total operating expenses increased by a more modest 3.3% adjusted for the BIP. Suncorp is forecasting the BIP to deliver net benefits of $10 million, $195 million and $329 million in FY18, FY19 and FY20 respectively. Suncorp CEO Michael Cameron stated, “With a gross benefit run rate of $124 million already locked in, we are well positioned to achieve our net targets.”
Suncorp (ASX:SUN) maintained its dividend at 33 cents per share, which equated to a 90.1% pay-out ratio. That was well above the historical range and the top end of the 60% to 80% targeted pay-out range.

Source: Suncorp (ASX:SUN)
After accounting for the dividend, Suncorp said the excess capital position was $381 million. The Bank’s Common Equity Tier 1 (CET1) ratio of 9.01% was at the top end of the target operating range of 8.5% to 9.0% and the General Insurance CET1 position of 1.22 times the PCA (Prescribed Capital Amount) was also at the top end of its target range (1.0 – 1.2 times).
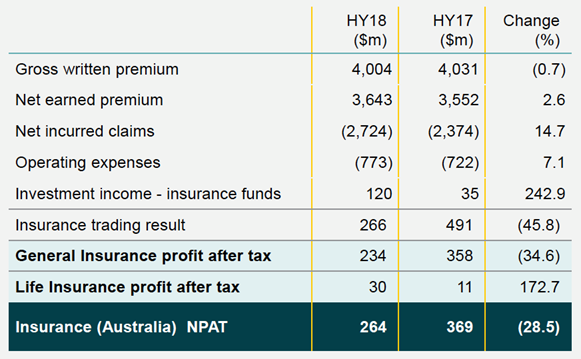
Looking at each key business, Insurance (Australia) was the main drag on group profit, with NPAT falling 28.5% from last year to $264 million, which included $30 million in Life Insurance profit, up from $11 the prior year.
The General Insurance business chipped in profit of $234 million, down 29.3% from 1H17. The insurance trading result was $266 million, representing an ITR (insurance trading ratio) of 7.3% compared to $421 million and 12.0% respectively for 1H17. The result was impacted by higher natural hazard costs and investment in the BIP, which is slated to deliver future benefits. Those were partially offset by price increases across the portfolio and an improvement in working claims.
Insurance (Australia) results:
Source: Suncorp (ASX:SUN)
Gross written premiums (GWP) edged up 0.7% year-on-year to $4,004 million, with rate increases in Consumer and Commercial offset by reduced CTP (compulsory third party) premiums. Net earned premiums increased 2.6% to $3,643 million.
Net incurred claims of $2,274 million marked a 14.7% increase, impacted by natural hazard events, discount rate movements and a shift in the mix of premiums towards long-tail types.

Source: Suncorp (ASX:SUN)
Natural hazard expense of $395 million was up from $319 million in the corresponding period of fiscal 2017. Reserve releases of $129 million were well above long-term expectations primarily due to a continued focus on long-tail claims management and a benign environment for wage and super-imposed inflation.
Total operating expenses of $773 million increased 7.1% year-on-year and the operating expense ratio ticked up 90 basis points to 21.2%. Some $23 million was invested in BIP which is designed to lead to cost benefits in future periods.
Investment income on insurance funds came in at $120 million, marking a large improvement from $35 million a year earlier due to outperformance on inflation-linked bonds and gains from narrowing credit spreads, partially offset by an increase in risk-free rates. After adjusting for market valuation impacts the underlying yield income was $106 million, or 2.3% annualised. As the yield curve rises investment income will benefit.
The Life Insurance business underlying profit $39 million was up 56%, reflecting higher planned profit margins due to favourable claims experience at the end of last financial year as well as reduced expenses and repricing benefits. In-force premium grew 0.9% from growth in retail and direct due to stepped age an CPI increases. Reported Life Insurance profit after tax was up 173% year-on-year.
Banking and Wealth
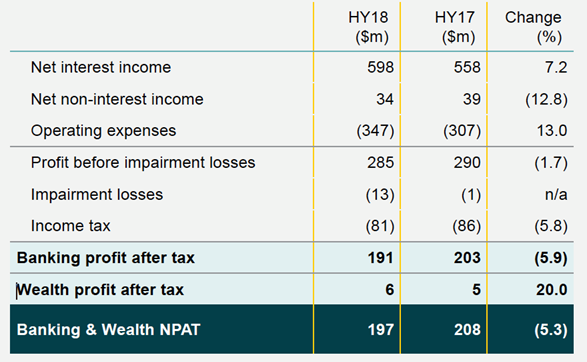
NPAT of $197 million marked a 5.3% decrease from $208 million in 1H17. The decline was due to a weaker result from Banking, which saw profits slip 5.9% to $191 million. The top line performance was solid, but an increase in costs associated with BIP activities, regulatory expenses and a small increase in impairment losses weighed on profit. Banking annualised lending growth of 8.7% was well above system pace, while the net interest margin increased 8 basis points from a year earlier to 1.86% and was stable with six months earlier.
Source: Suncorp (ASX:SUN)
Net interest income of $598 million was up 7.2% year-on-year. The cost to income ratio worsened materially, moving from 51.4% in 1H17 to 54.9% in 1H18. The Bank has some work to do to get the cost-to-income ratio below the targeted 50% level. We do believe Suncorp’s banking division is well placed to do well going forward due to the regulatory and other pressures on the major banks. While costs associated with BIP activities and digital capabilities created a drag on profits in the interim period, the returns are expected to be reflected from FY19 onwards.
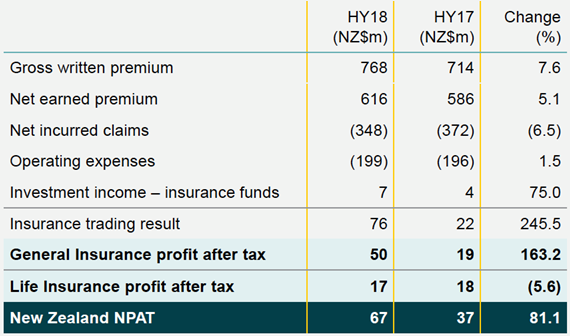
Finally, the New Zealand Insurance segment delivered a strong improvement in profit, with NPAT jumping 81% to NZ$67 million (A$61m). The New Zealand ITR improved from 3.8% in 1H17 to 12.3% in 1H18. GWP grew 7.6%, with growth across all channels. On a like-for-like basis, excluding the impact of Autosure in FY17, GWP increased 10.4%. In-force premium growth increased 5% due to new business and strong retention rates. The New Zealand Life Insurance businesses reported profit was $17 million, down about $1 million from a year earlier as prior year favourable experience was not repeated.
Source: Suncorp (ASX:SUN)
Regarding the outlook and Suncorp is forecasting “higher” second half profits. Looking out to FY19 and management expects 3% to 5% top line growth, an underlying ITR of at least 12%, a banking cost-to-income ratio of around 50% and an expense base of $2.7 billion.

Summary
Looking ahead, we remain constructive on Suncorp’s medium to longer-term growth prospects, especially on the back of medium-to-long term rising yields (in Australia as well as globally) and management’s efforts to keep costs contained. The new customer-focussed model from the diversified financial services player should deliver benefits to shareholders from cross-selling and increased “wallet share.”
On the valuation front Suncorp looks reasonable, trading on approximately 14.2 times FY18 earnings with a dividend yield of 5.6%.
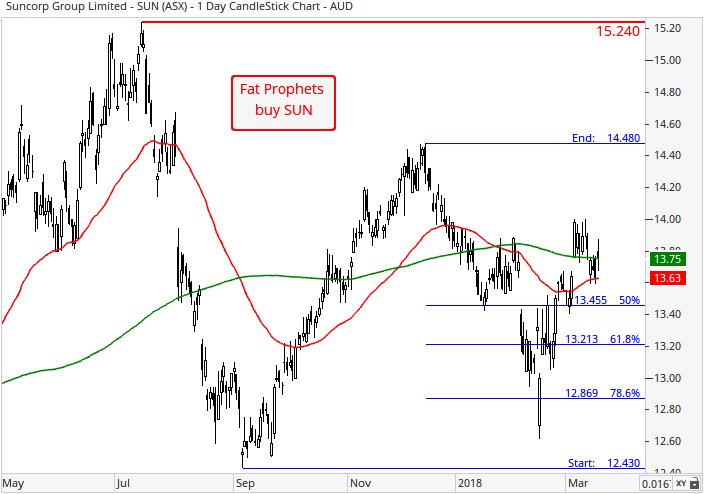
Accordingly, Suncorp Group (ASX:SUN) will remain held in the Fat Prophets Portfolio. We recommend the shares as a buy for Members without exposure, and who are also prepared to take a medium to longer term view.
Disclosure: Suncorp (ASX:SUN) is held in the Fat Prophets Income Model.

