
Bottle the first half
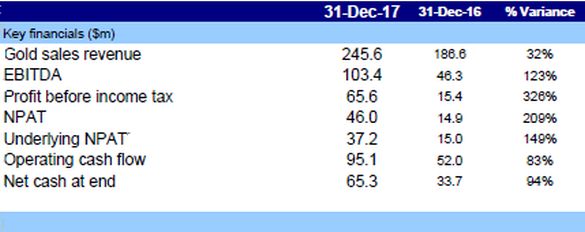
Saracen Minerals (ASX:SAR) recently released production results to 31 December 2017 pointed to what was likely to be a very good first half financial result for the company, and it delivered in spades. The company reported a strong surge in profit for the first half and with that a super quality balance sheet. With the company rolling out an intensive growth programme, a dividend remained elusive but is not a concern. The following table shows a summary of the company’s first half result 2018 (EBITDA – earnings before interest taxation depreciation amortisation, NPAT – net profit after taxation, Australian Dollars):
Source: Saracen Minerals (ASX:SAR)
As Members can see from the above table, the company’s operational result, which we covered off in FAT-AUS-857, has flowed through to the financials, as the realised gold price did not get the right memo and came in softer over the half.
NPAT for the first half 2018 surged by 209% compared to the first half 2017, to A$46.0 million. On an underlying basis the surge was only 149% compared to the same half 2017, to A$37.2 million. Underlying reflects the ongoing operations as it removes one-offs and impairments. The following chart shows first half NPAT:
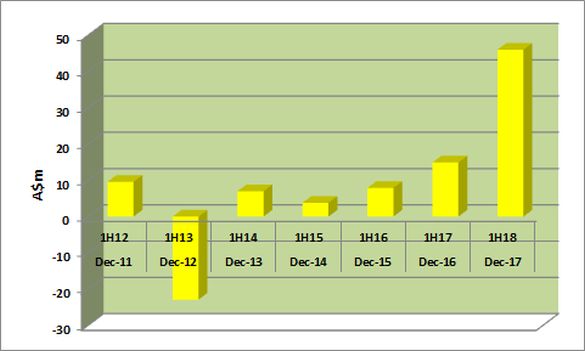
Source: Saracen Minerals (ASX:SAR)
On a revenue increase of only 32% compared to the same half in 2017, to A$245.6 million, the company’s NPAT surged. Driving the NPAT result was the delivery of record gold production of 157,796 ounces compared to 127,692 ounces for the year earlier first half. Gold production printed a 24% increase from a year earlier.
Production guidance for 2018 remained unchanged at 300,000 ounces of gold.
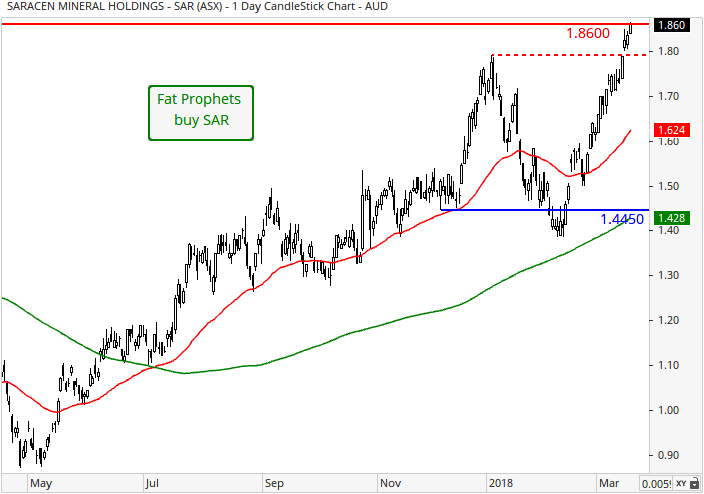
Costs played a major role as well, with Saracen (ASX:SAR) reporting a 23% improvement in its all-in sustaining cost (AISC) compared to the first half 2017, to A$1,091 an ounce. Higher gold production helped deliver the improvement together with the company’s cost saving initiatives.
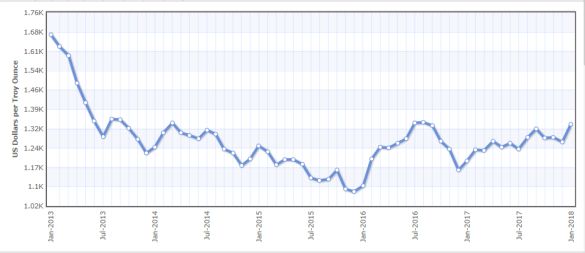
The fly in the ointment was the realised gold price, with the company reporting a 5.0% decline compared to the first half 2017, to A$1,591 an ounce. On the gold price front, we have a positive view on the gold price in 2018, as we expect the United States (US) Federal Reserve will continue to take a gradual approach to lifting the US cash rate and therefore keep the US Dollar on the back foot. The following chart shows the US Dollar price for gold:
Source: index mundie
A decline in US Federal tax revenue due to the recently passed tax cuts and a proposed increase in US Federal spending on infrastructure renewal should also keep the US Dollar on the back foot. US debt fears could keep the US Dollar under pressure.
The physical gold market has taken time to adjust, with production still robust and demand that has remained somewhat subdued, and we consider the physical market is likely to be a headwind for the gold price over 2018. However, the spectre of higher inflation remains, which we believe should be a major driver of a firmer gold price in 2018. Synchronised global growth in 2018 and a higher inflation base at the end of 2017 will drive 2018 inflation rates higher.
Furthermore, the safe haven characteristic of gold will wax and wane on geopolitical events million over the course of 2018. Our expectation is for the gold price to close out 2018 in the range of US$1,550 to US$1,600 an ounce.
Operating cash flow and the balance sheet were the real beneficiaries from the better first half performance. Net operating cash flow from operations jumped by 83% on the first half result 2017, to A$95.1 million. The balance sheet which carries no debt at 31 December 2017 received cash boost. Cash and cash equivalents jumped by 94% compared to the same half 2017, to A$65.3 million. An already pristine balance sheet now shows more cash and leaves us with no doubt around the capacity of the company to deliver growth.
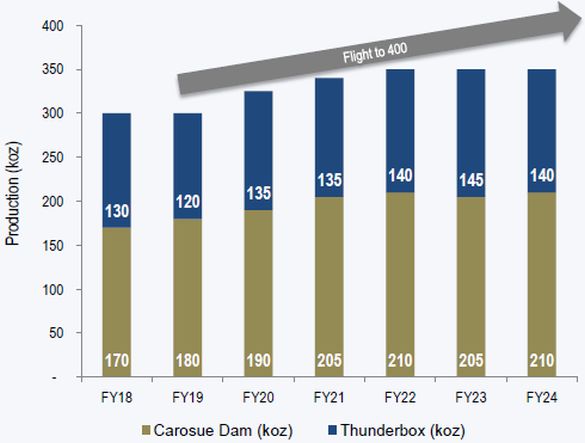
No interim dividend was declared for the first half to 2018, which was unchanged from the first half 2017. We are not concerned with the company not paying a dividend as its focus is on growth. The following chart shows the company’s aspirations on the growth front:
Source: Saracen Minerals (ASX:SAR)
Based on a mill with the capacity to process circa 4.9 million tonnes of ore per annum, the company is forging ahead to hit production of 350,000 ounces of gold per annum. It is this growth in the company’s production profile that adds further blue sky potential to the value equation.
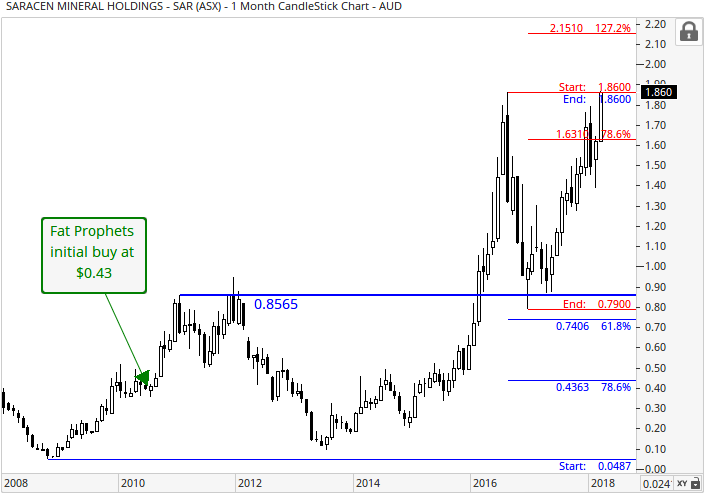
We believe it is the company’s financial strength that warrants its ongoing support.
Include the company’s future growth potential that we see in both the Carosue Dam and Thunderbox sites; that is now being revealed, adds further weight to the value equation. An aggressive exploration campaign will we believe only add to the positive news to date. Saracen has a clean balance sheet and with its robust free cash flow is well positioned to fund such a campaign.
The sum of the actions by Saracen Minerals (ASX:SAR) does, in our view, position the company to leverage into our positive outlook on gold. Consequently, we continue to recommend Saracen Mineral Holdings as a high conviction buy for Members with no exposure to the stock.
Disclosure: Saracen Mineral Holdings (ASX:SAR) is held within the Fat Prophets Concentrated Australian Shares managed account portfolio.

