
RIO

2017; bumper result
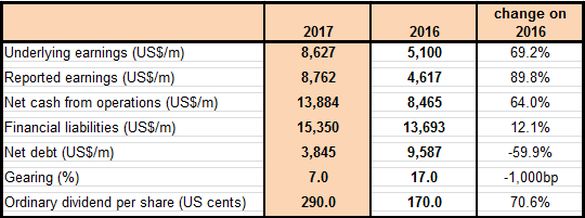
Rio Tinto (ASX:RIO) has released its full year result, and in doing so has reported a surge in underlying earnings for 2017 that was in line with market expectations. Management action continued to deliver key cost improvements, but it was the realised commodity prices that turned on the show. Net cash flow from operations enjoyed the ride, while the balance sheet goes from strength to strength. Shareholders were not left out with the dividend receiving a handy record boost while the share buyback got a top up. The following table shows a summary of the company’s 2017 result:
Source: Rio Tinto (ASX:RIO)
The overall result was a very good one and reflects the improvement in trading conditions across the year and broadly across the commodity spectrum from a pricing perspective.
Analyst expectations were for underlying earnings of US$8.5 billion, and as Members can see from the above table, the company coming in ahead of consensus with the reporting of underlying earnings of US$8.7 billion. Market forecasts were for a 2017 dividend of US$2.75 per share and again Rio carried the day by declaring a dividend of US$2.90 per share.
Despite the company’s fairly ordinary operational result for 2017, the financial result for the year was certainly a very good outcome.
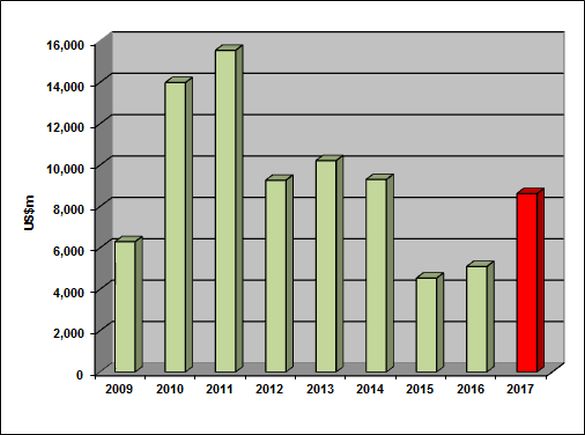
Underlying earnings surged to US$8.7 billion for 2017, representing a rise of 70% on the 2016 result. The following chart shows annual underlying earnings:
Source: Rio Tinto (ASX:RIO)
Rio’s mantra has been to conserve value over what has been an extended and tough trading environment, as Members can see from the results shown in the above chart. The company was well positioned to leverage off any improvement in the prices for its product offerings. The optimisation of the company’s cost structures has also played a vital role and did so in the current result. Higher realised commodity prices did all the heavy lifting in 2017, while the company’s operations delivered a cameo.
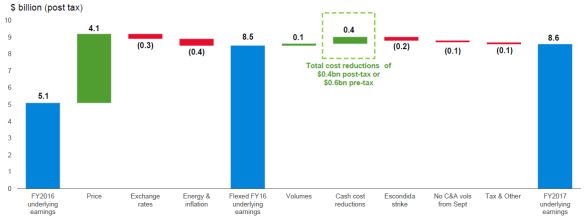
Controllable facets of the business such as management initiatives in cost reduction and operations, for once only added to the pricing surge. The following chart shows the major factors that impacted on the company’s underlying earnings for 2017 (in US Dollars):
Source: Rio Tinto (ASX:RIO)
The controllable factors that impacted on the company’s operations in volumes and cost reductions are shown to the right of the ‘Flexed FY16 underlying earnings’ of US$8.5 billion shown in the above chart, as are all the other controllable metrics. In total the company improved its financial position in 2017 by a modest US$100 million.
The company’s operations contributed US$100 million to the 2017 result, which was marginally lower than the US$190 million delivered in 2016. We covered off on the company’s operational results in FAT-AUS-487. We considered, at the time, that the operational result was quite ordinary, but pleasingly the final outcome was not a negative one. We expect on the operational guidance provided for 2018 that the impact from volumes will again be positive on the company’s financial position.
Cash costs are another metric controlled by the company, with 2017 extending the positive trend established by it in recent years. Cost saving initiatives delivered a positive variance of US$400 million (post taxation) compared to the savings of US$1.2 billion delivered in 2016. Over the course of the past five years the company has generated an accumulated reduction in cash costs of some US$8.3 billion.
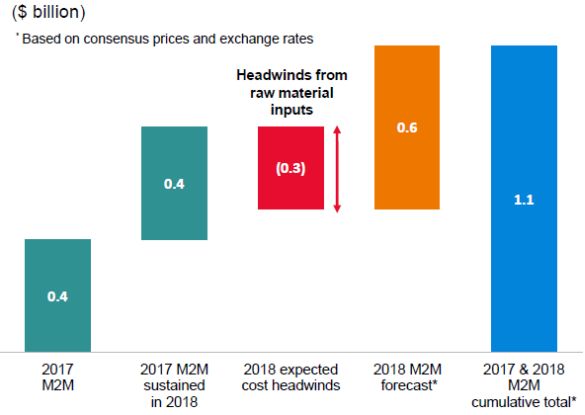
The company is targeting cost savings of US$5 billion out to 2021, with US$1.1 billion to be delivered in its mine to market (M2M) productivity programme in 2018.
The following chart the M2M the factors expected to contribute to the 2018 M2M forecasts (in US Dollars):
Source: Rio Tinto (ASX:RIO)
These savings are expected to fall directly into the company cash flows in 2018, and beyond out to 2020. The programme should generate circa US$1.5 billion in free cash flow each year.
The story of 2017 was commodity prices with the delivery of a real kick in 2017 compared to 2016.
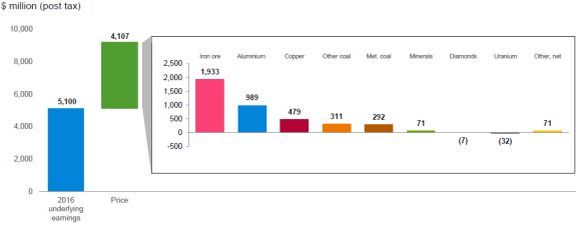
Unfortunately, commodity prices are not controllable by the company. The following chart shows the composition of the pricing variance by commodity offering (in US Dollars):
Source: Rio Tinto (ASX:RIO)
As Members can see from the above chart, the pricing effect for 2017 came in at a positive US$4.1 billion, with the company’s key iron offering playing a major role. The 2017 result compares very favourably to the negative US$460 million reported for 2016. The last time the company reported a positive price impact on its financial result was 2011, when the company reported a positive US$6.7 billion.
On pricing and specifically the iron ore price, the company received an average realised price of US$59.60 per wet metric tonne (wmt) compared to US$49.30 per wmt in 2016; the price uplift represents a 21% surge in the realised price. As a result, the iron ore operations delivered a positive US$1.9 billion to the 2017 result compared to only US$148 million in 2016. Members can see from the above chart the contributions made by all the company’s product offerings.
We remain positive on the iron ore price in 2018 and have a calendar year-end close in the range of US$80 to US$85 per tonne. At the time of writing the iron ore price was trading around US$77 per tonne. We also hold a positive view on the broader base metals prices for 2018, but have a lesser view for non-liquid energy commodities.
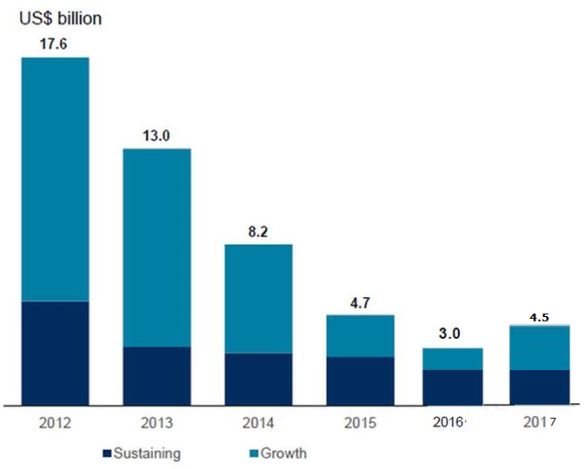
For the first time in some years the company reported a lift in capital expenditure for 2017, although it does remain modest. Capital expenditure came in at US$4.5 billion compared to US$3.0 billion in 2016, which represents an increase of 50% for the year. The following chart shows annual capital spending:
Source: Rio Tinto (ASX:RIO)
The company’s long-life tier 1 assets have the capability to deliver brownfield growth at reduced capital outlays, with its iron ore assets a real standout. Having assets with this characteristic does, we believe, deliver future growth even with diminishing capital outlays. The company continues to spend only modestly with US$5.5 billion forecast for 2018 and US$6.0 billion for each of 2019 and 2020. We have no concerns over the company’s modest capital spending programme, but are pleased that the downtrend is now broken.
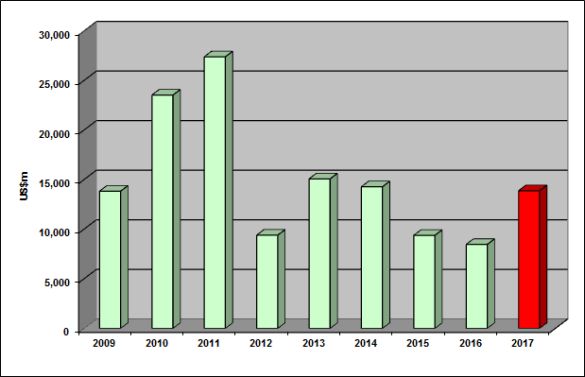
A beneficiary of the stronger financial performance in 2017 was the company’s free cash flow from its own operations, which surged for the year. The following chart shows free cash flow from operations:
Source: Rio Tinto (ASX:RIO)
Rio generated US$13.9 billion in free cash flow from its operations, which represents a surge of 64% on the prior years’ result. We consider the company’s free cash flow from its operations is very supportive of the company’s endeavours. We note the company’s target is to deliver US$5 billion of extra free cash flow out to 2021, from further productivity initiatives.
It has been the company’s goal to sustain free cash flow from its operations across commodity cycles.
Commodity prices have turned and as the above chart shows, Rio has achieved the this goal (and over a period of weak commodity prices) for this cycle.
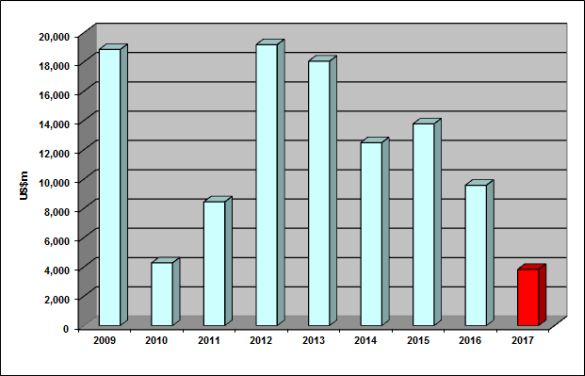
The balance sheet has continued to benefit from the company’s optimising drives and the return of stronger commodity prices, to finish 2017 in excellent shape. The following chart shows annual net debt:
Source: Rio Tinto (ASX:RIO)
At 31 December 2017 Rio’s net debt stood at US$3.8 billion, decreasing by US$5.7 billion or 60% on the 2016 figure. The resultant decline in the company’s indebtedness saw its gearing ratio drop to a mere 7% at the end of 2017 from only 17% from a year earlier. The 2017 result is well below the company’s targeted range of 20% to 30% gearing.
On the constituent parts of net debt, in cash and debt saw both have a positive impact on the 2017 calculation. Debt declined by US$4.2 billion in 2017, while the cash pool increased by US$1.9 billion. The company divested US$2.8 billion in assets in 2017 to aid the cause. We have no concerns over the structure of the balance sheet.
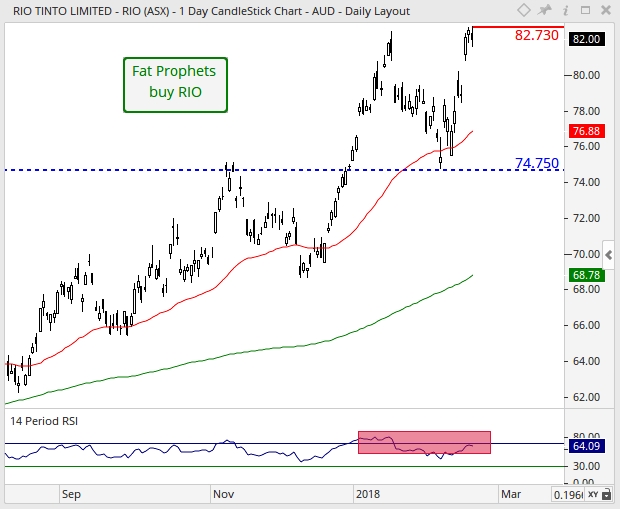
Turning to the daily chart, initial support is sighted at the 50-day moving average (red line) of $76.88, followed by structural support of $74.75 (horizontal dashed-blue line), should the bears emerge over the near-term. It should be noted that the strength of the underlying rally in the share price since early-February (i.e. from the $75.00 region) has led the RSI to rise within range of overbought territory. As such, short-term upward momentum is likely to fade in due course. Positively, and from a broader standpoint, the share price of Rio Tinto remains above both the 50 (red line) and 200 (green line) day moving averages, which signal’s medium-term momentum to remain tilted in favour of the bull-camp. For this reason, and from a probability perspective, an eventual challenge of the February intra-month high of $82.73 (horizontal red line) would be the more likely route, moving forward.
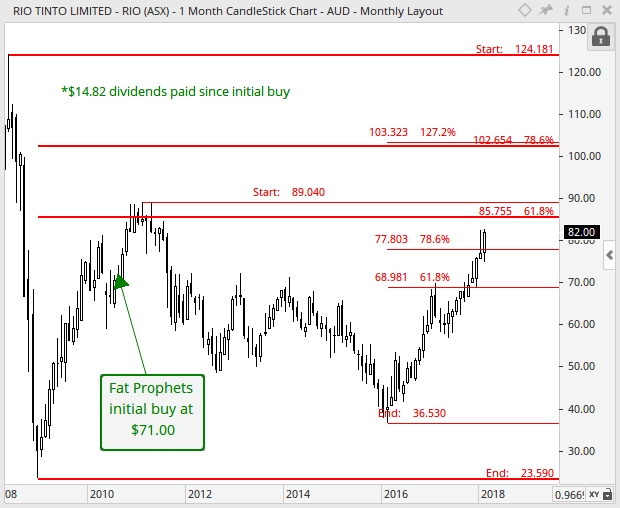
With reference to the monthly chart, resistance was respected at the 61.8% Fibonacci retracement (thin-red set of retracements) of $68.98 in February 2017. This led to a short-term correction to unfold until May 2017, which has now terminated. Moving forward, we would expect prices to gravitate towards a band of resistance evident between $85.76 and $89.04. This is made up of the long-term 61.8% Fibonacci retracement (solid-red set of retracements) and the February 2011 resistance level respectively. A definitive clearance of this price range would likely boost upward momentum and result in a gradual ascent towards the next resistance range sighted between $102.65 and $103.32. This consist of the long-term 78.6% Fibonacci retracement (solid-red set of retracements) and the 127.2% Fibonacci extension respectively.
Shareholders were greeted to a record annual dividend of US$2.90 per share which was well ahead of the US$1.70 per share paid in 2017. The dividend was within the determinants of 40% to 60% of underlying earnings subject to the company cash requirements. Consensus was for a 2017 dividend of US$2.75 per share.
To add to shareholder returns the company added a further US$1.0 billion to its share buyback programme.
The company completed US$4.7 billion in share buybacks over 2017. We are very supportive of the buyback programme.
Rio Tinto (ASX:RIO) has a pristine balance sheet that continues to improve on company initiatives and its financial performance. With long-life tier 1 assets and a financial capacity to deliver, we consider the company is well positioned to deliver growth. Rio has proven that it has the capacity to deliver value (albeit diminished) through commodity price cycles.
Consequently, our buy recommendation for Members without any exposure to the stock, remains unchanged.
Disclosure: Rio Tinto (ASX:RIO) is held within the Fat Prophets Concentrated UK Share, Fat Prophets Mining and Resources and Fat Prophets Concentrated Australian Share Portfolios.
Fat Prophets has made every effort to ensure the reliability of the views and recommendations expressed in the reports published on its websites. Fat Prophets research is based upon information known to us or which was obtained from sources which we believed to be reliable and accurate at time of publication. However, like the markets, we are not perfect. This report is prepared for general information only, and as such, the specific needs, investment objectives or financial situation of any particular user have not been taken into consideration. Individuals should therefore discuss, with their financial planner or advisor, the merits of each recommendation for their own specific circumstances and realise that not all investments will be appropriate for all subscribers. To the extent permitted by law, Fat Prophets and its employees, agents and authorised representatives exclude all liability for any loss or damage (including indirect, special, or consequential loss or damage) arising from the use of, or reliance on, any information within the report whether or not caused by any negligent act or omission. If the law prohibits the exclusion of such liability, Fat Prophets hereby limits its liability, to the extent permitted by law, to the resupply of the said information or the cost of the said resupply.
Funds Management – In addition to the listed funds FPC, FPP and FATP, Fat Prophets Pty Ltd manages the separately managed accounts, namely Concentrated Australian Shares, Australian Shares Income, Small Midcap, Global Opportunities, Mining & resources, Asian Share, European Share and North American Share. These SMAs are managed under their own mandates by the fund managers, and this is independent to the research reports.
Staff trading – Fat Prophets Pty Ltd, its directors, employees and associates of Fat Prophets may hold interests in many ASX-listed Australian companies which may or may not be mentioned or recommended in the Fat Prophets newsletter. These positions may change at any time, without notice. To manage the conflict between personal dealing and newsletter recommendations the directors, employees, and associates of Fat Prophets Pty Ltd cannot knowingly trade in a stock 48 hours either side of a buy or sell recommendation being made in the Fat Prophets newsletter. Staff trades are pre-approved by an appointed staff trading compliance officer to ensure compliance with the staff trading policy.
For positions that directors and/or associates of the Fat Prophets group of companies currently hold in, please click here.
