
A good all-around package
The performance of global packaging giant Amcor’s (ASX:AMC) shares has been subdued over the past year. However, the company has a strong long-term track record of generating wealth for its shareholders and remains well placed to do so in the future. There is still plenty of scope for consolidation in the fragmented packaging industry and management has been disciplined regarding capital allocation. The business is well-managed and restructuring initiatives are expected to reduce costs further over the next couple of years.
Acquisitions have long been a growth driver for Amcor:
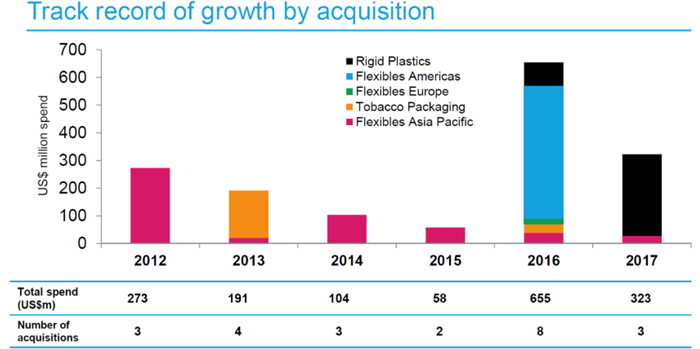
Source: Amcor (ASX:AMC) August 2017 presentation
Amcor (ASX:AMC) delivered solid full year results, despite headwinds from exchange rate changes and emerging markets.
Revenue fell 3.4% year-on-year to US$9.1 billion but operating earnings increased 3% year-on-year to US$1.088 billion to marginally beat the consensus estimate, fuelled by organic growth and acquisitions. The underlying operating margin expanded from 11.2% the prior fiscal year to 12.0%.
PBIT (profit before interest and tax) at the Flexible packaging business (i.e. food wrapping, folding cartons and closures), which accounts for about 2/3 of sales, increased 6.5% in to US$804.7 million, although in constant currency terms the increase was stronger 8.2%. Underlying margins in the segment edged up 40 basis points to 12.9%.
The Rigid Plastics business is one of the world’s largest suppliers of polyethylene terephthalate (PET) packaging, as well as providing containers and closures using other plastic resins. It faced significant headwinds, given challenging conditions in Latin America and sales fell 14.3% year-on-year, although sales from ongoing operations edged up 3.8%. On an absolute basis, PBIT slipped 2.8% to US$342.7 million. That was a resilient result given the headwinds and on a constant currency basis, PBIT was up 8.6% year-on-year. The underlying margin increased 1.4 percentage points to 11.9%.
Group underlying net profit edged above US$700 million for the first time in the company’s history, representing a 4.5% increase. In constant currency terms, the increase in underlying net profit was a healthy 9.6%, while statutory profits more than doubled to US$597 million.
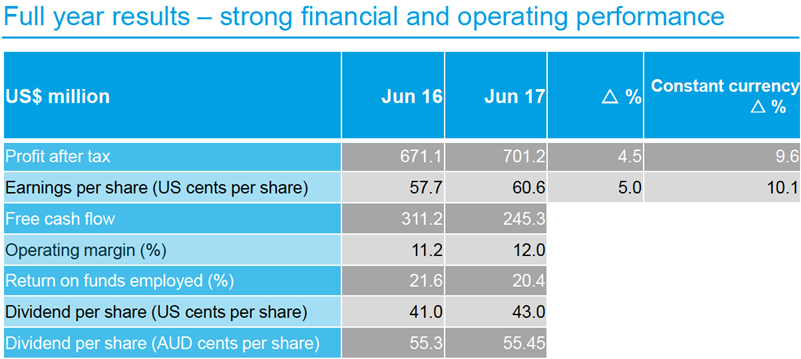
Source: Amcor (ASX:AMC) 2017 AGM presentation
While profits have shown momentum the share performance has been broadly flat., thus we believe the stage is set for a return to gains in the year ahead.
Although financial leverage ticked up in fiscal 2017, a sub-3 times net debt / EBITDA (earnings before interest, tax, depreciation and amortisation) remains comfortable in our view for a diversified packaging company. In addition, Amcor’s packaging solutions are also well positioned to cater to long-term shifts in shopping habits, in our view.
E-commerce is booming and according to eMarketer, now represents approximately US$1.3 trillion of the US$22 trillion global retail market. With far higher growth rates than the broader retail market – spurred by higher internet penetration rates, busy lifestyles and improving logistical solutions – its percentage of the total retail pie is set to continue to grow over the next 5-10 years.
Within the broader e-commerce market, consumable categories such as groceries (packaged and fresh), home care and personal care products have been slower to gain popularity than more durable categories (i.e. books, stationary, clothing, video game related products). However, while there continue to be challenges facing the wide-spread adoption for these categories, there are signs of shifting shopping preferences to online, especially in some markets. In our view, Amcor should be a beneficiary of these shifting shopping preferences in areas such as food and beverages, personal care, home care and healthcare.
Packaging for consumables via online sales often differs from those used in a bricks-and-mortar shopping environment. This is because the supply chain can be longer and use multiple modes of transportation, requiring more robust packaging. The weight of material can also significantly impact shipping costs, with forms of plastic (where Amcor is a leader) much lower than glass. How packaging looks is also becoming more important, especially to younger shoppers, and the likes of the differentiated packaging Amcor can offer could help influence shopping decisions.
Amcor (ASX:AMC) will remain held in the Fat Prophets portfolio. For Members without exposure, we retain our buy rating.
2017 AGM
The company’s AGM touched on first quarter trading, company strategy and a recap of the last fiscal year (which we covered in detail in issue FAT-AUS-840).
Although the first quarter trading update was not detailed, management provided some commentary ahead of the interim results due out next month. It was a challenging first quarter due to industry conditions (i.e. raw material cost headwinds, particularly in emerging markets) rather than company specific issues. Still, management stuck with its modest growth range outlook for the 2017/2018 fiscal year that it provided in August 2017.
To respond to raw material cost increases, management has undertaken initiatives to better utilise its capacity, push through prices increases and reduce costs.
Given management’s strong operational track record, we are inclined to expect the business to adapt well to the challenges, but note decent profit growth this year will most likely require an incremental improvement in conditions.
In terms of strategy, this effectively remains the same for the company.
It contains three elements, being a focused portfolio of businesses, differentiated capabilities and the shareholder value creation each of the businesses can deliver. This is highlighted in the following graphic:
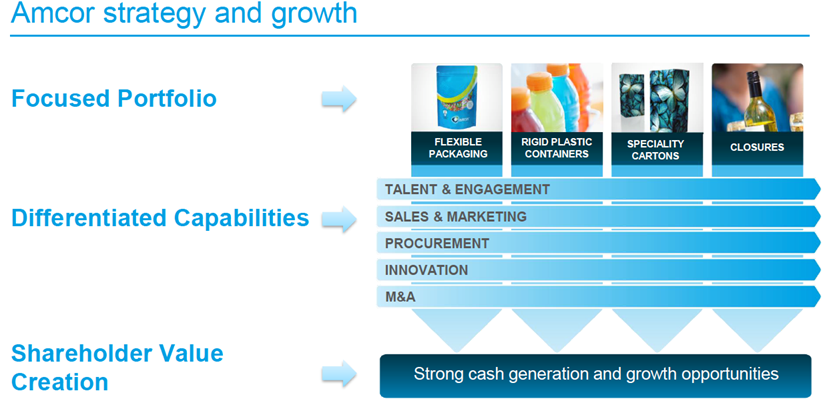
Source: Amcor (ASX:AMC) 2017 AGM
The four segments focused on are flexible packaging, rigid plastic containers, speciality cartons and closures. In these areas management believe there is a mix of focus on primary packaging and packaging for fast-moving consumer goods (FMCG), attractive industry structure and decent growth prospects. To compete, Amcor seeks to either be a leader, have scale advantage, or offer a differentiated product.
The company views areas such as sales and marketing, procurement and innovation to be where it can edge out much of the competition. It also has the scale and financial strength to do mergers and acquisition (M&A) to further consolidate the industry.
Finally, the shareholder value creation blueprint the company refers to is highlighted in the below graphic. It comprises dividends, reinvestment in the business and buy-backs or M&A combining to try and deliver double digit per annum shareholder value creation:
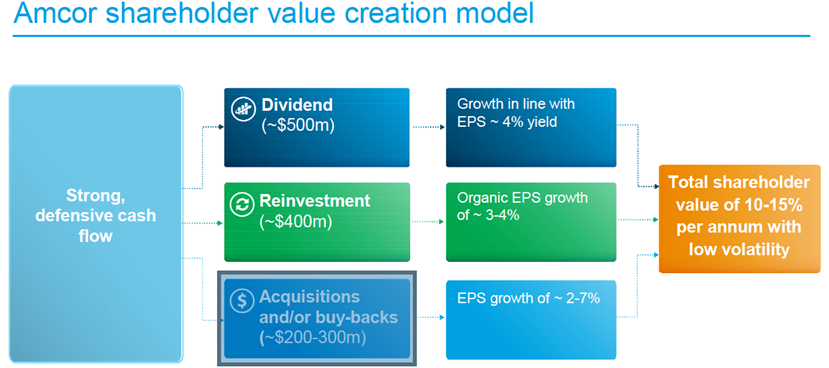
Source: Amcor (ASX:AMC) 2017 AGM presentation
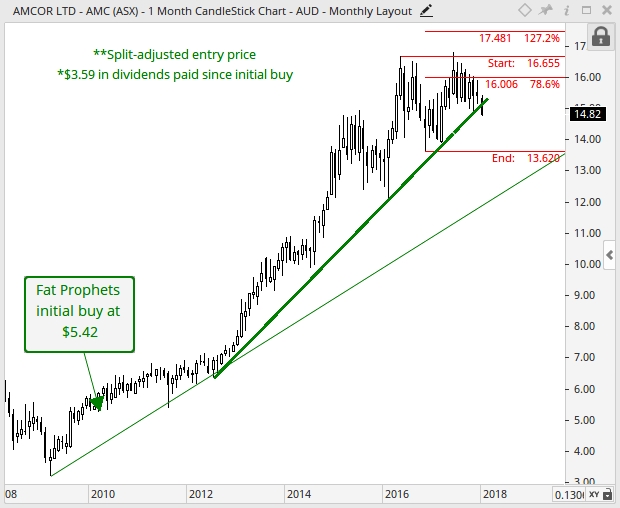
Moving onto the technical picture, and with reference to the monthly chart, dynamic support is currently being tested at the medium-term uptrend line of $14.90 (upward sloping solid-green line). If the bears were to be successful in dragging prices below this level, then downward pressure over the near term could potentially result in a gradual decline towards the November 2016 low of $13.62. Positively, from a macro perspective, prices have closed (on a monthly-basis) above the 78.6% Fibonacci retracement of $16.01 in June 2017. This is a bullish development, as an activation of the next broader term upside target of $17.48 is triggered (127.2% Fibonacci extension). Furthermore, long-term momentum is favoured to the upside, as evident from the series of higher lows and higher highs, which are characteristics of a dominant broader term uptrend in place.
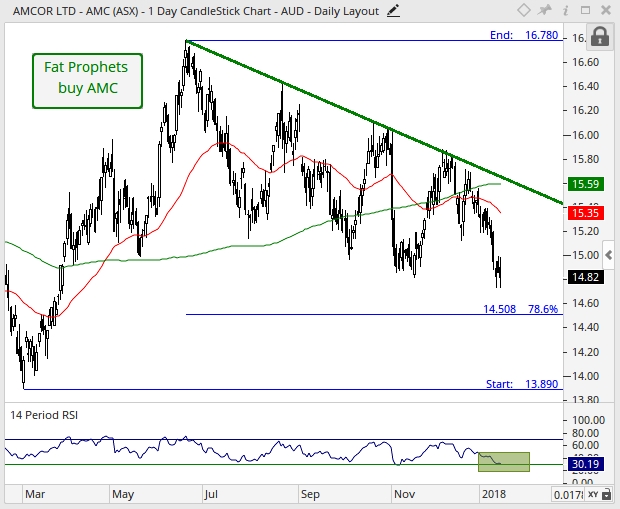
Turning to the daily chart, the bearish moving average crossover present since mid-November 2017 is suggestive of momentum to favour the downside (where the 50-day moving average red line crosses below the 200-day moving average green line). If the bears were to remain in control over the near term, then support is sighted at the 78.6% Fibonacci retracement of $14.51. Positively, from a relative strength perspective, the RSI has declined into oversold territory which is suggestive of downward pressure to be on the exhaustion trail. For upward momentum to step up a notch, a sustained break above the downtrend line (downward sloping green line) of $15.65 is required. Should this favourable scenario unfold, then medium-term momentum would once again shift in favour of the bull-camp.
Summary
All in all, we viewed Amcor’s FY17 results as positive for the company despite a low growth environment and headwinds in Latin America. The first quarter trading update highlights challenges are still present, but Amcor’s strong long-term track record of creating wealth for shareholders is compelling and medium to long-term prospects for the company remain attractive in our view, with plenty of scope for further consolidation the industry and shifting shopping habits making its offerings appealing. Corporate tax cuts in the US could also provide a boost considering Amcor has a sizeable and growing North America business.
On the valuation front, Amcor (ASX:AMC) is currently trading at 16.4 times FY18 earnings with a prospective yield of 4.4%.
Accordingly, Amcor (ASX:AMC) will remain held in the Fat Prophets portfolio. For Members without current exposure we retain our buy rating.

