Sample Report | Old Report | Not Current

NAB (ASX:NAB) Share Analysis and Stock Report

NAB
January 31, 2023 FAT-AUS-1105
AUD31.76
Core
medium
National Australia Bank
National Australia Bank Limited (NAB) is a financial services company. The Company's segments include the Business and Private Banking, Personal Banking, Corporate and Institutional Banking, New Zealand Banking and Corporate Functions and Other. Business and Private Banking focuses on small and medium customer segments, including specialized Agriculture, Health, Government, Education and Community services. Personal Banking provides customers with products and services provides home loans or manage personal finances through deposit, credit or personal loan facilities. Corporate and Institutional Banking provides a range of products and services including client coverage, corporate finance, markets, asset servicing, transactional banking and enterprise payments. It consists of Partnership Banking, servicing retail, business, and private customers; Corporate and Institutional Banking, servicing corporate and institutional customers, and includes Markets Sales operations in New Zealand.
Market Capitalisation: AUD99.77b
 Price to EarningsDividend Yield (%)Price to BookReturn on Equity (%)
FY112.745.371.6113.18
FY212.705.571.5513.18

Banking after the commission.

Shares in NAB (ASX:NAB) has remained buoyant with current movements at the high end of the current price consolidation area as the bank emerges from the covid era and the royal commission into banking practices, that saw major reputational damage and a shakeup internally with the improving results now making their way onto the balance sheet.

The Daily chart for NAB displays a multi quarter pennant pattern, this type of continuation pattern indicates the potential for higher prices following a breakout. The 20 period simple moving average has crossed the 200 day moving average with price remaining above both averages.
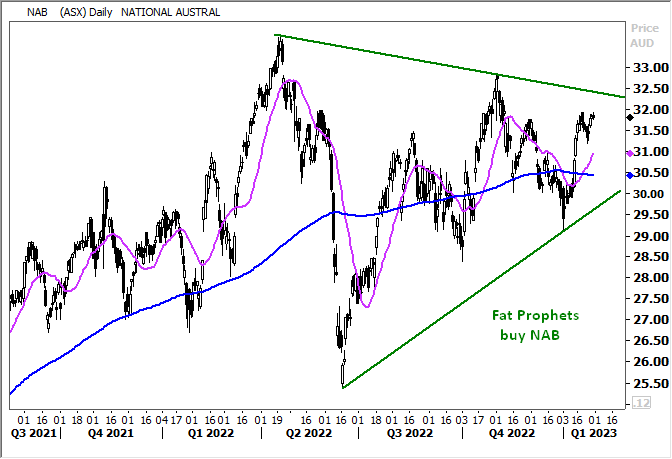
National Australia Bank (ASX:NAB) Share Price Chart

In recent commentary NAB has acknowledged the underlying market dynamics are changing with volume growth expected to slow in FY23, higher refinance activity as fixed rate loans mature coupled with intense price competition in a rising rate environment. This FY22 results outcome reflects continued execution of the banks strategy outlined in the 1H-22 results, including targeted volume growth and a disciplined approach to managing costs while investing for growth. The changing environment after 11 years of interest rate reductions, has resulted in earnings also benefiting in FY22 period from the new rising interest rate environment.

We review the FY2022 numbers and review our recommendation with 1H23 results due out in the coming month.

The FY 22 results show a net profit of A$6.89b an overall increase of 8.3% from FY2021, overall income increased 8.9% to A$18.296b for the full year.

National Australia Bank (ASX:NAB) Financials

Source: NAB (ASX:NAB)

Both sides of the business are growing with lending for home loans increasing 7.1%, however the bank has flagged some headwinds against a slowing property market and rising interest rates placing cost pressure onto households.

Ongoing process and technology improvements contributing to improved customer experience in FY22 has moved to more than 85% of digital-enabled loan modifications by customers being processed via self-service within the NAB App.

The simple home loan product (SHL) rollout across the broker channels remains on track for completion in FY24. About 90% of Retail flow now submitted via the simple home loan product guidelines featuring variable Loan to valuation pricing app. This is leading to over the counter transactions declining 32% from 2020 and inbound call also declining 23% with the digital chatbot interactions increasing 163% over the same period.

The business loan book remains robust with account openings up by 28% since 1H-22, with business loan growth of 13% in the small to medium enterprise lending, within the Australian business lending growth of 12% has been derived from an increased lending for the Agricultural by 16.4% followed by trade and manufacturing lending growth of 13.8%. With technology now playing a greater role the business unit, costs fell by 11% through simplification of the application process.

National Australia Bank (ASX:NAB) Financials Source: NAB (ASX:NAB)

With the increase in credit provision comes the risk of credit impairment, the bank has moved the credit impairment write back provision higher to A$125m, it is pleasing to note the ratio of 90+ day of overdue loans has decreased 28bps to represent 0.66% of the gross loans on the book.

Looking at the divisional performance the bank has returned a very strong across the board result with business & private Banking growing A$3,013b or 21.5%.

The strong earnings being driven by higher revenue and volume growth, with the result from the current interest rate cycle providing higher operating margins, combine this with lower credit impairment charges provides a strong start for 1H-23.

These results have been offset by higher inflationary pressures and by higher operating expenses, including the impact for the HICAPS integration of Lantern Pay healthcare by way of full acquisition.

Personal Banking declined to A$1,591b or 3.6% over FY21, earnings declined primarily reflecting the impact of home lending competition on margins. Excluding the impact of the Citi consumer business, the Citi consumer business, was down 4.4%  revenue declined with lower margins more than offsetting lower operating costs. A lower level of credit impairment write-backs was also a key driver.

Corporate and institutional banking was the strongest driver with A$1,628b or 34.9 growth, with higher revenue mainly reflecting strong volume growth and higher margins, combined with lower credit impairment charges. New Zealand Banking added NZ$1,403b or 14.1, again revenue increasing due to growth in volumes and higher margins.

This solid improvement in the banks Net profit has supported a healthy increase in dividend back to $1.51 again, approaching the payout reminiscent of pre covid 2019 where the bank offered $1.98.
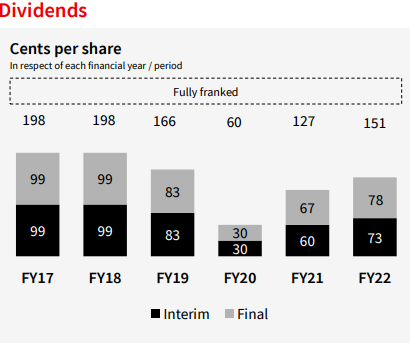
National Australia Bank (ASX:NAB) Financials Source: NAB (ASX:NAB)

NAB (ASX:NAB) will enter FY23 well positioned for what is likely to be a more challenging environment. The business has growth momentum to their reinvigorated strategy, but note retail spending has remained robust, but higher official interest rates are likely to put pressure on disposable income and lead to reduced spending, with the main impact on consumption growth expected across 2023.

The monthly chart for NAB (ASX:NAB) shows the current price movements crossing the multi year down trend line and consolidating below the $33.00 level. Price remains above the 12 month moving average.
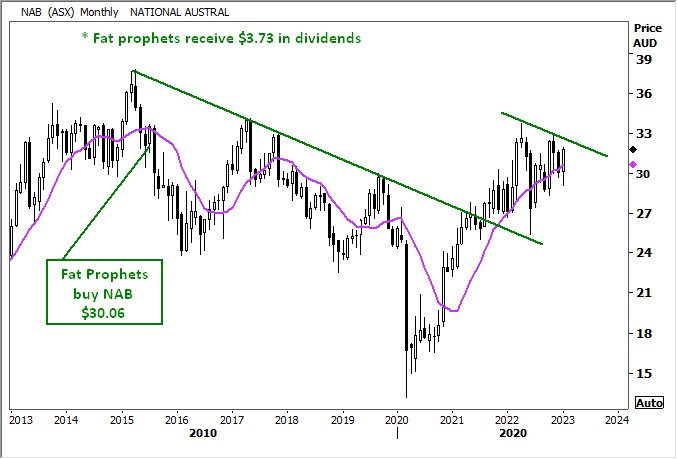
National Australia Bank (ASX:NAB) Share Price Chart Summary

Pent-up real estate and retail demand post COVID-19 now appears to be moderating across the industry. There is evidence customers are now prioritizing spending and ‘trading down’ purchases, with the trend of spending being directed towards services including travel rather than larger household items as the economy move through the interest rate and inflationary cycle.

We retain our Buy recommendation for members without exposure and a medium term outlook.

For Fat Prophets’ current equity research and membership options, visit our Products page.

About this archived stock report

This is an archived Fat Prophets equity research stock report and share analysis. It does not constitute current investment advice, financial product advice, or a recommendation to buy, sell or hold any financial product. It is provided for historical reference only, and reflects the market conditions, company information, forecasts and opinions available at its original publication date. The information may no longer be current or applicable. Past performance is not a reliable indicator of future performance. This is general information only and does not take into account your objectives, financial situation or needs. Before acting on anything in this report, you should consider its appropriateness to your circumstances and seek advice from a licensed financial adviser.

DISCLAIMER Fat Prophets has made every effort to ensure the reliability of the views and recommendations expressed in the reports published on its websites. Fat Prophets research is based upon information known to us or which was obtained from sources which we believed to be reliable and accurate at time of publication. However, like the markets, we are not perfect. This report is prepared for general information only, and as such, the specific needs, investment objectives or financial situation of any particular user have not been taken into consideration. Individuals should therefore discuss, with their financial planner or advisor, the merits of each recommendation for their own specific circumstances and realise that not all investments will be appropriate for all subscribers. To the extent permitted by law, Fat Prophets and its employees, agents and authorised representatives exclude all liability for any loss or damage (including indirect, special, or consequential loss or damage) arising from the use of, or reliance on, any information within the report whether or not caused by any negligent act or omission. If the law prohibits the exclusion of such liability, Fat Prophets hereby limits its liability, to the extent permitted by law, to the resupply of the said information or the cost of the said resupply.

Funds Management – In addition to the listed fund FPC, Fat Prophets Pty Ltd manages the separately managed accounts, namely Concentrated Australian Shares, Australian Shares Income, Small Midcap, Global Opportunities, Mining & Resources, and Asian Shares. These SMAs are managed under their own mandates by the fund managers, and this is independent to the research reports.

Staff trading – Fat Prophets Pty Ltd, its directors, employees and associates of Fat Prophets may hold interests in many ASX-listed Australian companies which may or may not be mentioned or recommended in the Fat Prophets newsletter. These positions may change at any time, without notice. To manage the conflict between personal dealing and newsletter recommendations the directors, employees, and associates of Fat Prophets Pty Ltd cannot knowingly trade in a stock 48 hours either side of a buy or sell recommendation being made in the Fat Prophets newsletter. Staff trades are pre-approved by an appointed staff trading compliance officer to ensure compliance with the staff trading policy.

For positions that directors and/or associates of the Fat Prophets group of companies currently hold in, please click here.

Fat Prophets Logo

Stock Disclosure

ASX- Listed Australian Stocks:
29M.AU, ANN.AU, ANZ.AU, BPT.AU, BWP.AU, CKF.AU, CBA.AU, EVN.AU, FID.AU, FMG.AU, GOR.AU, GMG.AU, GNC.AU, HUB.AU, ILU.AU, IGO.AU, JHX.AU, MGR.AU, NAB.AU, PAR.AU, QBE.AU, RRL.AU, S32.AU, SBM.AU, TLS.AU, TUA.AU, WES.AU, WBC.AU, WHC.AU, XRO.AUX, AGL.AX, AMC.AX, BHP.AX, CSL.AX, DMP.AX, GDG.AX, WIRE.AX, ATOM.AX, MQG.AX, NIC.AX, NST.AX, ORI.AX, PDN.AX, RMS.AX, RPL.AX, SFR.AX, STO.AX, SUN.AX, VAU.AX, WTC.AX, WDS.AX, GMD.AX, CSC.AX, RIO.AX, GTK.AX, SPK.AX & NEM.AX

International Stocks:
BIDU.CN, 9888.CN, 1211.CN, 268.CN, 3690.HK, 1818.HK, 9618.CN, ENX.FR, BT.A.GB, GENI.GB, FRES.GB, 9988.HK, 2282.HK, 700.HK, 1128.HK, 1876.HK, 8750, 7011.T, 8306.JP, 8031.T, 8411.T, 3994.T, 7974.T, 8604.JP, 8308, 6758.JP, 8316.JP, 8331.T, JP.8308, HEM.SE, GRAB.SG, BABA.K, GOOG.US, AAPL.US, CDE.US, CPNG.K, FLTRF.L, SIL, URA, BZ.O, MSFT.US, SBSW.K, 2840.HK, TME, GDX, GDXJ.US, YUMC.K, Z.O, IMPUY & ANGPY