
Battling Cost Headwinds
Shares of global packaging giant Amcor (ASX:AMC) have underperformed over the past year, with sharply rising input costs and lower volumes in the North American beverage business posing a headwind for profits and weighing on investment sentiment.
However, the company has a strong long-term track record of generating wealth for its shareholders and remains well placed to do so in the future.
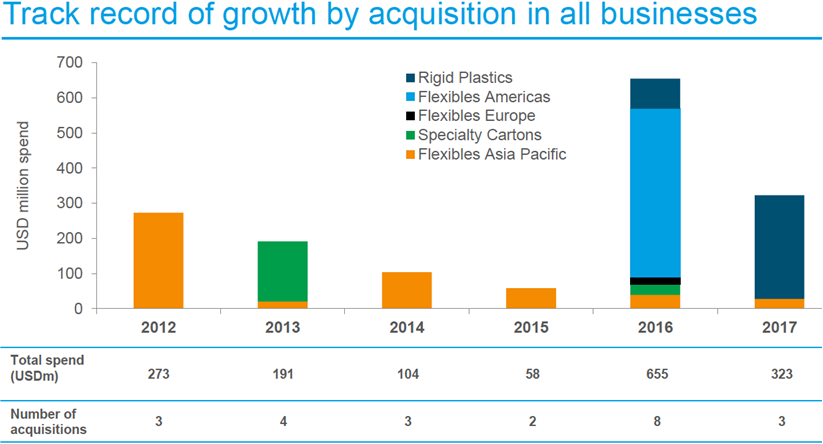
There is still plenty of scope for consolidation in the fragmented packaging industry and management has been disciplined regarding capital allocation. Amcor is in the number one or two position in most of their market areas, so should be able to grow market share profitably via acquisition by leveraging already strong footprints.
Source: Amcor (ASX:AMC)
The business is well-managed and restructuring initiatives are expected to reduce costs further over the next couple of years. At the time of the interim results announcement in February CEO Ron Delia stated, “We have continued to make progress against our strategic priorities with investments in the Alusa and Sonoca acquisitions and restructuring initiatives in the Flexibles segment, contributing more than USD 30 million to PBIT in the current half. Together these investments will deliver more than USD 100 million of PBIT growth across the three-year period ending FY2020, in addition to organic growth and further M&A.”
The segments Amcor is focused on are flexible packaging, rigid plastic containers, speciality cartons and closures. In these areas management believe there is a mix of focus on primary packaging and packaging for fast-moving consumer goods (FMCG), attractive industry structure and decent growth prospects. To compete, Amcor seeks to either be a leader, have scale advantage, or offer a differentiated product.
Emerging markets offer long-term growth potential, even though currently face headwinds. We also view Amcor’s packaging solutions as also well positioned to cater to long-term shifts in shopping habits, with the rise of e-commerce.
Amcor (ASX:AMC) will remain held in the Fat Prophets portfolio. For Members without current exposure we retain our buy rating.
1H18 snapshot – Currency in US$ unless noted otherwise
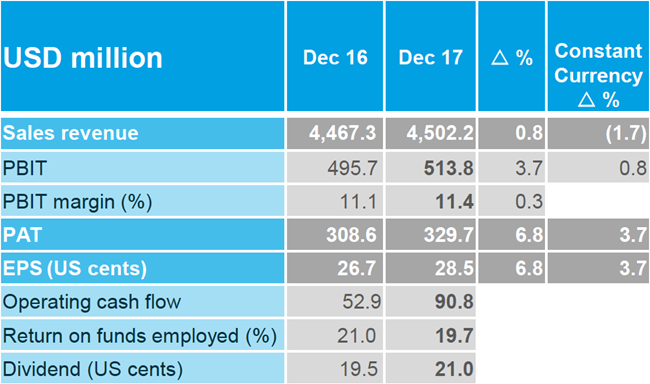
First half 2018 actual revenues edged up 0.8% percent to $4.5 billion, although in constant currency declined 1.7%. The Flexibles business accounted for roughly 70% of total revenues in the period and saw a low single digit revenue increase, partially offset by a low single digit decline in Rigid Plastics revenue. By geography, the company generated around one-third of its revenues from each of North America and Western Europe, 30% from emerging markets and the remainder from Australia and New Zealand.
Gross profit fell 4% to $894.9 as input inflation pressured margins. The company’s cost of sales increased 2% to $3.61 billion. Resin and aluminium prices increased at a double-digit pace in the first half of the year, while other input costs such as ink also increased.
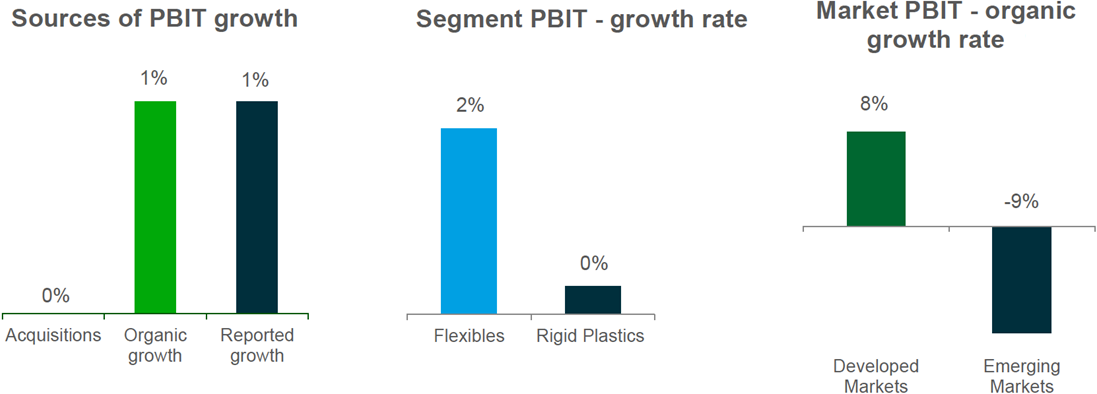
Profit before interest and tax (PBIT) increased 3.7% to $513.8 million and the increase in constant currency was 0.8%. Growth in PBIT was driven by margin expansion and organic growth in developed markets, more than offsetting a decline in emerging markets. Earnings from acquired businesses were in line with a year earlier, as incremental synergy benefits were offset by integration costs and underlying earnings in emerging markets. The PBIT margin expanded 30 basis points to approximately 11.4%.
Source: Amcor (ASX:AMC)
It was a solid operating profit performance, helped by the company trimming general and administration expenses by approximately 22% year-on-year to $294.8 million in 1H18.
1H18 net financing costs of $101.7 million were 8% higher, largely due to the depreciation of the US dollar against the currencies in which borrowings have been drawn. The impact of tax reforms in the US was relatively minor for Amcor and the company expects the impact to be broadly neutral going forward.
Profit after tax (PAT) before significant items increased 6.8% on a reported basis and 3.7% in constant currency to $329.7 million. The favourable impact on PAT was driven by an approximate 7% depreciation of the US dollar against the Euro, with a lesser benefit from a 3% depreciation in the weighted average exchange rate for the US dollar against all other currencies.
Source: Amcor (ASX:AMC)
Earnings per share increased by the same percentages as PAT before significant items to 28.5 cents, equating to 26.17 Australian cents. Statutory PAT of $329.7 million increased 15% from a year earlier. The unfranked interim dividend of 21.0 US cents per share was 1.5 cents, or 7.7% higher year-on-year.
Return on funds employed contracted 1.3 percentage points, but remained strong at 19.7%. Leverage as measured by net debt profit before interest, tax, depreciation and amortisation (PBITDA) over the last twelve months remained similar at 7.9 times. Interest cover fell from 7.9 times at the end of 1H17 to 7.5 times at the end of 1H18 but remains comfortable. We also find the leverage ratio acceptable given many of the company’s customers operate in relatively stable industries and Amcor’s customer base is diversified.
Segment performance
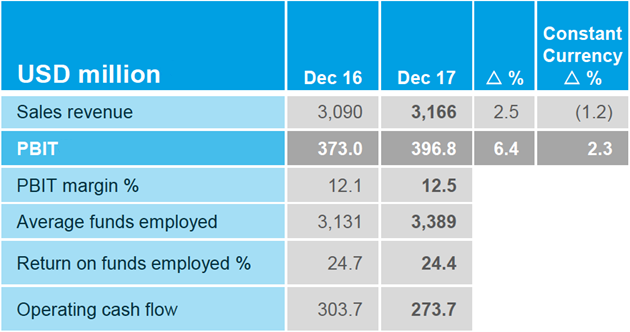
The Flexibles segment posted a 2.5% increase in revenues to $3,166 million, although in constant currency revenues declined 1.2%. There was decent growth in developed markets, but emerging markets were relatively weak.
PBIT increased 2.3% in constant currency terms to $396.8 million and was up 6.4% reported as the operating margin expanded 40 basis points to 12.5%, which was a solid result given the business faced a significant headwind from rising input costs during the period. Amcor is generally able to pass these higher costs on to customers over time but there is usually a lag. The adverse impact of higher input costs on the segment in 1H18 was around $20 million. Amcor’s execution of its restructuring in the segment progressed well and the company has lifted its medium-term target for its investment in the area. Operating cash flow for the segment declined from a year earlier.
Flexibles headline numbers:
Source: Amcor (ASX:AMC)
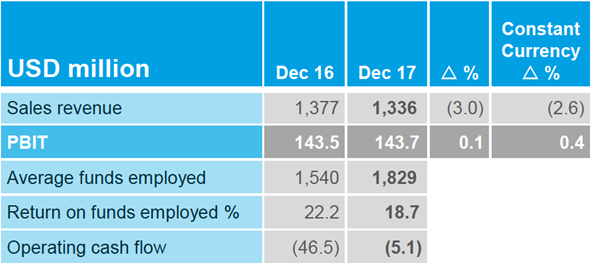
Revenues in the Rigid Plastics segment declined 3.0% on a reported basis to $1,366 million and were down 2.6% in constant currency. The beverage market in North America was relatively soft, hitting segment volumes.
PBIT was effectively flat at $143.7 million in 1H18 compared to $143.5 million in 1H17. At constant currency PBIT increased marginally (+0.4%) with solid cost management in the business. The profit margin in the segment increased 40 basis points to 10.8%, but return on funds employed fell from 22.7% in 1H17 to 18.7%. Operating cash flow remained negative but improved.
Rigid Plastics headline numbers:
Source: Amcor (ASX:AMC)
Outlook
At the time of the interim report, in the Flexibles business Amcor was expecting “modest” PBIT growth over the $804.7 million reported for the segment in the year ending June 2017, assuming incremental benefits from restructuring, the Alusa acquisition and organic growth, partially offset by an expected negative impact from higher input costs and a one-off expense to complete savings initiatives begun in the first half of the year.
In the Rigid Plastics business Amcor was expecting PBIT to be broadly in line with the $342.7 million reported for the segment in the year ending June 2017. That was assuming lower earnings from the North America beverage area, growth in Latin America and an additional five months of earnings from the acquired Sonoco blow molding business. Integration costs related to the latter were expected to offset synergy benefits during the period.
Input prices have though continued to rise since December at high single-digit pace, which will put pressure on Amcor to achieve its forecast operating profits.
At a recent conference management flagged that the Flexibles business will face an impact of at least $15 million due to higher raw material costs in the second half of the year and said, “This year’s earnings impact from these raw material increases will be the most significant in any year since FY11 and so it is clearly an unusual period.” CEO Ron Delia also warned that while the company had maintained market share in the Rigid Plastics business, “North American beverage and closure volumes have remained weak.”
The takeaway is that the company’s outlook is “modestly lower” than at the time of the interim results.
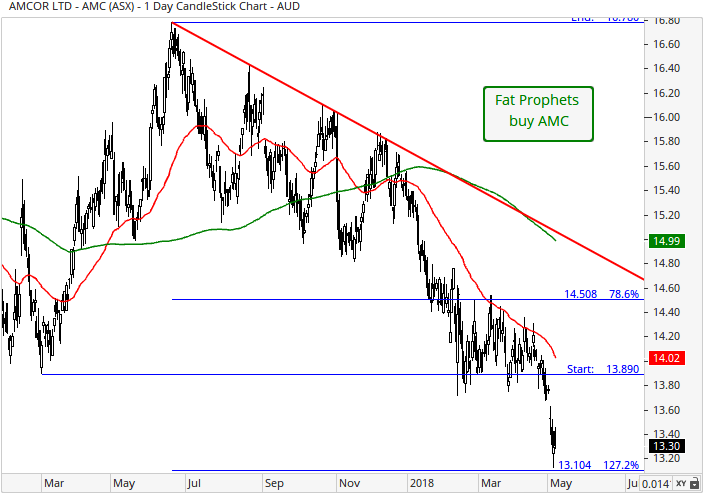
Turning to the technical picture, and the on daily chart, the bearish moving average crossover present since mid-November 2017 is suggestive of momentum to favour the downside (where the 50-day moving average red line crosses below the 200-day moving average green line). Support at the 78.6% Fibonacci retracement of $14.51 and also at $13.89 has given way. Support is now located at the 125.2% Fibonacci retracement of $13.10. For the short term picture to improve, this support line needs to hold, and a move is needed back towards the downtrend line (downward sloping green line).
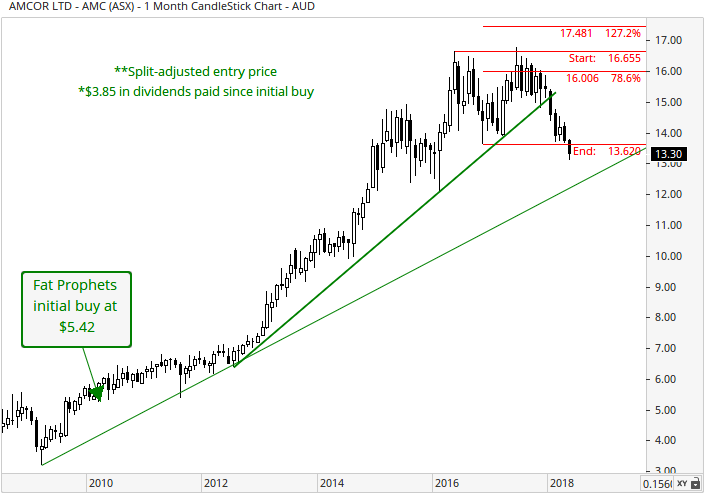
With reference to the monthly chart, dynamic support has given way at the medium-term uptrend line of $14.90 (upward sloping solid-green line). For the picture to improve, we will need to see support hold at the November 2016 low of $13.62.
Summary
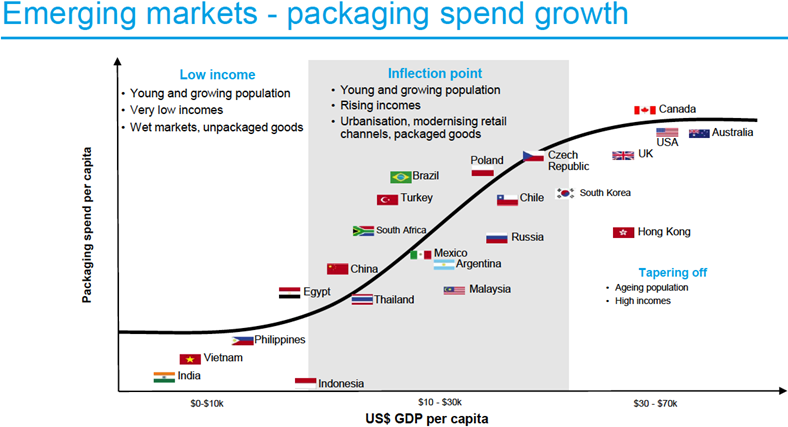
Amcor’s strong long-term track record of creating wealth for shareholders is compelling and medium to long-term prospects for the company remain attractive in our view, with plenty of scope for further consolidation the industry and shifting shopping habits making its offerings appealing. Emerging markets growth offers long-term potential, with packaging spending gap likely to narrow with developed markets such as Australia and the United States.
Source: Amcor (ASX:AMC)
Amcor (ASX:AMC) shares are trading on 15.7 times forecast FY18 earnings, falling to 14.3 times the following year. The projected yield over the same time frame is 4.8% expanding to 5.2%.
Accordingly, Amcor (ASX:AMC) will remain held in the Fat Prophets portfolio. For Members without current exposure we retain our buy rating.

