
TLS

Still in the Doghouse
Telstra (ASX:TLS) shares are still in the doghouse with investors, as the shares have continued to underperform in the wake of the revision to its dividend policy announced last August. Also weighing on shares is the significant earnings impact from the NBN roll out and potential tax changes to franking credits if the Labour party wins the next election. We would argue however that the correction in the shares has been excessive and sets the stage for some upside risk given expectations have been reset to such low levels.
Telstra (ASX:TLS) is doing well in mobile, with a strong brand and should be a beneficiary of the upcoming shift to 5G technology. The cost-out performance in the first half of fiscal 2018 was ahead of plan and impressive, with core fixed costs lowered by 7%. The company is also investing in strategic initiatives to try and plug the looming NBN earnings hole and some benefits from this are flowing through, although we expect a more meaningful impact is some way off.
1H18 snapshot
Moving onto the company’s interim results and Telstra’s revenue from ordinary activities was almost flat with a year earlier, edging up just 0.8% year-on-year to $12.9 billion in 1H18, while total income excluding finance income increased 5.9% to $14.15 billion as other income surged (+78.7%) to $1,603 million.
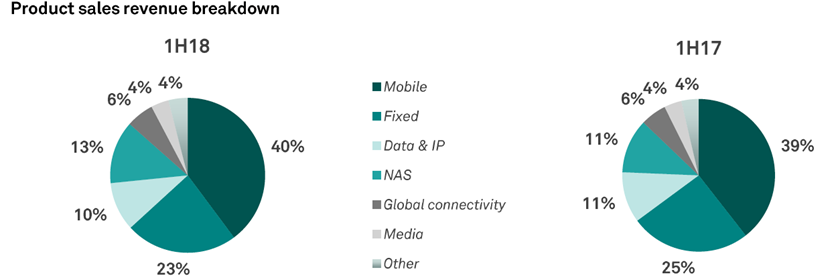
Looking at key product revenue and the performance was mixed across divisions in the first half of the year.
Mobile revenue eked out a marginal 0.8% increase to $5,082 million, while the Network Application Services (NAS) division delivered a 14.1% increase in revenue to $1,677 million. Global Connectivity revenue was up 4.4% to $735 million and media revenue excluding cable eked out a 0.8% increase to $475 million due to eth performance of Foxtel. On the other hand, fixed-line revenue fell 8.3% to $2,986 million and Data & IP revenue declined 5.5% to $1,300 million.
Source: Telstra (ASX:TLS)
Telstra (ASX:TLS) announced in August 2017 that was targeting more than a $1 billion reduction in underlying core fixed costs by FY20 and an additional $500 million annual reduction by FY22.
Positively, the company was ahead of the required run rate in in 1H18 with underlying core fixed costs declining by 7.2% or $249 million to $3,211 million. Some of the cost cutting is coming from trimming headcount and innovation. Total reported operating expenses did increase though, rising 10.6% to $9,418 million due to several factors, including increased NBN costs and higher NAS costs, which in the latter’s case will support that segments double-digit revenue growth.
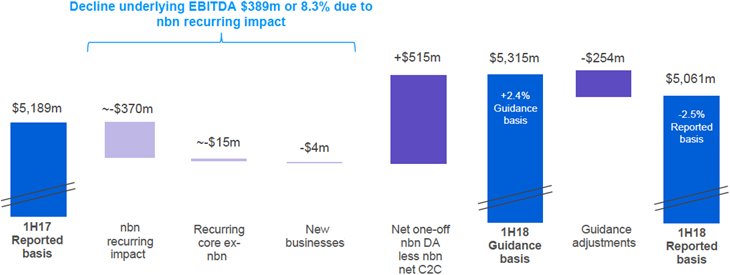
Reported EBITDA declined 2.5% to $5,061 million, with the impact from the roll out of the NBN project a material drag. Through to 2020 the NBN roll out is expected to detract from EBITDA to the tune of about $3 billion. To date, Telstra has absorbed around $870 million of that earnings hole, which includes $370 million in the first half of fiscal 2018 as shown in the following chart.
Source: Telstra (ASX:TLS)
To try and plug this hole Telstra has earmarked up to $3 billion for its strategic investment program and the company is on track to deliver economic benefits from this of more than $500 million of EBITDA by FY21. And CEO Andrew Penn stated in the first half year results media release that, “We will accelerate these investments to lay the foundation for future success, scrutinising every aspect of our capital spending to ensure our investments are driving the greatest results.”
Through to the end of December 2017 Telstra had invested roughly $1.4 billion in additional capital expenditure, marking almost half its earmarked budget. About $1.3 billion was invested in networks and $100 million on digitisation.
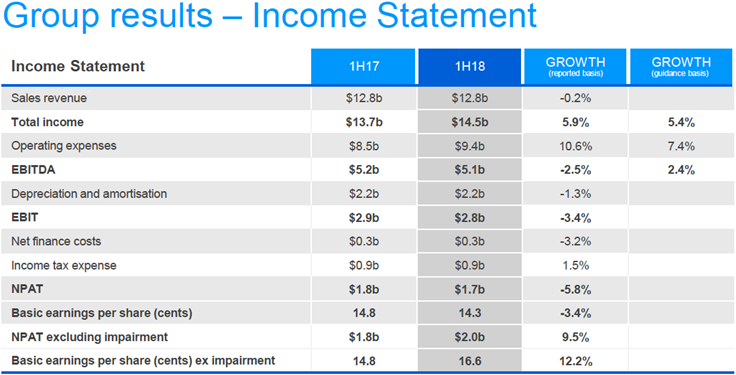
Moving on down the income statement and net profit after tax (NPAT) in 1H18 came in at $1,682 million. That marked a 5.8% decline from a year earlier, as the costs associated with NBN and an earlier flagged impairment charge related to the Ooyala business weighed on the bottom line. Basic earnings per share edged down 3.4% to 14.3 cents.
The interim dividend of 11 cents per share was in line with Telstra’s guidance after it earlier announced a cut to its dividend at the time of its full year results in August 2017.The 1H18 dividend is comprised of an ordinary dividend of 7.5 cents per share and a special dividend of 3.5 cents per share, consistent with its revised dividend policy, albeit at the lower end of the range.
To recap, last year Telstra (ASX:TLS) moved away from the 100% pay-out ratio to a range of between 70-90%. At the same time as part of its capital allocation strategy review, Telstra said it intended to return a percentage of net one-off NBN receipts to shareholders via fully-franked special dividends.
The 1H18 interim ordinary dividend represents a 71% pay-out ratio on underlying earnings excluding impairments and the special dividend marks a 58% pay-out ratio on the net one-off NBN receipts in the interim period.
We note that excluding the Ooyala impairment charge, Telstra’s net profit result would have look a lot better and increased from a year earlier.
In February, Telstra (ASX:TLS) flagged that it was writing down the value of the US-based video platform business to zero, resulting in a non-cash $273 million impairment charge in the 1H18 results. Excluding this impairment NPAT was up 9.5% and basic earnings per share increased 12.2%.
Source: Telstra (ASX:TLS)
Looking at how the key mobile business fared in the first half of the fiscal year and it is doing well in the face of tough competition. As touched on earlier, revenue edged up 0.8% year-on-year to $5,082 million. The segment margin contracted by 1 percentage point due to some one-offs and post-paid handheld ARPU (average revenue per user) declines, but remained robust at 40%.
Churn rates fell, and at 10.9% Telstra’s churn rate is far superior to the industry average of about 18%. During the half year Telstra added 235,000 retail mobile services bringing the total to approximately 17.6 million. The additions included 130,000 post-paid subscribers, of which 21,000 were attributed to Belong mobile. 118,000 wholesale mobile services were also added during the period. In the face of stiff competition Telstra has now grown its mobile customer base for 20 straight halves and certainly has a strong brand.
We believe this positions the company well for the upcoming shift to 5G, of which CEO Andrew Penn noted, “When there’s been a new ‘G’, that has been followed by growth industry revenues as customers have taken advantage of more capacity and more speed…It’s not unreasonable to think that will be the case with 5G.“
Outlook
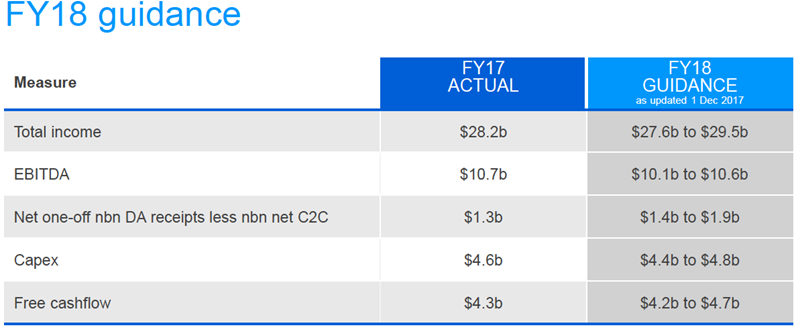
Telstra (ASX:TLS) reaffirmed its full year guidance for revenue (total income) of $27.6 billion to $29.5 billion and EBITDA of $10.1 billion to $10.6 billion. EBITDA guidance includes the impact of absorbing incremental restructuring costs of $200 million to $300 million.
Source: Telstra (ASX:TLS)
The dividend for the full year is also still forecast to be 22 cents per share. We note that when Telstra announced the combining of Foxtel and Fox Sports Australia into a new company in March 2018, Telstra said the new company will be equity accounted for on an ongoing basis. At the time, Telstra expected to record a one-off accounting gain of $263 million (a similar quantum to the size of the Ooyala impairment in 1H18) as a result of the fair value of the company compared with book value.
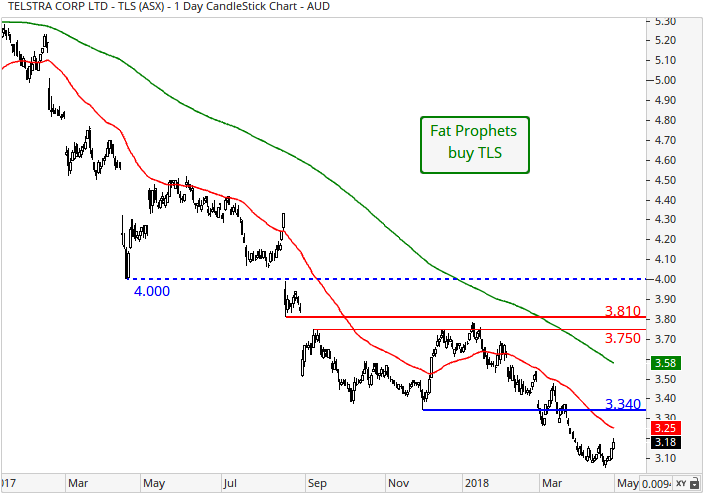
Turning to the charts, the picture is clearly weak. Dynamic support sighted at the 50-day moving average (red line) of $3.55 has given way, as has that at $3.34. In order for the short-term technical outlook to strengthen, these need to be surmounted, and a decisive break above our aforementioned resistance range between $3.75 and $3.81 is required. Should this occur, then an eventual glide towards the psychological $4.00 level is deemed feasible.
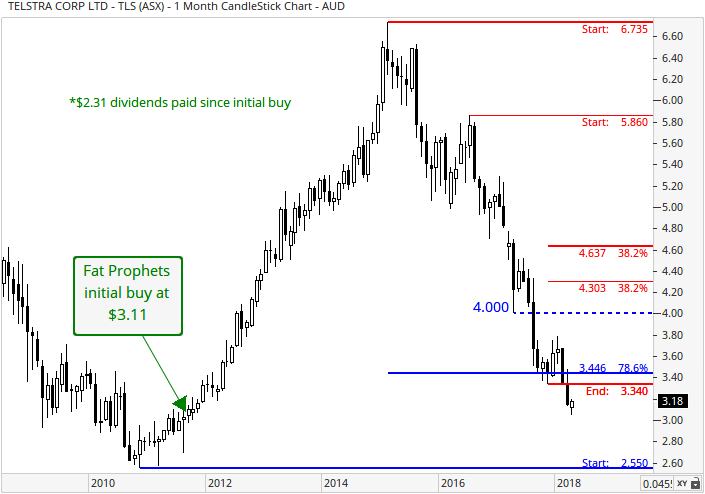
With reference to Telstra’s monthly chart, support at the 78.6% Fibonacci retracement of $3.45 (blue set of retracements) has not held. The next significant layer of support is at $2.55. The dominant long-term downtrend remains in play, and therefore, the climb north could be slow in coming.
Summary
The scale of Telstra’s dividend cut late last year has seen an exodus of investors attracted by one of the highest dividend yields on the Australian stock exchange. While the scale of the dividend cut was a major disappointment, we believe management have been overly cautious with respect to the medium-term outlook. At the current valuation, the stock is pricing in very low market expectations and, in our view, there is room for upside surprise going forward.
The shares are currently trading on an undemanding 10.7 times forecast FY18 earnings, falling to 10.4 times the following year. Meanwhile, the projected yield is 6.9% and a lot of water needs to go under the bridge before any potential changes to franking credits become a reality.
Telstra (ASX:TLS) is doing well in mobile, with a strong brand and should be a beneficiary of the upcoming shift to 5G technology. The cost-out performance in the first half of fiscal 2018 was ahead of plan and impressive, with core fixed costs lowered by 7%. The company is also investing in strategic initiatives to try and plug the looming NBN earnings hole and some benefits from this are flowing through, although we expect a more meaningful impact is some way off. Still, modest improvements are likely to be well received.
We maintain a buy recommendation for Members without exposure and who have a medium to long-term horizon.
Disclosure: Telstra (ASX:TLS) is held within the Fat Prophets Concentrated Australian Share and Australian Share Income Models.
Fat Prophets has made every effort to ensure the reliability of the views and recommendations expressed in the reports published on its websites. Fat Prophets research is based upon information known to us or which was obtained from sources which we believed to be reliable and accurate at time of publication. However, like the markets, we are not perfect. This report is prepared for general information only, and as such, the specific needs, investment objectives or financial situation of any particular user have not been taken into consideration. Individuals should therefore discuss, with their financial planner or advisor, the merits of each recommendation for their own specific circumstances and realise that not all investments will be appropriate for all subscribers. To the extent permitted by law, Fat Prophets and its employees, agents and authorised representatives exclude all liability for any loss or damage (including indirect, special, or consequential loss or damage) arising from the use of, or reliance on, any information within the report whether or not caused by any negligent act or omission. If the law prohibits the exclusion of such liability, Fat Prophets hereby limits its liability, to the extent permitted by law, to the resupply of the said information or the cost of the said resupply.
Funds Management – In addition to the listed funds FPC, FPP and FATP, Fat Prophets Pty Ltd manages the separately managed accounts, namely Concentrated Australian Shares, Australian Shares Income, Small Midcap, Global Opportunities, Mining & resources, Asian Share, European Share and North American Share. These SMAs are managed under their own mandates by the fund managers, and this is independent to the research reports.
Staff trading – Fat Prophets Pty Ltd, its directors, employees and associates of Fat Prophets may hold interests in many ASX-listed Australian companies which may or may not be mentioned or recommended in the Fat Prophets newsletter. These positions may change at any time, without notice. To manage the conflict between personal dealing and newsletter recommendations the directors, employees, and associates of Fat Prophets Pty Ltd cannot knowingly trade in a stock 48 hours either side of a buy or sell recommendation being made in the Fat Prophets newsletter. Staff trades are pre-approved by an appointed staff trading compliance officer to ensure compliance with the staff trading policy.
For positions that directors and/or associates of the Fat Prophets group of companies currently hold in, please click here.
