
Some Ups and Downs
Despite facing some recent headwinds and being on somewhat of a rollercoaster ride over the past year, Suncorp Group (ASX, SUN) shares remain modestly higher today than a year ago and the shares also provide an attractive dividend yield. Given a reasonable valuation, solid dividend, a higher yield curve likely around the corner and a positive view on Suncorp’s ‘home’ market we continue to be favourably disposed towards the group.
Going forward, we remain constructive on Suncorp’s medium to longer-term growth prospects, especially on the back of medium-to-long term rising yields (in Australia as well as globally) and management’s successful efforts to keep costs contained. The new customer-focussed model from the diversified financial services player should deliver benefits to shareholders from cross-selling and increased “wallet share.”
The ‘Suncorp Marketplace’

Source: Suncorp FY17 review
Natural hazard update
Suncorp shares have taken a modest knock in January 2018 after providing an update on the financial impact of natural hazard events in the six months to 31 December 2017. The hailstorm in Melbourne, the insurer flagged up to a $170 million impact alone, saying it expected to receive more than 21,000 claims across its insurance brands including, AAMI, GIO, Suncorp, Apia, Bingle and Shannons. Most claims are expected to be linked to home and motor vehicle damage.
For the six months ended 31 December 2017, total natural hazard claim costs (covering both Australia and New Zealand) are estimated by the company to be in the range of $406-416 million, which is $60-70 million above the insurers allowance for the 1H18 period. The breakdown is provided in the table below:

Source: Suncorp
The company’s allowance for natural hazards claims in the second half of the year is $346 million. Suncorp added that it remains well protected against further natural hazard events, as in addition to the main catastrophe program, Suncorp has Natural Hazard Aggregate Protection in place for fiscal 2018. The latter provides $300 million of cover once the retained portion of natural hazard events greater than $10 million exceeds a total of $475 million. At the end of 2017, Suncorp estimated between $259 million and $269 million of the deductible had been eroded.
No traction yet on the M&A front
Last year we wrote how Suncorp management had expressed their plans of growing their CTP (compulsory third party) business in New Zealand, specifically from the personal lines. CTP growth has been strong in recent years as has been driven by subdued investment income which is often passed through in higher premiums given that it is a regulated sector. The area also has positive prospects.
As part of this push, Suncorp sought to acquire New Zealand insurer Tower Ltd., a predominantly personal lines insurer with a market share of circa 6%. Aside from the market share benefit it would have provided alongside Suncorp’s Vero subsidiary, we wrote in our prior coverage that Tower’s expense ratio seemed attractive. If Suncorp had been able to pull off the deal, it should have been earnings accretive after synergies and given Vero/Suncorp about 30% of the tightly held New Zealand market.
The deal was scuppered by New Zealand’s regulator, the Commerce Commission, which said the merger would harm competition in home and car insurance. Suncorp initially appealed against the decision, but later decided to withdraw its appeal, effectively ending the chase. Suncorp said it is now “focused on maximising the value of its Tower shareholding.” As part of the takeover bid, Suncorp built up a 19.99% stake in Tower.
The Tower acquisition would have been a solid one in our view, so this was a modest setback. There has also been no deal inked to sell Suncorp’s life insurance arm, which was reportedly being circled by offshore financial groups late last year. Given the challenges in the Australian life insurance market, it is likely Suncorp is still pursuing a sale, however, the sticking point is likely a price the seller and buyer can agree on.
FY17 Headline Numbers
Suncorp reported a 3.6% year-on-year increase in net profit after tax (NPAT) to $1,075 million in FY17, in line with the Group’s top line growth of 3.6% A substantial increase in the profitability of the Australian Insurance business offset lower profits at Banking and Wealth and in New Zealand Insurance, with the latter impacted by claims costs associated with the Kaikoura earthquake and additional claims from the older Christchurch earthquake.
Suncorp’s cash earnings increased 5.1% to $1,145 million.
Suncorp’s higher earnings enabled the Board to declare a final (fully franked) dividend of 40 cents per share, taking the total dividends for the year to 73 cents per share, up 7.4% from FY16. That represented a dividend payout ratio of 81.9% of cash earnings, slightly above the top end of the 60% to 80% targeted payout range.

Source: Suncorp
After accounting for the final dividend, Suncorp said the excess capital position was $377 million. The Bank’s Common Equity Tier 1 (CET1) ratio of 9.23% was above the target operating range of 8.5% to 9.0% and the General Insurance CET1 position of 1.32 times the PCA (Prescribed Capital Amount) was also above the top end of its target range.
Looking at each key business briefly, Insurance (Australia) provided the growth for the group, with NPAT surging 29.6% from last year to $723 million. This was driven by a 40.6% surge in General Insurance profit to $689 million, more than offsetting a halving in Life Insurance profit to $34 million. The underlying profit for Life Insurance was effectively stable at $53 million though, with the decrease in reported profit due to the revaluation of deferred acquisition costs as bond yields increased.
Insurance (Australia) results:

Source: Suncorp
General Insurance benefited from continued top line growth and lower claims expense. Gross written premiums (GWP) up 3.9% year-on-year, following strong growth in New South Wales CTP, the successful entry into the South Australian CTP scheme and premium increases in home and motor products. Commercial GWP was relatively weak though, declining 2.2%. The segment delivered a strong Insurance Trading Result (ITR) of $912 million, up 47.3% year-on-year and representing a reported insurance trading ratio of 12.9%.
Banking and Wealth
NPAT of $400 million marked a 4.3% decrease from $418 million in FY16. The decline was due to a weaker result from Wealth, which saw profits slump 84% to $4 million. This reflected the cost of completing the Super Simplification Program and lower investment returns. Funds under management and administration were flattish (+0.8%).
The Bank fared better, with NPAT edging upwards 0.8% year-on-year to $396 million for FY17. Total lending was up 1.9% in a subdued environment, with an improved performance in the second half of the year across both retail and business lending.

Source: Suncorp
Net interest income of $1,131 million represented a marginal (+0.2%) increase, reflecting the low interest rate environment. The Net Interest Margin (NIM) was 1.83%, compared to 1.86% in FY16. The cost to income ratio worsened slightly, moving from 52.5% in FY16 to 52.7% in FY17. The Bank has some work to do to get the cost-to-income ratio below the targeted 50% level. We do believe Suncorp’s banking division is well placed to do well going forward due to the regulatory and other pressures on the major banks.
Finally, the New Zealand Insurance segment saw its NPAT slide 56.5% percent from the previous corresponding period to $87 million, despite growth in GWP at General Insurance and in-force growth in Life.
GWP for the general insurance expanded 6.3% year-on-year, driven by increases in home and motor portfolios. The Kaikoura earthquake had a net impact of $36 million, after considering claims costs and the expense of the reinsurance reinstatement. Additional claims from the older Christchurch earthquake also played a role, but there was no deterioration in the ultimate exposure for Suncorp.

Turning to the technical picture, and with reference to the monthly chart, prices have entered a corrective phase of the overall technical cycle after printing a recent high of $15.24 in July 2017 as shown by the horizontal solid-red line. Should the bears maintain control over the near term, then a confluence of support is indicated at the $12.43 region. This is made up of the September 2017 low (horizontal blue line) and the long-term uptrend line (upward sloping green line). In order for the long-term uptrend to resume its upward trajectory, a decisive clearance of resistance located between $14.59 and $15.24 is required. This is made up of the 61.8% Fibonacci retracement and the aforementioned July 2017 high (horizontal solid-red line) respectively. In the grand scheme of things, the series of higher lows and higher highs are characteristics of a dominant broader-term uptrend in play, and thus would likely steer the prevailing direction of Suncorp.
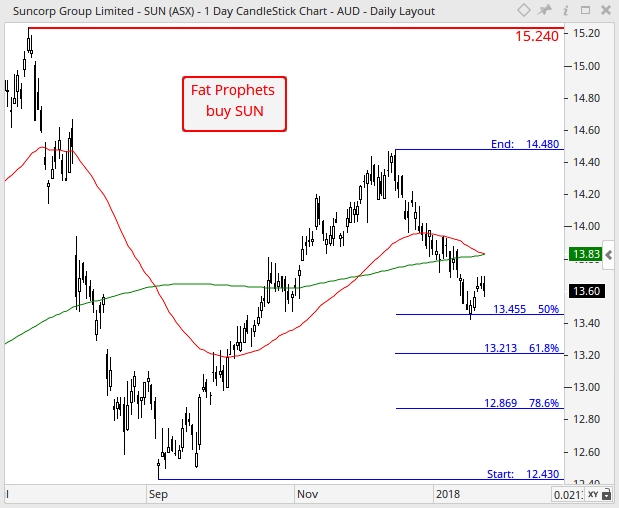
Turning to the daily chart, initial downside support is sighted at the 50% Fibonacci retracement of $13.46, followed by the 61.8% Fibonacci retracement of $13.21 if the bears were to maintain downward pressure. In order for a broader bullish rotation to evolve, a sustained break above the $13.83 level is required. This consist of both the 50 (red line) and 200 (green line) day moving averages. Should this favourable scenario come to fruition, then medium-term upward momentum would then be confirmed to have shifted north. In-turn, this would increase the probability of an eventual retest of the December 2017 high of $14.48.
Summary
Going forward, we remain constructive on Suncorp’s medium to longer-term growth prospects, especially on the back of medium-to-long term rising yields (in Australia as well as globally) and management’s successful efforts to keep costs contained. The new customer-focussed model from the diversified financial services player should deliver benefits to shareholders from cross-selling and increased “wallet share.”
Management’s recent initiatives to reduce risk, improve claims processing, and reduce operating costs have flowed through well in Australia. On the valuation front Suncorp looks reasonable, trading on approximately 15.3 times FY18 earnings with a dividend yield of 5.6%.
Accordingly, Suncorp Group will remain held in the Fat Prophets Portfolio. We recommend the shares as a buy for Members without exposure, and who are also prepared to take a medium to longer term view.
Disclosure: Suncorp is held in the Fat Prophets Income Model.

