
The correction in stock markets I have looked for in October has proven elusive in what has been a choppy month. International equity markets have corrected, and the lows are potentially in for Asian markets. China/Hong Kong stocks could soon resume an upward trajectory if a trade deal is reached with the US. Japanese markets lifted strongly yesterday on signs that political uncertainty around the recent election could soon be resolved. Aside from some bouts of volatility in the US, key benchmarks have resumed upwards, defying a nearly unanimous call amongst leading Wall Street strategists of a corrective selloff.
Deutsche Bank strategists noted that overall equity positioning tumbled last week and sentiment fell to net bearish. Many instos who have been sitting on plenty of cash are positioned to buy into any October weakness – but this has yet to really emerge. Morgan Stanley’s Michael Wilson also remains cautious near term and said there needs to be follow-through on a US-China deal and stability in earnings revisions to clear the risk of a further correction in stocks.
However, JPMorgan strategist Mislav Matejka said this week that “activity momentum” improved during the quarter and positive surprises are likely this earnings season. The tech sector could therefore surprise on the upside this week, with earnings, as could a breakthrough on the US/China trade dispute. There is a chance we have already passed through the eye of the storm as it relates to seasonal October weakness.
With the VIX still elevated at around 19, many institutional investors and hedge funds have hedged out downside risks and have prepared for a sell-off – but this has yet to really materialise. We have seen typical seasonal volatility in October, but the recent swings have been relatively shallow by historical standards. The “buy-the-dip” mentality appears to be in full swing with retail investors leaning heavily into any weakness. The market seems to be looking ahead and through an earnings season that so far has delivered solid results, but also an easier monetary policy from the Fed. We remain close to fully invested across our investment portfolios – and I would not want to be short these markets.
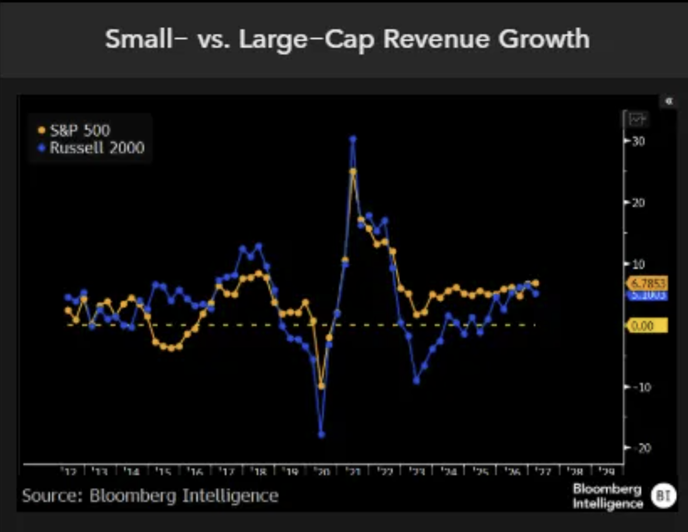
I would also add that the small/midcap-laden Russell 2000 is reasserting on the topside. After a multi-year consolidation, the RUT is finally confirming a breakout and sustaining upward momentum to new record highs.

Consensus estimates on Wall Street point to a big jump in earnings in this reporting season. Third-quarter earnings growth could prove decisive.
If volatility does emerge in the coming weeks, the underlying backdrop remains solid for equities and risk assets. Therefore, any market weakness will likely get aggressively bought despite near-term cautiousness from most institutional investors (many of which are still holding too much cash from the April drawdown). Retail investors have already demonstrated a willingness to buy on any drawdown and continue to lean into the market. The bottom line is that the bull market is likely to roll on over the coming year. Global stock markets, including the US, are setting up for a strong finish into year-end (which was our base case). I also see weakness ahead for the US dollar, which could break down below key technical supports in the coming months as rate cuts are delivered.
According to a Bloomberg survey, consensus economist forecasts for the core CPI, which excludes food and fuel for a better snapshot of underlying inflation, to have climbed 0.3% for a third straight month as higher import duties continue to gradually filter through to consumers. The projected monthly gain will keep the annual core CPI at 3.1%. This is still very elevated, but lower oil prices might act as a circuit breaker against future prints.
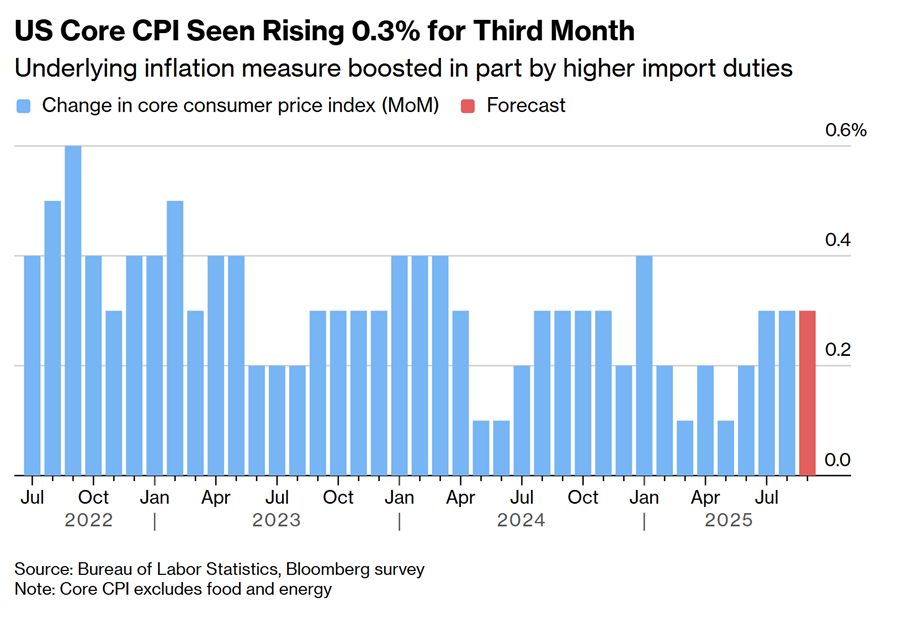
Still, with annualised inflation running at over 3% in the US, real adjusted returns on the dollar are going to come down. This will narrow sharply the rate differentials between the US and RoW, as the Fed cuts in the months ahead. I continue to see further systemic weakness in the greenback into year-end.
Moving on, if our view on a weaker dollar plays out next year, emerging markets, and notably China/Hong Kong, could deliver another stellar performance. The bull market is stirring following more than a decade of underperformance relative to the US. Near-term trade dispute risks aside, this has been one of our top calls for this year, and will likely make the Baker’s Dozen list in December. Next year in the Chinese Zodiac is known as the “Fire Horse”.
The Year of the Fire Horse, which next arrives in 2026, holds deep historical and cultural symbolism in China and Hong Kong that can subtly influence investor sentiment and market psychology. In Chinese astrology, the Horse represents momentum, independence, and dynamism — traits often interpreted according to Perplexity “as signs of economic and market vitality. When combined with the element Fire, which symbolises energy, assertiveness, and transformation, the resulting Fire Horse year is considered highly active and volatile. Culturally, this combination embodies both great potential and risk — a year of bold moves and rapid change, but also one prone to sudden corrections.”
This perception tends to shape investor psychology in Hong Kong and mainland China, often leading to larger trading volumes, higher volatility, and stronger momentum in growth sectors, particularly in the first half of the Fire Horse year. Investors are generally more aggressive in such years, reflecting the fiery theme of expansion and risk-taking. I think when combined with building underlying momentum in China’s economy, and the positive impact overlay of AI, key benchmarks, including the CSI300 and Hang Seng, could end next year above the historic record highs.
Looking historically, previous Horse years (including 1978, 1990, 2002, and 2014) have produced “wild rides” in the Hang Seng Index. For instance, the Hang Seng rose 35% in 1978 and 15% in 1990, both Horse years, amid bursts of optimism following economic liberalisation phases. In 2002, the index fell 13%, correlating with the global tech unwind and SARS outbreak.
But according to a weekend update from Goldman Sachs, “emerging market (EMs) equities are expected to rally over the next 12 months, driven by earnings upgrades, demand for geographical diversification, and anticipated interest rate cuts from the Fed, along with a weaker dollar.” This has been my view for some time, and the outperformance we have seen in key EMs, including China/Hong Kong, could continue well into next year as a new early-stage bull market gets underway.
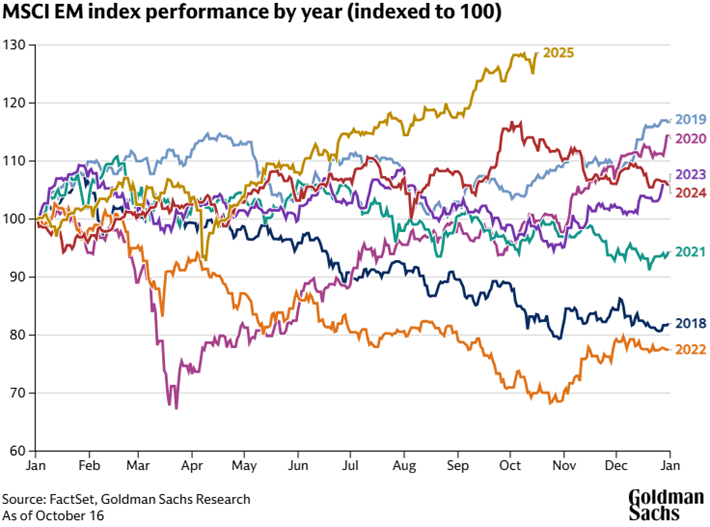
Goldman noted that “the MSCI EM index has risen for nine straight months, buoyed by AI optimism and strong buying from foreign investors. We think the EM equity rally can extend, as macro trends and capital inflows remain supportive.” I concur with this view – and dollar weakness could provide abundant liquidity conditions for EMs next year.
This year, EMs have already had their best performance in seven years, which points to gathering bull market momentum with the gap closing for the first time in over a decade relative to the US.
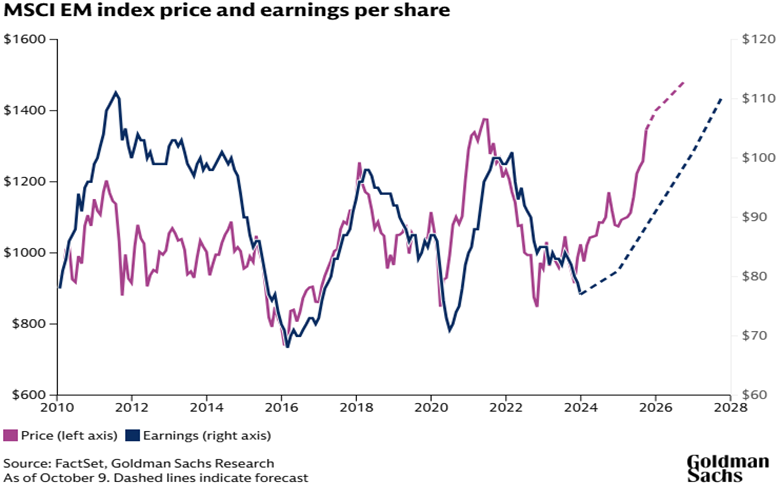
On this front, Goldman Sachs raised its forecast for the MSCI EM index of large- and medium-sized companies across emerging markets. Goldman expects “the index to reach 1,480 over the next 12 months, up from 1,378 as of October 16.
Company earnings—which are expected to be the key driver of market returns in the near term—are forecast to grow 9% this year and 14% in 2026. Continued weakening of the dollar and potential easing of monetary policy in some EM countries could also boost flows into EM stocks.”
Goldman emphasised that “Chinese and South Korean equities—which have already performed well in 2025—are particularly well-positioned for growth, as both markets offer exposure to the AI/tech theme. Ongoing reforms to the way companies are governed in South Korea could also drive up stocks, as could Chinese efforts to address disorderly price cutting and excessive competition among producers.”
I concur with Goldman’s and would add that China/Hong Kong has only recently exited what was a severe bear market. AI and tech dominate China’s economy in a similar vein to the US and are unrivalled elsewhere in the world. Yet valuations are still cheap relatively despite accelerating earnings in the tech sector. Many stocks, including bellwether tech leader Alibaba, remain well down on peak highs four years ago. The catch-up potential is clear to me, given the growth runway and also as China’s economy stabilises and consumers commence spending again.
JP Morgan noted this week that China will soon enter a “policy-intensive fourth quarter, with the 15th Five-Year Plan (2026-2030) outline to be discussed at the 4th Plenum in October. While likely supply-side focuses, eg AI, robotics and advanced manufacturing, have been well-captured themes this year, we highlight anti-involution and service consumption opportunities as additional thematic optionality.”
Another factor we have highlighted this year is the huge amount of cash and liquidity that Chinese consumers hold in savings accounts – around $18 trillion. The potential for the economy if these savings are unleashed is significant in my view.
JPM said this week that “overall, we stay positive on CSI-300 through end-2026 with household asset allocation shift to stocks supporting P/E expansion, and while potential downward revisions in consensus estimates for 2025 EPS and US-China talks may add volatility approaching year-end, we believe anti-involution and modest fiscal supports by the central government may help to stabilize market expectations [around earnings] for the CSI300…We stay positive on CSI-300 in the medium-term (through end-2026), believing the rally can be sustained by the ongoing household asset allocation shift into equities.”
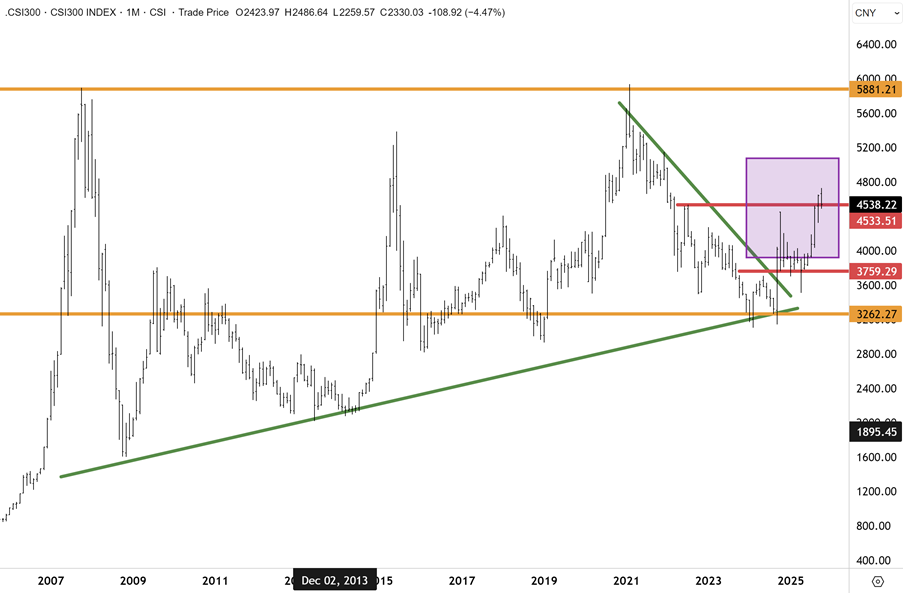
The bull market in China mainland and Hong Kong equities has really only just begun. With respect to the CSI300, the index remains well down on peak levels seen back in 2007 and in 2021, just before the economic downturn and bursting of the Chinese property bubble. The bull market likely has much further to go, and I have conviction that the record highs near 6,000 will be retested within 18 months.
Corrections are inevitable
This week’s continued selloff in gold and the PGMs is not surprising. Bull markets never continuously run in a linear direction – and corrections are inevitable. A correction is now underway in the PGMs as foreshadowed on Monday following Friday’s sharp reversal. A confluence of factors has combined to instigate profit taking, including positive trade talks between China and the US, a stronger dollar, overbought conditions and stretched technicals, along with the end of a seasonal buying spree in India.
Gold’s rally in recent months has been the most extraordinary run since the 1970s, culminating in long queues outside physical bullion trading outlets in Sydney and other major cities. This is perhaps one of the clearest signs that market conditions are becoming frothy and overbought. However, as discussed on Monday, I don’t see the bull market ending in this cycle. However, near term, I would expect gold and PGM prices to further correct lower and then enter a consolidation phase that could ensue for several months as overbought conditions are worked off.
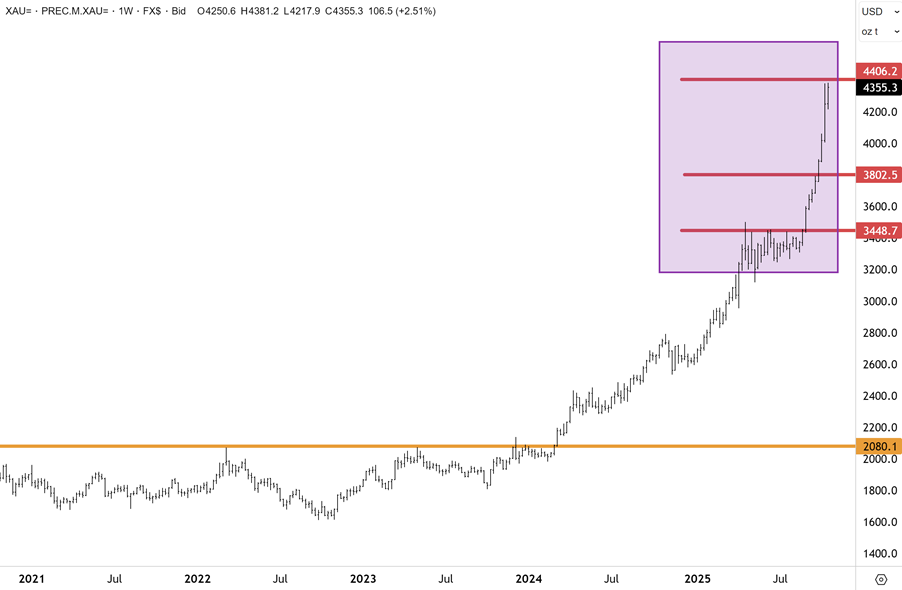
Gold has incurred a steep reversal after encountering heavy overhead resistance at $4,400oz. The acute phase of the correction is now underway, and near-term volatility is going to be high in the coming days and skewed to the downside. Key supports reside at $4000oz, $3800oz and $3,500. Once the acute phase of the volatility has cleared (likely in the coming weeks), I would expect gold to find support at one of the key supports highlighted above and then consolidate for a period, much akin to the phase we saw play out following the April spike. The bottom line is that, near-term correction risks aside, gold’s bull market is not over in my view, and has potentially years to fully play out.
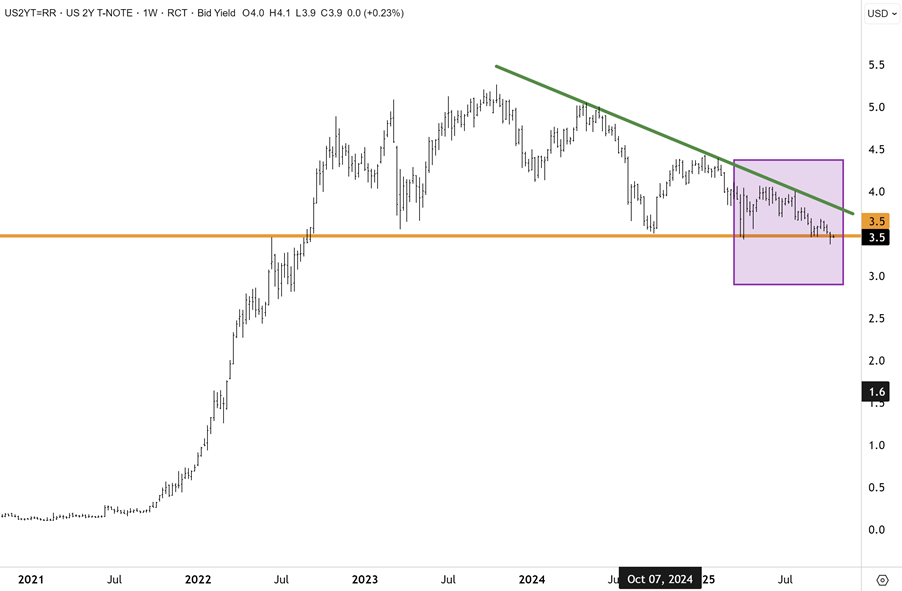
Markets rarely move in straight lines, and it is far too early to exit the bull market in precious metals bull market. We have conviction that the downward trend in the US dollar will emerge once the Fed commences easing, and real rates (undermined by elevated US inflation) will decline sharply into December and in 2026. This is the clear signal being sent by the US bond market, with yields now at the lowest level since 2022.
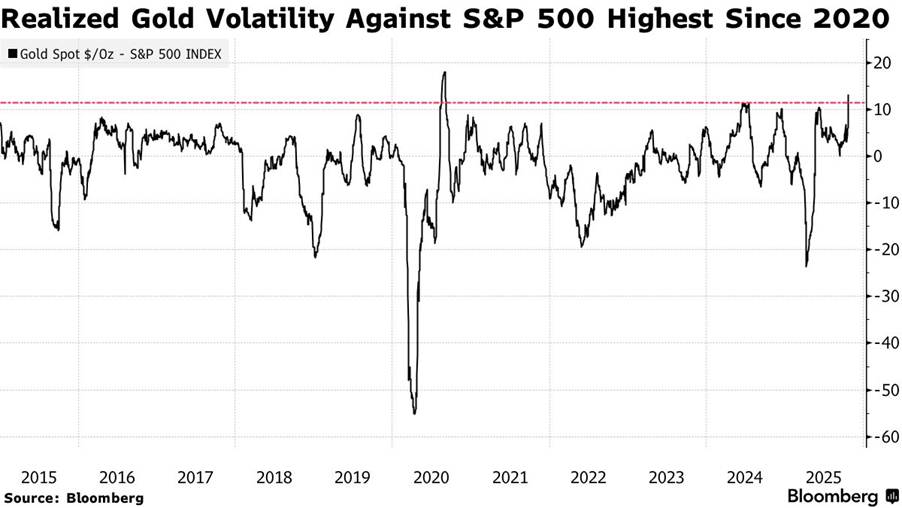
Corrections are normal, and it is worth highlighting that many global investors missed out on the big rally. Precious metals remain acutely underrepresented in most global portfolios. And I would add, for most global central banks. At some point soon, buyers can be expected to step in and “buy the dip”, but we are likely not at that point just yet. The correction likely has further to go, and when realised, gold volatility falls back below 0 and towards -10, then this could indicate the correction is bottoming out.
The shutdown of India has also impacted gold and silver prices. India is the second-largest global buyer of gold, but is now shut down for the Diwali festival, which has also drained the market of significant liquidity. In the silver market, a historic squeeze in London last week drove prices beyond the record set in 1980, during a notorious attempt by the Hunt brothers to corner the market. Benchmark prices traded above New York futures, prompting traders to ship metal to the UK capital to ease tightness.
On Tuesday, the squeeze showed signs of easing with silver in vaults linked to the Shanghai futures exchange having the biggest one-day outflow of silver metal since February, while New York stockpiles have also fallen. This has alleviated some of the pressure from inventory shortages. Aside from buying in India, there have been significant flows into physical gold and silver ETFs.
Holdings within physically backed gold exchange-traded funds recorded a massive fund inflow of $8 billion last week, the biggest weekly inflow in data going back to 2018, according to data from the World Gold Council. These flows are likely to slow amidst the incumbent correction, which will also help alleviate pressure on low exchange inventories.
As discussed above, the correction in gold and PGMs has further to go in my view. The good news is that the acute phase in any corrective selloff typically commences at the onset. As prices correct, lower volatility could soon drop as selling pressure eases. I would expect a floor to be found in the coming months and for the pace of declines to quickly taper off following the initial move lower.
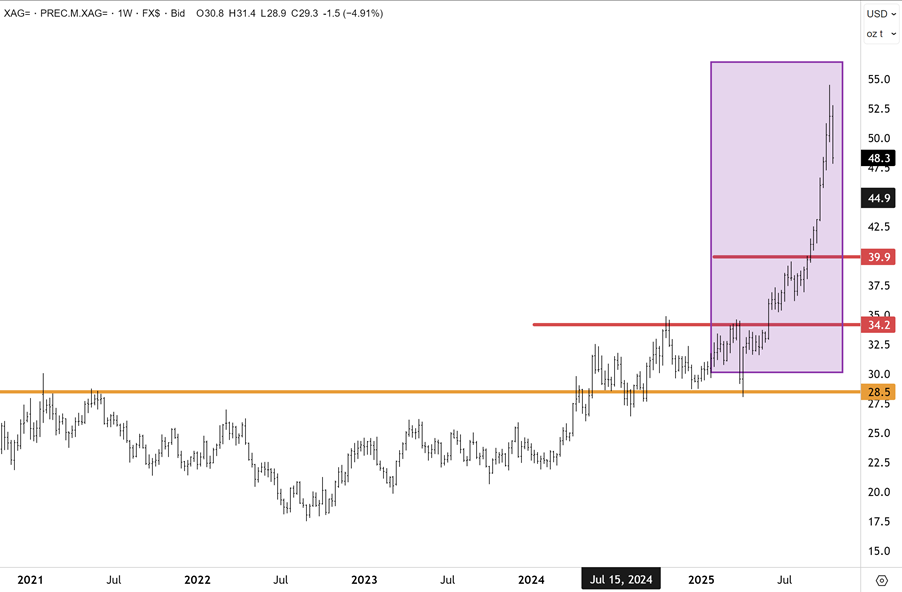
In terms of silver, the blowoff top brought on by the biggest squeeze since the 1970s has led to a sharp reversal. Key supports reside at $40 and then at the important breakout level at $34.20. These are not price targets, but key technical support levels for silver. As discussed above, I would expect that after the initial acute phase of the correction passes, the pace of declines will dissipate quickly. A period of consolidation could then endure for several months as overbought conditions are worked off. A bull market is underway in gold and the PGMs, and this cycle has much further to play out in my opinion in the years ahead.
On Monday, I also discussed oil prices and the likely OPEC+ strategy that is behind the supply glut weakening energy markets. OPEC+ are flooding the market to drive out the high-cost marginal producers and shut down new exploration, intending to regain market share and ultimately pricing power. This is a boon for the global economy over the short to medium term, and will remove inflationary pressure.
This seems to be a clear signal being sent by the US bond market, where the US2yr yield has fallen to the lowest level since 2022. The yield on the US2yr looks to be on the cusp of another decline below 3.5%. However, technically, this needs to be confirmed by a decisive, sustained move below this level. Much will come down to the Fed decision next week, and guidance on future rate cuts with the dot plot, etc. Lower oil prices are going to be influential in terms of placing downward pressure on inflation, as is the job market, which was showing signs of deterioration in the US before the data blackout.
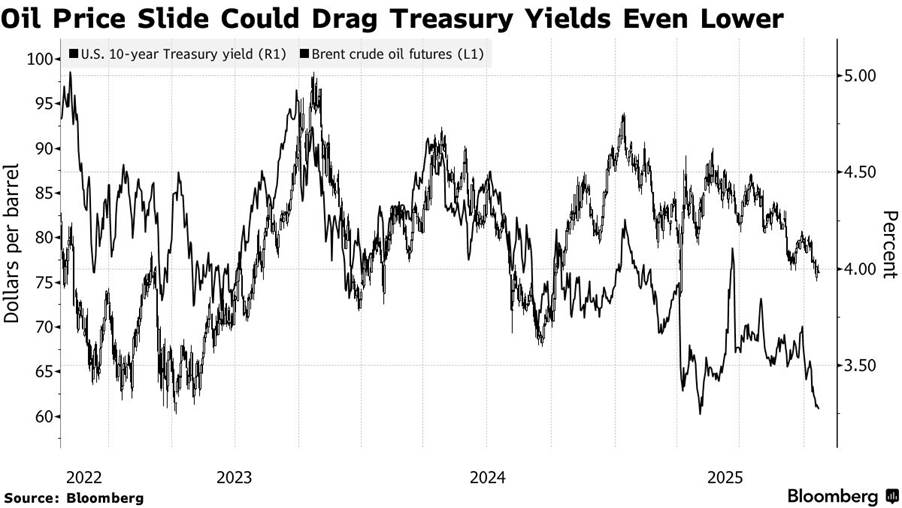
Veteran economist and strategist Ed Yardeni shares this view. This week, he cited that falling oil prices may drive benchmark Treasury yields [at the long end of the curve] back to levels last seen more than a year ago. Mr Yardeni sees the US10yr sliding to 3.75% if the oil price continues to slide and the Federal Reserve lowers interest rates next week. His argument is based on the long-run correlation of the two asset classes, which are linked through oil’s impact on inflation.
Mr Yardeni noted that “a growing glut of oil and fear of a global economic slowdown have pushed US WTI crude prices to their lowest point since fuel markets were rebounding from the Covid crash. That will help push headline consumer inflation rates down and boost consumers’ purchasing power.”
In Australia, investor enthusiasm centred on Canberra and Washington’s chunky critical metals agreement. The deal positions Australia as a strategic supplier for the American technology and defence industries, seeking to counter China’s rare earths market dominance. Prime Minister Anthony Albanese described the deal as a step-change for Australia’s resources sector, targeting faster investment flows into projects that can shift the balance of supply chains and said the framework encompasses a circa US$8.5 billion (A$13 billion) pipeline of “ready-to-go” projects.
The agreement includes an initial $1 billion to be invested by both countries in new ventures across the US and Australia within the next six months. The initiative is designed to boost mining and, crucially, downstream processing capacity, long dominated by China, which currently accounts for about 70% of global rare earths mining and 90% of processing.
Mr Albanese emphasised that the latest agreement builds on years of bilateral talks but would “take the partnership to the next level”. Washington echoed this, with the Trump administration confirming its support despite a recent policy review that briefly cast doubt over Australia’s plans to acquire US-made submarines under the Aukus defence pact. In another positive, Trump sought to allay concerns, insisting that Australia’s submarine deal remained on track and that the subs could be delivered on a faster timeline.
Beyond the headline funding, the partnership covers joint efforts on permitting and pricing rules, as well as coordinated reviews of sector takeovers – a nod to the ongoing competition for global assets. The US also detailed a direct investment in a 100-tonne p.a. gallium refinery to be built in Western Australia and outlined plans to channel up to $2.2 billion in new financing for minerals projects through the Export-Import Bank. Recent US moves have included investments in MP Materials and Canadian firms with American projects, often in exchange for equity stakes to secure future supply.
Despite a rich resource base, Australia, like the US, remains heavily reliant on Chinese processing, a strategic vulnerability that has become acute as Beijing tightens export restrictions in response to rising trade tensions and tariffs. Both governments have acknowledged that fully breaking China’s grip will require not just new mines but a broader build-out of local refining and manufacturing capabilities.
For investors, the main takeaways are a firmer policy signal that critical minerals supply chains are being re-wired in favour of trusted partners and, in the near term, a surge in capital flows that should benefit established and emerging players across the Australian sector. The challenge now will be execution.
Carpe Diem
Sign up to receive full reports for
the best stocks in 2025!
Where to Invest in 2025?
The market is full of opportunities—but which stocks will deliver real wealth-building potential?
At Fat Prophets, our expert analysts uncover the best Australian and global stocks to help you stay ahead of the curve. Whether you’re looking for growth, income, or diversification, our carefully curated portfolio gives you access to high-conviction stock recommendations backed by deep research and proven insights.
Subscribe now to get full reports of these stocks and get ready for the next big opportunities!
Over 25,000 customers worldwide
Need a try? You’re first-time customer?
Enjoy our Welcome Gift with $500 OFF your Membership
Use code: FPWELCOME
FAQ’s
How much does a Membership cost?
We have a number of Membership options for the DIY investor. Our research services cover individual stock opportunities in Australia, as well as the UK, global markets, and a sector-specific report focussing on the mining space. Annual Membership prices start at $1395.
Do you offer execution services?
No we do not, and our research is independent in the sense that we are not conflicted by operating broking services alongside them. We also do not offer ‘sponsored research’ and are not financially incentivised by any of the companies that we recommend to Members.
Can I access any special offers?
Our introductory joining offers relate only to new Members. We do however offer ‘early bird’ discounts to existing Members who renew in advance of their Membership expiring.
Can I get tailored financial advice?
Our research products are ‘general advice’ in nature only, however we do categorise all our recommendations by the level of risk appetite which we believe is involved. Members looking for more direct advice can also make an inquiry to our wealth management team which offers a separately managed accounts service.
Do you offer a Money-Back guarantee?
Yes we do. Fat Prophets offers a 100% money back guarantee on annual subscriptions within 30 days of taking out a Membership.