Pushback
While the dollar received a boost from the FOMC meeting with a shadow cast over the December cut that had been priced in, my longstanding view that the DXY could meaningfully decline over the coming year remains in place. Near term, the dollar could continue to rally given the now greater uncertainty around the aggressive easing path of four to five additional rate cuts and a terminal rate of 3% that had been priced in by the end of 2026.
Morgan Stanley updated their bearish view on the US dollar this week and emphasised that “drivers including our real rates USD framework, growth and rate differentials, policy risks, hedging dynamics, fiscal concerns abroad, and USD positioning’ would weigh on the dollar next year. We expect USD to weaken as real yields fall and growth gaps narrow”, but the bank also highlighted what could turn them more bullish on the dollar.
“We expect USD to weaken over the next year – especially against risk-sensitive currencies – as US real yields fall and US/RoW rate gaps compress…The USD’s discount to yield‑implied fair value has narrowed…we expect it to re‑widen as trade policy and Fed independence risks linger. We expect fiscal concerns abroad (Japan, UK, France) to ease as local currency-rates correlations normalize and the associated positive USD premium fades.” MS noted that USD positioning is now slightly long and recommends short USD vs long EUR, JPY, GBP, CAD, and AUD.”
Following the outcome of the FOMC meeting, it will be interesting to see the response from the Trump Administration. I would expect, following the decision and the press conference, that rhetoric around changing the composition of the FOMC committee and replacing Mr Powell with a more compliant and dovish Chair to intensify. Mr Powell’s tenure as Chair is set to end around May next year.
The reaction today in terms of the Fed decision might therefore be supportive of the dollar near term, but I don’t think this changes the bearish setup next year. Other central banks, including the RBA in Australia, have signalled a slower pace of rate cuts; in Japan, the BOJ is preparing to hike. We can expect a similar outcome in the UK and potentially Europe, where the ECB could also soon pause a rate cut cycle.
MS emphasised that “we expect USD to decline over the next year, primarily via declining real yields in the US, yield compression with the rest of the world, and the erosion of growth differentials (i.e., further unwinding of the “US exceptionalism” trade). Fed policy normalisation and lingering US policy uncertainty also point to a softer USD path into 2026.” These are all fair points, and the rally in the US dollar that followed the Fed decision is a knee-jerk reaction to the shadow cast over future rate cuts. There is a risk the Fed may pause and not cut again until next year (the next FOMC meeting is in December), but I don’t see this changing the easing bias given the government’s determination to lower US interest rates even at the expense of undermining Fed independence.
The bearish positioning in the dollar has also pivoted in recent months to the bull side. This underpins our view that dollar weakness could emerge again in the coming months and certainly, into next year. MS noted that “USD positioning is no longer heavily short USD, and the one-month moving average of DXY positioning has turned long for the first time since February. This shift in positioning reduces the risks of a short or long squeeze higher or lower in the broad USD.”
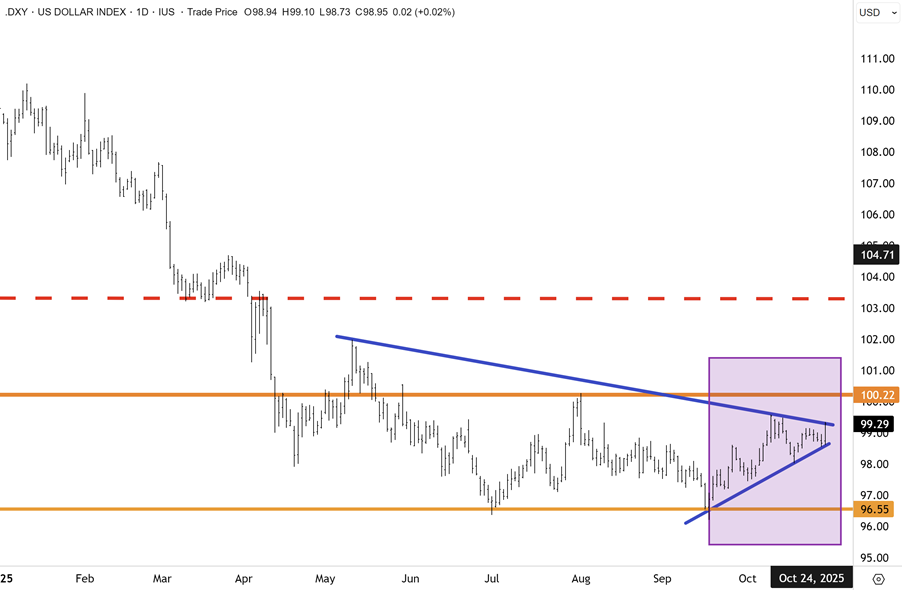
The downward trajectory of the DXY this year confirms one of the largest declines in the dollar in many decades. However, on the charts, downside momentum has clearly dissipated, with the DXY entering a range since July and moving sideways. Resistance above 99.3 is now being tested. A topside breakout could see the DXY move higher and retest the August high at 100, which would skew risk to the upside and the potential for a bigger rebound over the coming months. However, I don’t believe this changes the bearish setup risk of a bigger recovery.
Billionaire hedge fund manager and fixed income specialist Jeff Gundlach joined CNBC to comment on the Fed decision and market outcomes. Mr Gundlach highlighted Mr Powell’s comment, “that if you’re driving through a fog, you slow down”. In his view, the 99% certainty that rates will be cut in December is now dialled back significantly to a 50/50 chance. He also emphasised the yield curve could steepen further and is avoiding longer dated US treasury bonds beyond 5yrs given expectations the US debt will continue to surge next year, “which could soon become problematic”.
On Quantitative tightening, Mr Gundlach’s hedge fund, Double Line Capital, is investing in US T-bills, which would lower interest expense, but not necessarily yield at the longer end. The most pertinent comment perhaps was his view that the Fed working with the Treasury could soon look to “manipulate the yield curve and bend it – to get mortgage rates down, which might involve buying mortgage-backed securities to get house borrowing rates lower.”
This was a fascinating remark, and housing stocks in the US have come under pressure in recent weeks, given the stubbornness of mortgage rates to go lower, which is constraining the housing market. A decisive move by the Fed (which I think is coming) could lower mortgage rates next month when QT ends, which would be supportive of the housing stocks we hold, including James Hardie and Zillow.
Mr Gundlach believes that US inflation will stay above 3% next year and highlighted that a new chairman would likely be incrementally more dovish than Jerome Powell. For this reason and others, including rates remaining below the inflation rate, Gundlach is avoiding long-dated US treasury bonds, preferring corporate and even high-yield (junk bonds).
On gold, Mr Gundlach has been a high conviction bull and advocated a few months ago to hold around 25% of a portfolio in physical metal. This call played out well, but he conceded he had reduced this recently amidst the recent spike. The well-regarded manager now advocates portfolios holding 10% in gold and 5% in other commodities.
“Gold likely has further to go in a correction”, but he is still bullish over the medium to longer term, given risks around rising US debt, fiscal deficits, Fed independence being compromised, and the dollar. He also prefers emerging markets and international equities (due to a bearish dollar view). In terms of the US stock market, he advocated holding 15% in cash and mentioned the Nifty Fifty 50 in the 1970s, which came unstuck. “We now have the ‘nifty 7” where there is huge concentration risk.’
I agree with a lot of what Mr Gundlach says, and while we sold down 10% of our gold holdings several weeks ago, I would advocate staying focused on the primary uptrend over the medium to longer term in gold, PGMs and commodities, notably copper. The correction in precious metals is now well underway and likely has further to go before the dust settles. But the bull market is far from over. I also hold a preference over international and emerging markets versus the US and see a more favourable risk/reward skew in other markets such as Japan, China/Hong Kong and Europe.
JP Morgan updated their cross asset strategy this week and said that their baseline outlook for the US economy was for “bending but not breaking which warrants a medium-term constructive outlook on risk assets (S&P 500 at 7,000 by early 2026), however we remain cautious in the near term on valuations, crowding in high beta stocks and persistent concerns on prolonged US shutdown and tariffs.”
This is a fair point that came through in the muted reaction to Microsoft and Meta Platforms’ strong profit results this morning. Alphabet, however, exceeded expectations significantly and was sharply higher in after-hours trading. Aside from the Fed’s pushback on future rate cuts, I still think the setup for US and global equities is solid heading into year-end. JPM also believes that higher recession risks will drive a steeper US curve and a weaker dollar.
On precious metals, the investment bank this week highlighted that “gold’s pullback was mainly due to profit taking and reduced momentum trades, with further short-term downside likely from higher short-end real yields.” JPM got this right, and we saw this play out after the FOMC meeting with gold down, dollar up, amidst a surge in bond yields. As discussed above, I am taking a medium to longer-term view and looking beyond the incumbent correction.
JPM also has this view and cited that “we view any additional retracement as a buying opportunity given our revised forecast to an average of $5,055/oz by 4Q26. Profit taking and reduction of momentum trades drove the gold pullback over the last couple of weeks, removing some of the latest froth. Further short-term downside risk could occur if short-end real yields in the US drift higher on less Fed easing; however, we remain bullish into 2026 and upgraded our forecast to an average of $5,055/oz by 4Q26 and look to buy the dips.” I concur.
In Australia, inflation accelerated past expectations last quarter, likely forcing the Reserve Bank to pump the brakes on the easing cycle and leaving traders scrambling to reprice money market bets. Bond yields spiked as traders all but erased bets on an interest-rate cut next week. Pre-data, money markets were pricing in a 40% probability. Post-data? Nearly zero. The Australian dollar rose following the print but then dropped post the FOMC meeting.
Headline CPI increased 1.3% QoQ, taking the annual pace to 3.2%, accelerating notably from the prior quarter and both exceeding market expectations. The inflation culprits were housing costs, recreation, transport, and a shocking 9% jump in electricity prices QoQ. Non-tradables (utilities, rents) rose 1.4%, while services inflation climbed to 3.5% annually, led by rents and medical costs.
The RBA’s preferred inflation measure, the trimmed mean gauge, was up 1% QoQ, blowing past the economist consensus of 0.8% and the 0.9% pace that RBA Governor Michele Bullock flagged would be excessive earlier in the week. On an annual basis, trimmed mean prices hit 3%, pinning themselves to the top of the RBA’s 2–3% target band compared with expectations of 2.7%.

A spending surge complicates the picture. The data also revealed that consumer spending is accelerating, particularly on travel and holiday activities (up 1.3%), suggesting the three RBA rate cuts since February are working. Discretionary spending jumped 1.4% for the quarter overall.
What Comes Next?
Economists remain split on whether this is a full stop or a temporary hold (I see it as the latter). Money markets are now pricing the next cut for May 2026, a dramatic shift from earlier expectations of two more reductions by February next year. I acknowledge and concede that it is unlikely the RBA will be cutting on Melbourne Cup day, but the door is open a crack for one before Xmas, given the next meeting doesn’t occur for another two months. Any more adverse job statistics could tip the balance back towards easing and will pile pressure on the RBA, after unemployment jumped to 4.5% in September. And there were some hints in the inflation data that the pop may be more seasonal than structural. The RBA is walking a delicate tightrope between inflation (that could prove transitory) and a fragile labour market, which could deteriorate further.
The Magnanimous Seven
First up, according to Goldman Sachs CEO David Solomon, “the mounting level of US debt risks ‘a reckoning’ for the US economy if the pace of growth doesn’t improve. If we continue on the current course and we don’t take the growth level up, there will be a reckoning. The path out is a growth path.”
I have made this point many times, and the increased spending and tax cuts by the Trump Administration will widen the US deficit and add to the national debt if tax revenues don’t grow. The tariffs are not going to be able to provide anywhere near the revenue offset that covers the deficit.
This is a risk, and whilst the US economy is strong at the moment, a recession will be inevitable at some point, but probably not in the next six to twelve months. David Solomon made this point during an interview at the Economic Club of Washington, but also said that he believes “the US has a low chance of a recession in the near-term”.
Mr Solomon was really discussing widespread and growing concerns that the US and other developed economies are becoming addicted to debt-fuelled stimulus, which kicked off in this cycle during the pandemic. Western governments added trillions in debt to what was already a large pile, and at some point, bond and currency markets are going to react badly. This is not a narrative for the next two months, and even the first half of next year, but I believe this dynamic will define the current cycle and where it is headed.
As mentioned yesterday, despite gold being in a correction and consolidation, precious metals remain the best hedge. The downward reaction in cryptocurrencies this week points to Bitcoin, Ethereum, and others illustrating a stronger correlation with US tech stocks, versus a hedge against currency debasement. I maintain a strong preference for the precious metals and plan to weather the incumbent correction that is now underway, and not try to trade too much around core positions.
Bitcoin has corrected sharply from the record highs near $130k in recent months back to the primary uptrend, which has been in place since 2023. I expect Bitcoin to hold around these levels and maintain an upward trajectory. However, downside risks will dial up significantly if BTC does not hold key supports around $106k. A break below this level could set BTC up for a greater decline towards $75.6k.

Mr Solomon went on to say that “fiscal stimulus and an aggressive fiscal play is really just embedded in the way these democratic economies are operating”. The CEO cited worries from the financial community with regard to the US and other advanced nations and said that “it’s accelerated meaningfully in the last five years.” He is not wrong.
The Goldman CEO also spoke in Riyadh earlier this week and dismissed concerns about a pending potential “systemic crisis” in US credit after a small number of high-profile bankruptcies. I think he will be right here as well, given that the Fed has pivoted from quantitative tightening and will no longer shrink the balance sheet and drain liquidity from the economy. QT comes to a halt on December 1st.
However, this could take some time, if not a few years, to all play out. The setup on the US 2yr yield looks bearish near term. I am anticipating the rise in the US yield curve, and notably the 2yr yield to rebound ahead of the Fed decision in December. Caution is creeping into the bond market, which is to be expected given the government blackout on key economic data.
The US2yr yield looks to have hit a floor at 3.47% and it is plausible downtrend in place since late last year could be breached on the topside. However, my base case over the next several months is for the floor to be tested once again when the trajectory of future easing at the Fed attains more clarity. Over the medium to longer term, I have to stress that I am a major bear on US and global sovereign bonds and see yields tracking much higher over the coming years.

Turning to the US/China trade truce, DJT emerged from the meeting describing the outcome as “truly great.” The President is not wrong because an escalation of the trade war would have damaged both economies, not to mention the rest of the world. But I don’t think the outcome for the US was that good, and that China demonstrated real bargaining power in the negotiations to secure a really good result. I was surprised at how much DJT dialled back the tariffs and trade sanctions.
DJT’s move to cut the fentanyl tariff and extend the existing truce on reciprocal tariffs will leave many products facing a levy of around 47%. This is still low enough for China’s large manufacturing base to remain competitive with regional rivals. I would also add that China is exporting much less these days to the US market and is no longer as reliant. Since Liberation Day (and the first tariffs during the 2016 Trump Administration), China has succeeded in finding other export markets. This trend will only continue.

The US also agreed to suspend a rule expanding restrictions on blacklisted Chinese firms, which demonstrates that Xi’s sweeping rare earth bans and measures could potentially put a cap on new US export controls. Whilst China gave some ground, they didn’t concede that much. I also think that President Xi has bought China more time to further reduce dependence away from the US.
Meanwhile, on the US side, the structural changes and objectives that the Trump Administration was after in the negotiations missed the mark by a wide margin. Geopolitically, it was encouraging to see both leaders confirm mutual visits. Mr Trump said he would be visiting China in April, and President Xi would then head over to the US at some point after that. This is encouraging, but I don’t think this will take both countries off the path of economic decoupling over the longer term.
Both the US and China will use the time secured with the trade truce to frantically build out their own autonomous economic ecosystems. Meanwhile, most economists believe that the agreement won’t do much to reduce the massive trade imbalance between the two countries.
Moving onto the FX markets, the Japanese yen weakened on Thursday after the BOJ delayed, yet again, another rate hike. But I believe this to be only a matter of time now, given growing domestic inflationary pressures, which will be exacerbated by a weaker currency. On this note, Former Bank of Japan Governor Haruhiko Kuroda (who markets see as a legendary veteran) and “all seeing eye” said that the yen is likely to strengthen to around 120 to 130 to the dollar, as the interest rate gap between Japan and the US is expected to narrow sooner or later.
I have a lot of time for Mr Kuroda, who in 2024 forecast a big rally and inflection in the yen towards Y140, which it has done so this year. Mr Kuroda said during a Bloomberg interview this morning with the yen at Y154 that “the current dollar/yen exchange rate is too weak. At some stage the yen-dollar rate would recover toward 120 or 130 yen to the dollar”. Fair call – and he will likely be right once again on this, particularly for two key reasons.
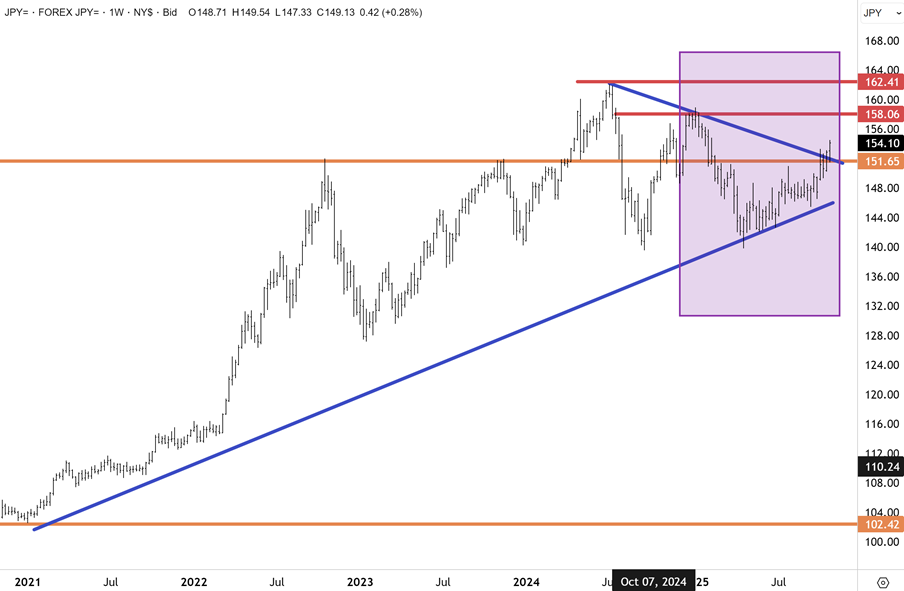
The Dollar/Yen FX rate has, in recent months, rebounded off the primary uptrend in place for five years, to break through downtrend resistance this week. The rally in the dollar/yen likely has further near-term upside, with the next major resistance level at Y158. At this level, I believe a “fat pitch” would open up to FX currency traders with an opportunity to short the dollar against the yen. I believe the dollar/yen is ultimately headed lower and will at some point (maybe within three to six months) convincingly break down below the primary uptrend with a Y120/Y130 target plausible by December 2026.
High rates and bond yields in Japan are going to see capital repatriated from offshore. Japanese investors and consumers parked trillions offshore during the financially repressive decades when rates fell to 0%. The Japanese stock market is also doing much better, and so capital will also be returned for domestic investment, and the Government has incentivised domestic investors to do so with superannuation reforms.
Mr Kuroda added during the interview, “that US rate cuts and the BOJ’s move in the opposite direction will naturally narrow the rate differential between the two economies, helping the yen return to levels last seen over two years ago.” His comments came about half an hour before the BOJ confirmed its decision to keep interest rates steady, as widely expected. “I’m not quite sure whether they’ll move today or not. But anyway, they may move today or next meeting in December.” A hike is coming – and I believe this will underpin profit and revenue growth for Japanese banks and financials, which we own across our international portfolios and in the Fat Prophets Global Contrarian Fund.
Economics & stocks in focus
In the US, Thursday was absent from any major local economic news, but reports from three of “the magnanimous 7”, along with a raft of other earnings reports, gave investors plenty to chew on.
Mega-tech faced a tough crowd on Thursday

I touched on the three mega-tech companies that reported yesterday. Investors now have had time to more fully digest the numbers and listen to earnings calls. The headline number that spooked investors was the combined $78 billion in capital expenditures from Alphabet, Meta and Microsoft last quarter alone, marking a 89% YoY increase. This is mostly AI-related, and much of the CAPEX is going towards vast, energy-hungry data centres. This is shifting business models for many of the Mag 7 (less so for Apple +0.6%) towards an asset-heavy model, at least in the near-term. D&A costs are increasing rapidly, and bear in mind that the hugely expensive chips in the data centres useful life is brief. Think about three years maximum, great for Nvidia (but also motivating Google/Amazon and others to design their own TPUs), but certainly not for the hyperscalers.
Still, there are notable differences at the company level and divergence in the stock performance, which I dive into shortly (cheat sheet: Alphabet gained, MSFT was modestly lower, and META tanked).
More broadly, traders took some profits off the table from loftily valued tech. Oracle -6.7%, Tesla -4.7%, Amazon -3.2% and Nvidia -2%. AMD fell -3.6% and Broadcom was down -2.5%. Amazon rose in after-hours trading following a strong earnings beat, helped by cloud growth.
Diving into the Mag 3’s earnings reports
Microsoft delivered a clean beat on group revenue and profit. Azure cloud growth landed at 39% (constant currency, 40% reported), a stellar number, but not enough for investors on Thursday. Investors were also a little nervous about capex spending and plans. First-quarter capex came in at $34.9 billion against a $30 billion expectation. CFO Amy Hood said capital expenditure growth will accelerate in fiscal 2026, after previously guiding for a slowdown.
Group revenue rose 18% year over year to $77.67 billion versus $75.33 billion expected, and EPS of $3.72 topped the $3.67 consensus. Net income was $27.7 billion, with management noting a $3.1 billion drag tied to its OpenAI investment, or $0.41 per share. The cloud engine did the heavy lifting. Intelligent Cloud revenue grew 28% to $30.9 billion, ahead of the consensus $30.25 billion view, and Azure advanced 39% as noted earlier. MSFT shares closed -2.9% lower.
Meta’s revenue of $51.24 billion topped the $49.41 billion consensus, growing 26% year-over-year, the highest revenue growth since Q1 2024. Advertising revenue hit $50.08 billion against $48.5 billion expected. Daily active people across Meta’s apps reached 3.54 billion. A hefty $15.9 billion one-time tax charge slammed GAAP profit, which plunged 83% to $2.7 billion, or $1.05 per share. Adjusted EPS (it was a big adjustment!) of $7.25, though, easily topped the $6.69 consensus. Meta’s top-line performance was impressive, and the core businesses are humming along. However, it was understandable to see some investors freak out about spending.
Meta’s quarterly capex more than doubled YoY to $19.4 billion. The company raised FY25 capex guidance to $70-72 billion (the bottom end of the range was lifted by $4bn), up from $37.3 billion spent in 2024, representing a 93% annual increase. So, Meta’s capex was 38% of revenue in the September quarter, and the company is expected to lift this again aggressively next year. Microsoft actually spent a higher percentage of revenue on capex last quarter (c44%), but it is a hyperscaler, selling much of that compute (as do Google and Amazon/AWS).
Meta’s spending is just for itself! The Llama 4 models have been a huge disappointment and are not even mentioned in the discourse of the top foundation models for most savvy AI users. Mr Zuckerberg is desperate to address this and has gone on a huge AI hiring spree, reportedly offering 9-figure packages for top talent, only to turn around and lay off 600 people from the AI division this past week.
Consider too that Meta inked a deal earlier in the week for $27 billion in off-balance sheet financing for a data centre. What does this mean? Well, it will keep that debt and capex out of Meta’s cash flow statement. Free cash flow was already down 35% in the September quarter, and that was just the surface numbers. Dive into the small print and you find that the CFO line (cash flow from operations) was flattered by a massive deferred tax add-back.
Meta is still in great shape financially, just not as good as Alphabet and Microsoft currently. Meta shares tumbled -11.3%. We hold both Alphabet and Microsoft in the international managed account portfolio, but have never owned Meta (reach out to patrick.ganley@fatprophets.com.au) for more information.
Alphabet posted strong numbers, with sales and profit outpacing estimates, powered by another leg up in AI-driven cloud demand. Like peers, the company unveiled a record-high infrastructure spending plan, with 2025 capex set to hit as much as $93 billion. That’s a number big enough to grab headlines. For now, though, the underlying print was enough to send Alphabet up +2.5% on Thursday.
Revenue of $102.35 billion beat the $99.9 billion estimate and was up +16% YoY. EPS of $3.10 demolished the $2.33 consensus. Google Cloud delivered $15.15 billion (ahead of $14.7 billion expected), growing 35% YoY (which marks an acceleration). YouTube ads brought in $10.3 billion, up 15% and beating expectations. Net income surged to $34.97 billion from $26.3 billion a year ago.
Over 70% of existing Google Cloud customers now use AI products. Google is up-selling to the installed base as well as chasing new clients. Upselling helps profitability hugely. Gemini now has 650 million monthly active users, up from 450 million last quarter. Google is closing the gap with OpenAI (a black hole for cash currently) and monetising through the cloud business, along with subscriptions. Google’s full AI stack positions it well to have a good chance to be one of the big AI winners.
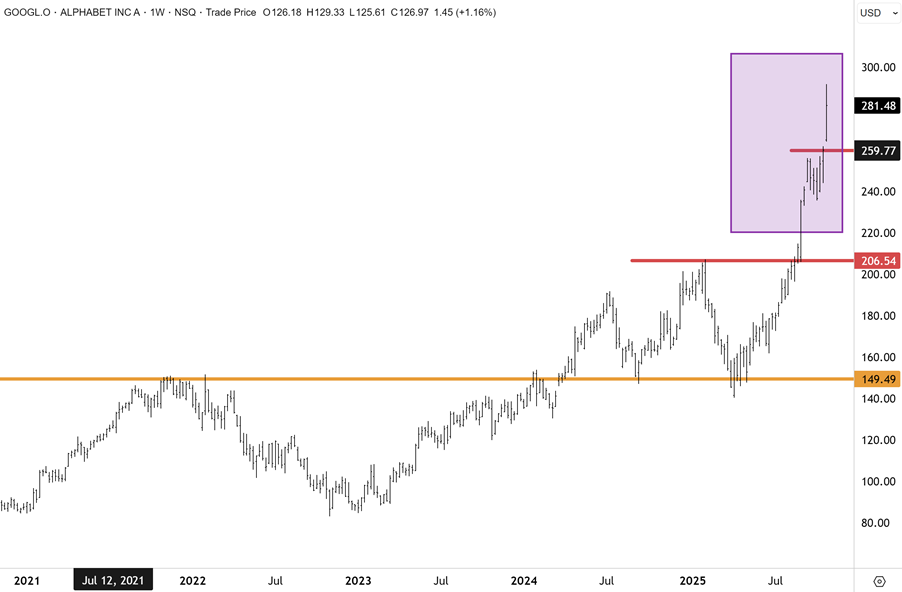
A week ago, when I provided an update on Google’s latest quantum computing breakthrough, I also updated our technical view, saying, “Alphabet has fully recovered from the correction earlier this year to make new record highs near $260. The scope is open for continued upward extension with support now well-defined at $205 and below. We hold Alphabet in our Global managed account portfolio.”
Alphabet has smashed through resistance at $260 to make a new record high near $290. Scope remains open for additional upside extension in our view.
Carpe Diem
Sign up to receive full reports for
the best stocks in 2025!
Where to Invest in 2025?
The market is full of opportunities—but which stocks will deliver real wealth-building potential?
At Fat Prophets, our expert analysts uncover the best Australian and global stocks to help you stay ahead of the curve. Whether you’re looking for growth, income, or diversification, our carefully curated portfolio gives you access to high-conviction stock recommendations backed by deep research and proven insights.
Subscribe now to get full reports of these stocks and get ready for the next big opportunities!
Over 25,000 customers worldwide
Need a try? You’re first-time customer?
Enjoy our Welcome Gift with $500 OFF your Membership
Use code: FPWELCOME
FAQ’s
How much does a Membership cost?
We have a number of Membership options for the DIY investor. Our research services cover individual stock opportunities in Australia, as well as the UK, global markets, and a sector-specific report focussing on the mining space. Annual Membership prices start at $1395.
Do you offer execution services?
No we do not, and our research is independent in the sense that we are not conflicted by operating broking services alongside them. We also do not offer ‘sponsored research’ and are not financially incentivised by any of the companies that we recommend to Members.
Can I access any special offers?
Our introductory joining offers relate only to new Members. We do however offer ‘early bird’ discounts to existing Members who renew in advance of their Membership expiring.
Can I get tailored financial advice?
Our research products are ‘general advice’ in nature only, however we do categorise all our recommendations by the level of risk appetite which we believe is involved. Members looking for more direct advice can also make an inquiry to our wealth management team which offers a separately managed accounts service.
Do you offer a Money-Back guarantee?
Yes we do. Fat Prophets offers a 100% money back guarantee on annual subscriptions within 30 days of taking out a Membership.