
Strong Results & Improved Outlook
Colorado-based gold miner Newmont (ASX:NEM) finally debuted on the ASX following the acquisition of Newcrest – where the latter has finally retired from the ASX. The dual-listed shares ended the first trading day at $59.50 under the ticker NEM. Looking at underlying asset, the case for gold continues to strengthen (even outperforming S&P500) with demand for hedging and safety amid the war in Israel pushes the metal higher.
A recap on the merger, Newcrest shareholders received 0.40 Newmont shares for each Newcrest share owned, along with a fully franked dividend of up to US$1.10 (about A$1.72) per share.
This has now made Newmont the world’s largest gold mining company with mining operations across the Americas, Africa, Australia, and Papua New Guinea. Going forward, we also expect to see synergies from the merger with estimates putting it at least at US$500 million to US$2 billion within the next two years.
The investment case for Newmont (ASX:NEM) is intrinsically tied to the price of gold. As a significant player in the gold mining sector, Newmont (ASX:NEM) stands to benefit from rising gold prices, which often occur in times of economic uncertainty or inflationary pressures. The leverage provided by gold prices can amplify returns for investors. That said, gold prices are surging due to the metal’s appeal as a safe-haven asset in times of economic uncertainty. As of this writing, gold is trading at US$1,995.15/oz which is up 10.2% since the start of October.
The aforementioned fact coincides well with Newmont’s long track record of exceptional operational efficiency. Having consistently demonstrated its ability to meet production targets and effectively manage costs, this means that as gold moves higher, leads to increased profit at a quick clip for Newmont due to its competitive edge in operational excellence. The excess cash could further lead to additional opportunities in the current gold market.
Turning to the charts, the US main listing of Newmont looks technically opportunistic. The stocks is more than 50% down from the ten-year highs and has in recent years been confined to a primary downtrend. A breakout above $39 would confirm an inflection and a return of topside momentum. (Members note: the ASX listing for Newmont has very little data to render a chart and the US-listing will be utilised for now.)
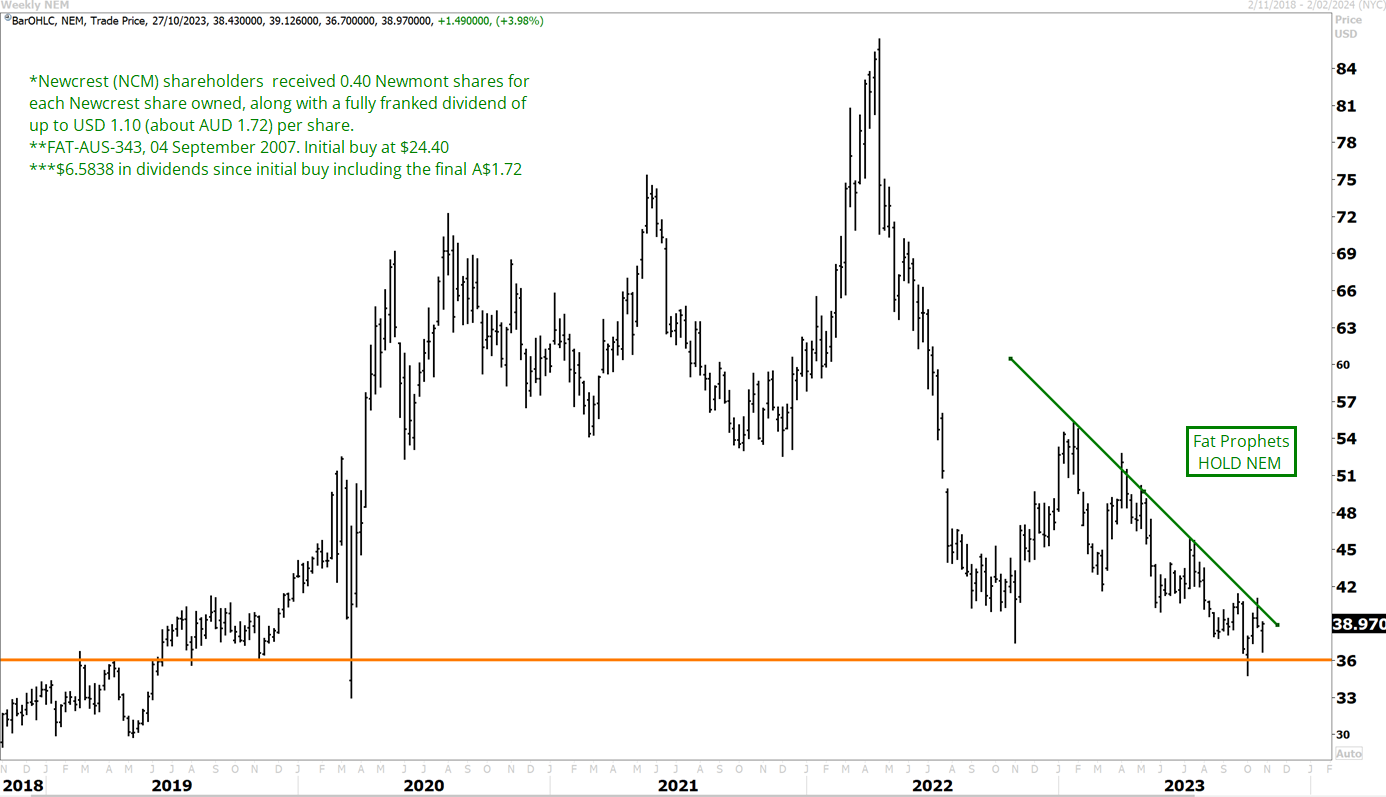
However, in the meantime, we await a breakout as confirmation for a change in trend. In the interim, we maintain our HOLD rating on Newmont (ASX.NEM).
With that out of the way, we turn our attention to the results:
3Q23 Update
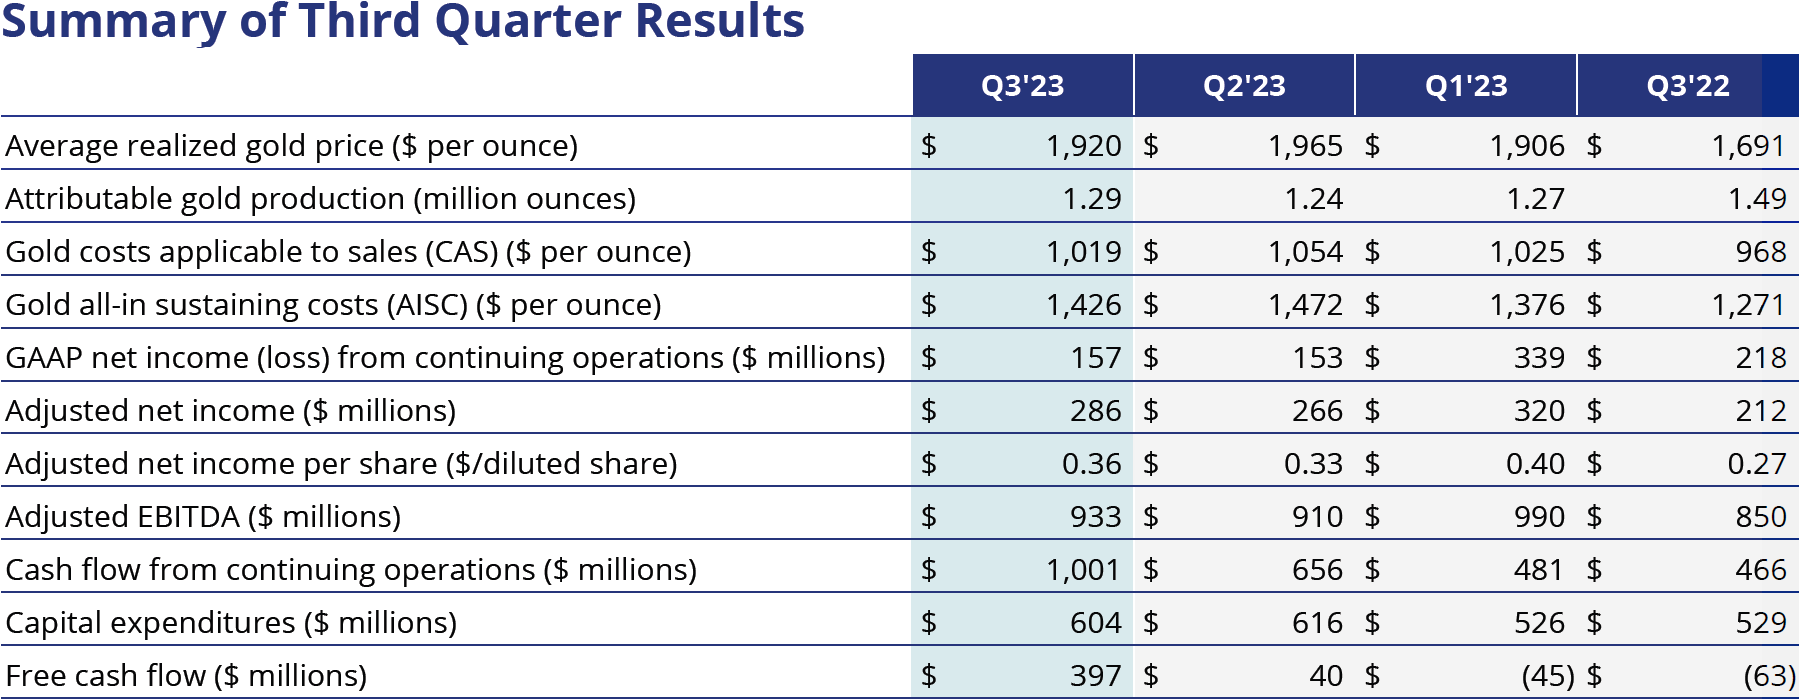
Looking at Newmont’s third-quarter 2023 (3Q23) results and we see that the company reported a stable performance for 3Q23, producing 1.3 million attributable gold ounces and ~58,000 co-product gold equivalent ounces (GEOs) from copper. In light of solid production, we expect some momentum this quarter to lead to the group hitting year-end targets.
In terms of costs, Newmont (ASX:NEM) reported gold Costs Applicable to Sales (CAS) per ounce of $1,019 and gold All-In Sustaining Costs (AISC) per ounce of $1,426. The improvement in costs was driven by higher sales volumes compared to the previous quarter.
Compare that result with a much higher average realized gold price of $1,920/oz, an increase of $229 per ounce year-on-year and it is fairly obvious that margins will improve.
Source: Newmont (ASX:NEM) 3Q23 Filings
On the Financial front, Newmont reported net income attributable to its stockholders of $158 million for the 3Q23 which is only marginally higher from last quarter by 2.6% though lower year-on-year by 28%. The result was also below consensus expectations by 16.3%.
Adjusted EBITDA, on the other hand, increased 10% to $933 million, compared to $850 million for the prior year quarter; while free cash flow increased to $397 million from $(63) million in the prior year quarter primarily due to higher operating cash flow.
Despite lacklustre financials for the quarter, the outlook going forward is a positive one with management ramping up plans for their Peñasquito mine in Mexico. In addition to that, management has also adjusted their FY23 outlook for the core Newmont (ASX:NEM) portfolio to reflect several factors affecting production.
There should also be some adjustments from joint ventures in Nevada Gold Mines and Pueblo Viejo, and lower production at Ahafo due to running its operations below full capacity to safeguard one of the grinding mill’s critical components until it’s replaced. It’s worth noting that the copper guidance for Boddington remains unchanged for the year.
The aforementioned adjustments should result in AISC of $1,400/oz which is still well below the current gold price. While there are modifications to various aspects of the outlook, the consolidated expense guidance mostly remains the same possibly reflecting added costs from merging with Newcrest.
That aside, management has earmarked $1.4 billion for sustaining capital expenditures in 2023. This budget accounts for increased spending related to improving living conditions at Musselwhite, acquiring five new autonomous haulage trucks at Boddington for enhanced stripping operations in the North and South Pits, and replacing a conveyor at Ahafo. For development capital, Newmont has allocated $1.1 billion for 2023, considering reduced spending at Yanacocha Sulfides and adjustments due to the timing of expenditures following a rainfall event in the first quarter.
Overall, Newmont (ASX:NEM) delivered decent production and cash flows in the third quarter, with expectations of further improvements in the fourth quarter. The company’s financial position and liquidity remained strong, and the revised outlook for remainder of the year is still a net positive.
In the interim, we maintain our HOLD rating on Newmont (ASX:NEM).

