

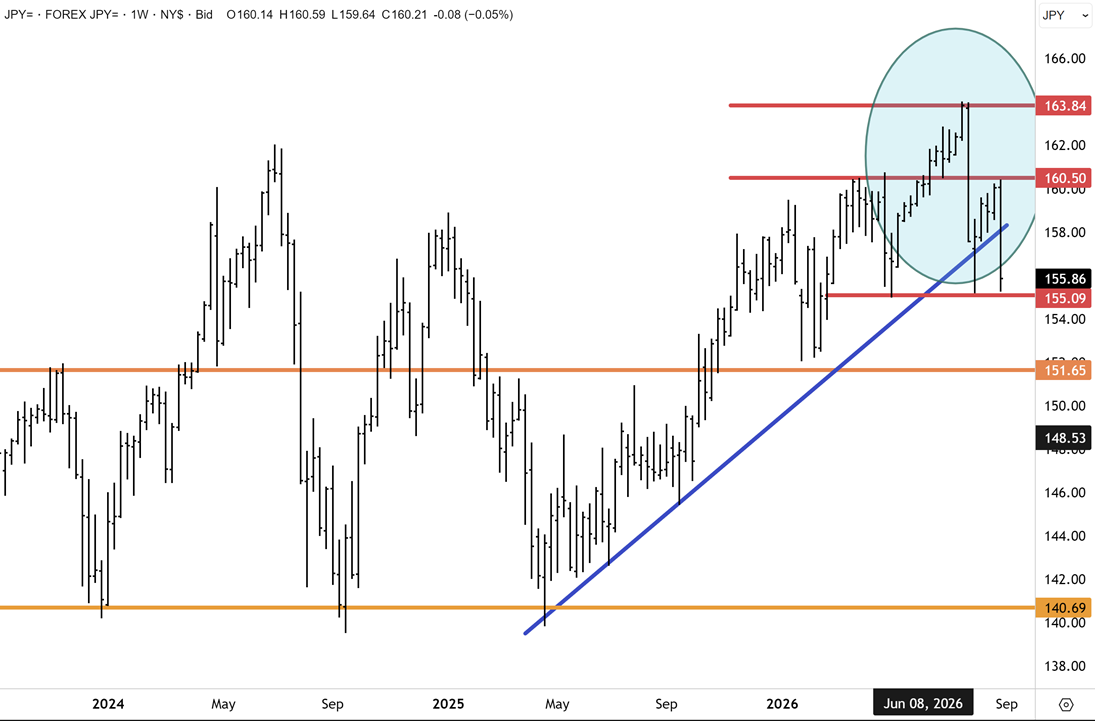
- A three-year trend broke on Thursday, and no central bank was standing behind it. The euro, the pound and the Aussie had all confirmed months ago – the yen was the holdout.
- Futures for the 15/16 September meeting opened the week near 70% and closed Thursday at an effective coin toss. Our position hasn’t moved.
- The heaviest US–Iran exchange in weeks, crude higher, and the ten-year almost round-tripped. This was a bond market that stopped flinching on oil.
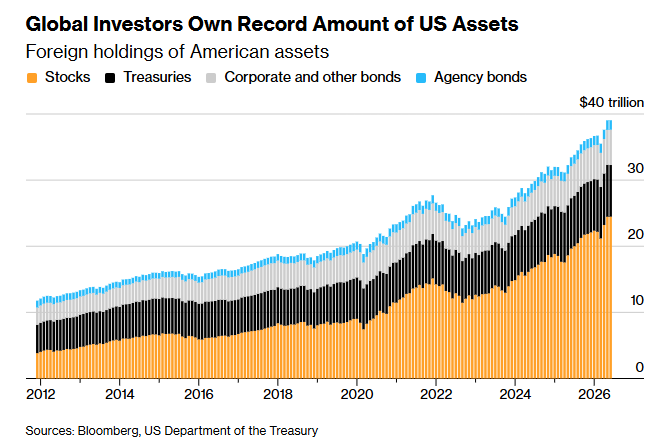
- Pension funds and insurers across six countries hold $4.6 trillion of US assets and have hedged 41% of it, the lowest reading since at least 2015. Bloomberg has run the arithmetic on a five-point shift. One number will be particularly interesting for Australian investors.
- We see a real disconnect between gold prices and gold miners. We outline how we think the dots connect.
- Australian housing health continues to look sickly. CommBank has cut again, and expects the RBA to hike into it in November. Will it?
Report Spotlight – St Barbara
The fatLITE is the weekly read. Membership is the position.
The Verdict
The market spent much of the week pricing the Federal Reserve to tighten into an oil shock and finished on Thursday with the odds close to a coin flip. Futures for the 15/16 September meeting opened the week at around 70% after Warsh’s comments at Jackson Hole and closed Thursday at 50%. Oil was up for much of the week, rather than down, and the repricing came from a closer reading of what the Fed had actually committed to, helped on Thursday by Governor Christopher Waller saying he was willing to hold under certain circumstances, which kicked off a broad rally on Wall Street on Thursday. We have held the view that the hike was less settled than the markets were pricing, and more market participants are coming around to that, though we acknowledge upcoming data, including the job print on Friday morning and later, inflation, will be critical.
The yield curve continues to play a key role. It opened Monday at 4.35%, 4.75% and 5.24% across the 2s, 10s and 30s and closed Thursday at 4.34%, 4.77% and 5.25%. Between those two readings, crude rose from $86 to $91, the United States and Iran exchanged their heaviest fire in a while, two supertankers were struck leaving the Strait, and the US bond market moved by one or two basis points. Almost the entire move since Jackson Hole happened in the session immediately after it, and four days of escalation added little. A bond market that stops responding to an oil shock is hinting strongly that the shock is priced.

Equities took the hint late and then took it decisively. The S&P 500 ran 7,686, 7,631, 7,666 and 7,747, finishing at the week’s high and just above the 7,731 where the previous Thursday left it. The VIX fell 6% on Thursday to 14.5, its lowest since December. The ASX 200 went the other way, giving up 0.2% over the past week.
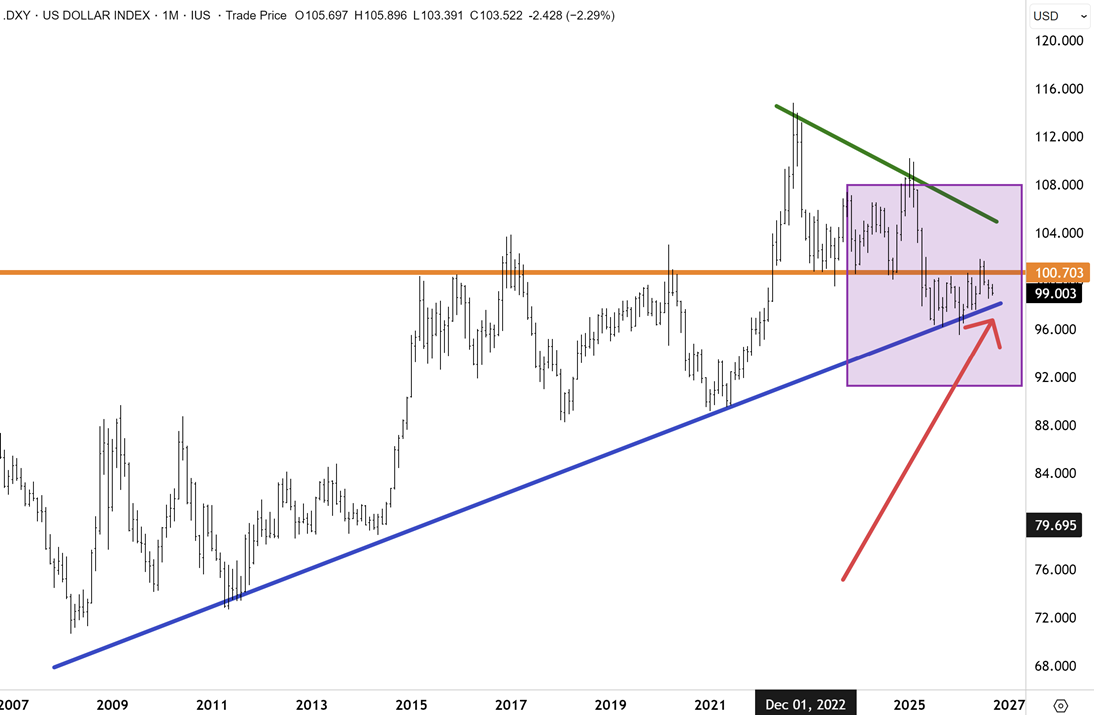
The US dollar was a key variable during the week, alongside bonds. The DXY index fell to 98.9, its lowest since May, and the yen broke the uptrend that has carried the dollar against it since the middle of last year, without any intervention from the authorities. Gold closed at $4,527, silver at $67, copper at $6.67. The Australian dollar cleared US72c.
The Calls
Look at the yen. A trend that has been in place for years showed signs of a major break without the public shoulder of the authorities behind it. If that break holds, the market implications are major.
I have been anticipating a resumption of downward momentum in the US dollar index for months. The euro, the Australian dollar, the pound and the Canadian dollar have all confirmed technical breakouts against the greenback. The yen was the holdout, and continued to depreciate.
That changed on Thursday, when the uptrend in place on the three-year weekly chart gave way. Dollar-yen broke down, which is to say the yen strengthened, and it did so with no public intervention behind it. When a three-year trend breaks on its own, without a central bank standing behind the move, I take that seriously.

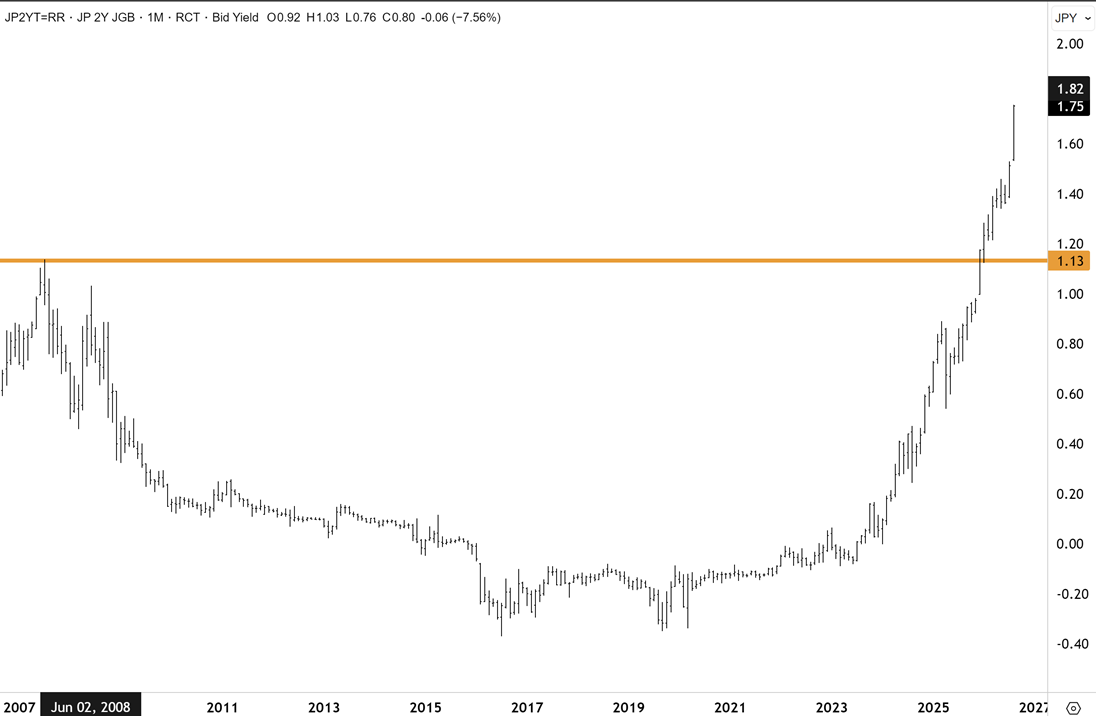
The reason the yen has lagged the others is straightforward. The Bank of Japan has been raising rates at a glacial pace. That is now changing. The two-year JGB yield has doubled over the past year and has risen 30 basis points in recent weeks, which is the market telling you a hike is close. Both Washington and Tokyo intervened jointly recently to buy the currency, and neither side wants to see the yen much beyond ¥160.
Scott Bessent was asked about the yen on CNBC this week, and his answer was the most pertinent thing he said in the interview. He cannot affect the natural equilibrium, he said, but he can send a signal, and he has information the market does not. His belief is that the Japanese government and the Bank of Japan will do the things that lead to a stronger yen. Asked whether the BOJ is likely to raise rates, he said the market is pricing that in now.
If the BOJ signals a willingness to move the cash rate from 1.00% toward 1.5% over the next six months, the US dollar has a genuine problem. We have been positioning for a weaker greenback.
The Fed
We have doubted the hawkish turn that the market has priced in since Warsh became Fed Governor from the start. This morning, I wrote that “I will repeat my call from earlier this week/last month – the Fed is more likely to hold than hike in September, and this sets the markets up for a possible decent run this month. However, this will come down to the data, and the Fed will be forced into hiking if inflation accelerates.
Kevin Warsh took a harder line at Jackson Hole than we think will be delivered. The reasoning has not changed. The long end of the yield curve has already done a great deal of the tightening the Fed would otherwise have to do itself, with the ten-year topping 4.75% on Monday. A hike now leaves Warsh badly exposed if the Strait reopens and oil collapses, which would be acutely deflationary and have him cutting rather than tightening. And the market had a September move close to fully priced, which is precisely the setup in which a hold does the most damage to the dollar.
If he does move, we expect one or two hikes and a stop, with forward guidance nothing like 2022. The bark has always looked worse to us than the likely bite.
A lesser-known factor that could pull the greenback lower
Beyond rates, there is a positioning problem building underneath the dollar that some are missing. I wrote about this in the morning’s correspondence with members. Pension funds and insurers across Japan, Canada, Taiwan, Australia, Denmark and Finland are among the largest holders of US assets in the world, and as of the end of June they had hedged only 41% of that foreign currency exposure. That is the lowest reading since at least 2015. Bloomberg’s country-level detail is where it gets uncomfortable for local investors: Australia sits at the bottom of the six at 27%, behind Canada at 38%, Taiwan at 43%, Japan at 46%, Denmark at 49% and Finland at 51%. The average across the group has fallen from 56% in 2020. Bloomberg’s arithmetic is that lifting the hedge ratio by just five percentage points, against $4.6 trillion of holdings, would mean roughly $230 billion of dollar selling.
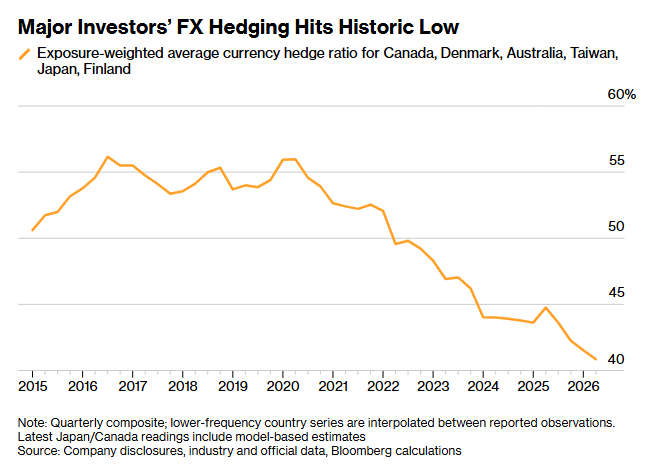
We saw this hedging dynamic play out last year, and aside from dollar debasement fears and financial asset diversification from central banks, the dollar lost ground sharply last year. Hedging demand had a real impact in 2025, and it is plausible that this driver could soon reassert itself – particularly if the yen continues to rally against the greenback from here.
Given our expectation that there is a strong possibility that the Fed will remain on hold in September, this could add further pressure to the dollar, where markets have been leaning towards a hike. US interest-rate differentials that favour the dollar could quickly narrow. That would create a further headwind for the dollar in my view.
Meanwhile, dollar hedging costs have fallen…
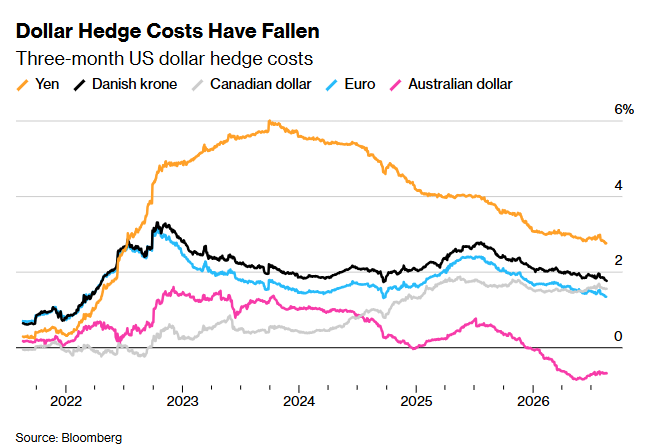
Japan is where this matters the most in 2026/27. It holds trillions of dollars of gross US assets, a far wider pool than the currency-exposed slice in the hedging figures above, and JGB yields are now more attractive than at any point in decades. Some of that money will come home. We saw the same dynamic play out in 2025, when hedging demand had a real hand in the dollar’s decline. The trigger this time is a rallying yen, which is exactly what Thursday delivered.
The level to watch is 98 on the Dollar Index, where the primary uptrend dating back to the end of the last dollar bear market in 2009 now intersects. A decisive break below that would be the first hard technical evidence that a dollar bear market has begun. The yen is the currency that gets us there.
A weaker US dollar isn’t typically a problem for equities. It loosens global financial conditions, which is supportive of shares, commodities and emerging markets, and US multinationals earn more offshore. What it does mean is that overseas investors holding large unhedged US positions have some work to do.
Golden Years
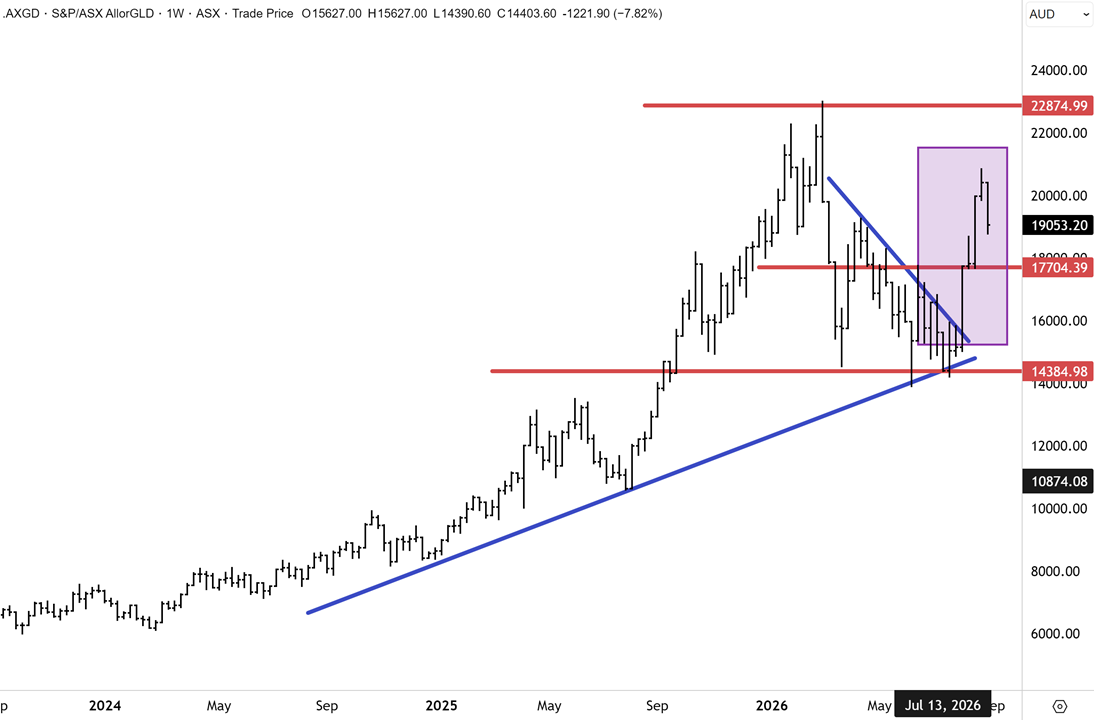
The portfolio expression of this view is that we are weighted to gold, PGMs, copper and resources, and we expect that theme to run into 2027. Australian gold equities rallied 33.9% in the month to 28 August, and a pullback since is healthy.
The August rebound in gold miners and in the latter part of this week has real substance behind it. Morgan Stanley notes that Australian gold miners now make up 6.1% of the ASX 200, a weighting the sector has not carried in decades, which means any fund manager underweight the space has been losing ground. The Philadelphia Gold and Silver Miners index has recovered a good part of its correction since July.
Meanwhile, the ASX All Ords Gold index has performed strongly and has a mirror image setup to the Philadelphia Gold & Silver Miners Index on the charts. Despite US$ and A$ spot gold being well over $1000/oz down from the record highs, the All Ords Gold index is just 4,000 points below the peak high near 23,000. The gold miners dominated the recent June reporting season in Australia and did well in the US relative to technology.
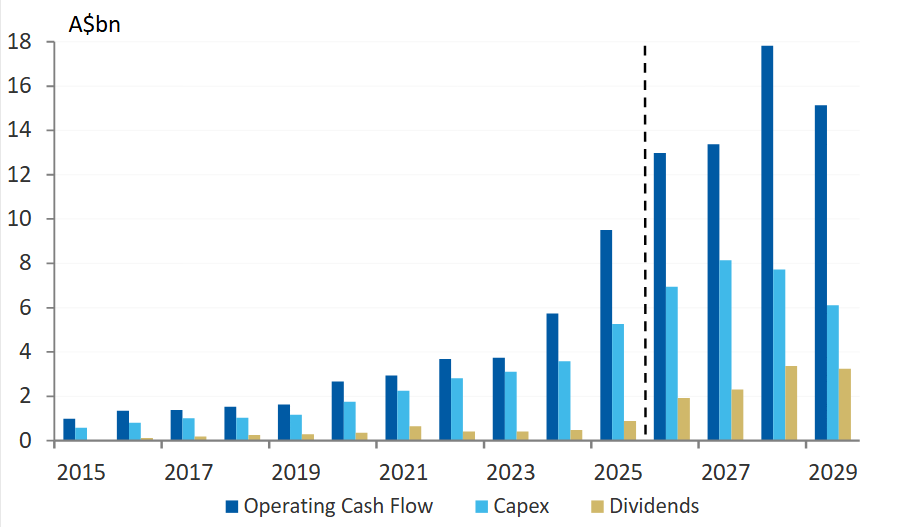
That gap between the miners and the underlying metal is what we are watching carefully. It is being reflected in a jump in cash generation and higher dividends. Morgan Stanley’s work has free cash flow across the top ten Australian gold companies stepping up materially through FY29, and their commodities team is running well ahead of consensus on the gold price, with a fourth-quarter target near US$4,450 an ounce against a consensus that fades toward US$4,000 by FY29. We think consensus is too low, as sell-side long-run price decks almost always are, and not only for gold. The same conservatism applies to copper, silver, iron ore and the grains.
The demand side supports it. ETFs took in 70 tonnes across July and August after shedding 93 tonnes in May and June, and central banks bought 345 tonnes in the first half, with Morgan Stanley looking for 700 tonnes across the year.
The Local
The housing downturn in Australia is deepening, and the media are carrying regular news stories about the decline in residential housing. CommBank economists are the latest to cut housing price forecasts and conceded the correction is running faster, deeper and wider than they assumed three months ago. What largely started as a Sydney and Melbourne problem is now also showing up in Brisbane, Perth and Adelaide. The Economic Insights note published yesterday noted that national dwelling prices fell another 0.9% in August, the fifth straight monthly decline, leaving them 3.6% below the March peak. CommBank now sees a peak-to-trough fall of around 9% nationally and closer to 10% across the five capitals. This view is well founded, in my view.
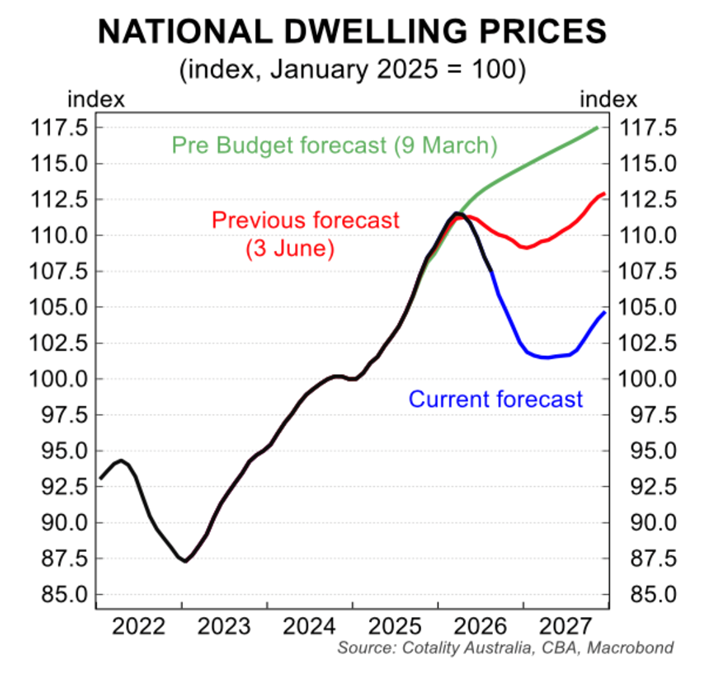
Graphic: CommBank Economic Insights (1 September 2026)
The downgrade rests on several factors – weaker momentum, less support from tight supply than previously assumed, and a higher envisioned rate path with RBA rate hikes expected before year-end. Clearance rates at auction have not surprisingly collapsed back to historically low levels, and buyers are in the driving seat as it relates to transactions. Many prospective buyers are concerned about all these factors and are understandably holding back and remaining on the sidelines – which is exacerbating the downturn.
On the other hand, we have just had a more constructive local reporting season than feared. The local market remains in decent shape, and our view that resources will do the heavy lifting in 2026 is unchanged. The sector delivered impressive financial results, with many miners delivering strong cash flow and earnings strength, with some nice dividend hikes and other companies, like Sandfire and St Barbara, reinstating dividends after a long absence. Healthcare rebounded strongly, led by fallen angel CSL, but accompanied by broader strength. The banks disappointed, but with some steam coming out of their share prices, the big banks attracted flows again this week. Discretionary is where the market has decided the most weakness is, with that sector the weakest local performer over the past month. We don’t disagree, as headwinds abound here.
Report Spotlight
St Barbara (ASX: SBM) – BUY
The balance sheet transformation is the real story here for St Barbara. The minerended FY26 with A$393 million of cash plus A$81 million restricted cash, no debt, and net assets up 148% to A$928 million, against a market cap of just A$913 million. The company declared its first dividend since September 2021, a fully franked 5 cents per share, and flagged a potential buyback, a strong signal that management sees no need to tap the market for capital again.
Underlying operations still recorded an A$27.8 million loss once the Lingbao accounting gain is excluded, so the cash strength stems primarily from that transaction rather than current operating cash flow. That said, unit economics at Simberi have genuinely improved and were in positive territory.
Simberi’s Lingbao-funded US$333 million expansion targets production above 200,000 ounces annually by enabling sulphide ore processing. In Canada, the Touquoy restart is approved for calendar 2026, while the 15-Mile Processing Hub, targeting 100,000+ ounces annually for over 11 years, awaits an updated pre-feasibility study due at the end of September.
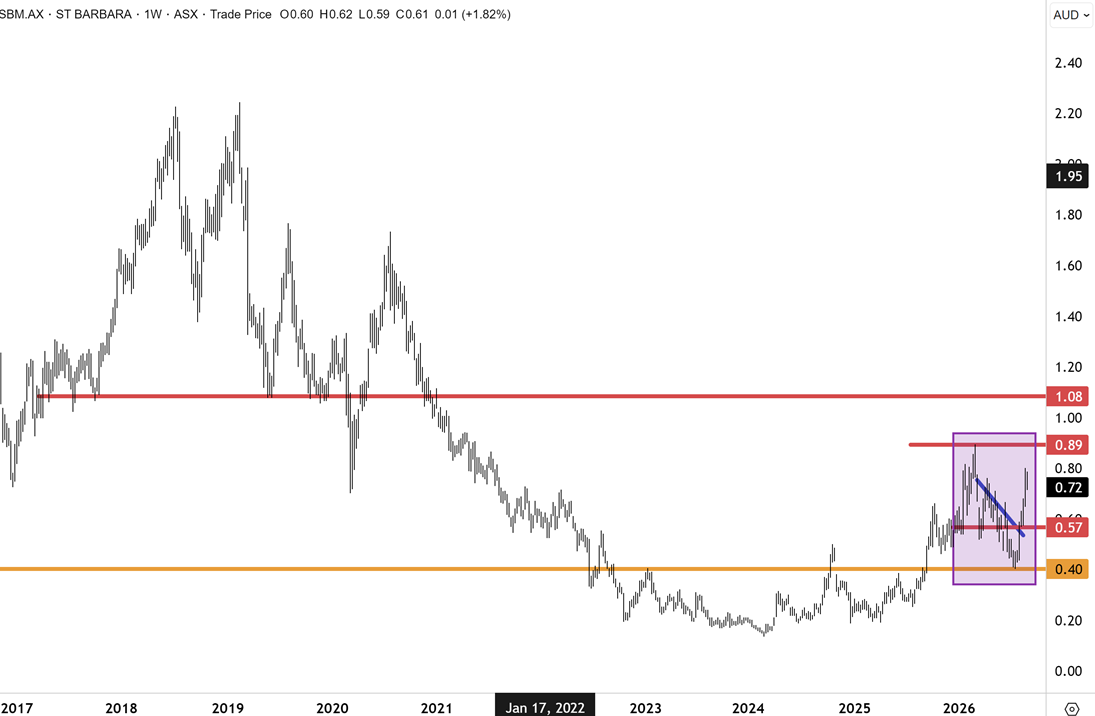
St Barbara has extended higher to 80c after breaking out of an entrenched downtrend descending from the February highs. We continue to believe that a structural inflection has been fully confirmed and that St Barbara possesses significant scope for a broader recovery. We expect SBM to sustain this upward momentum and continue outperforming the All Ordinaries Gold Index as its underlying fundamental narrative gains traction in the market, a thesis we originally noted four weeks ago. Our next price target is the key overhead resistance level sitting at 90c. Once cleanly through this level, the next technical target on the chart is the resistance cluster near $1.10.
Everything in this fatLITE is the surface. The full reports, macro commentary, model portfolio, and buy recommendations are members-only. Try it with our 30-day money-back guarantee.
Have a great weekend.
Carpe Diem
Angus

