
KEY CONTENT
- US and Israeli strikes on Iran triggered a sharp geopolitical repricing in markets
- The Strait of Hormuz – a 33km chokepoint carrying 20% of the world’s daily oil supply – emerged as the key risk variable; Saudi Arabia began rerouting crude to Red Sea terminals as a partial workaround
- WTI crude surged from $67 to above $81 per barrel intraweek, crossing the market’s inflation-concern threshold; Morgan Stanley’s Mike Wilson places the recession trigger at $100+
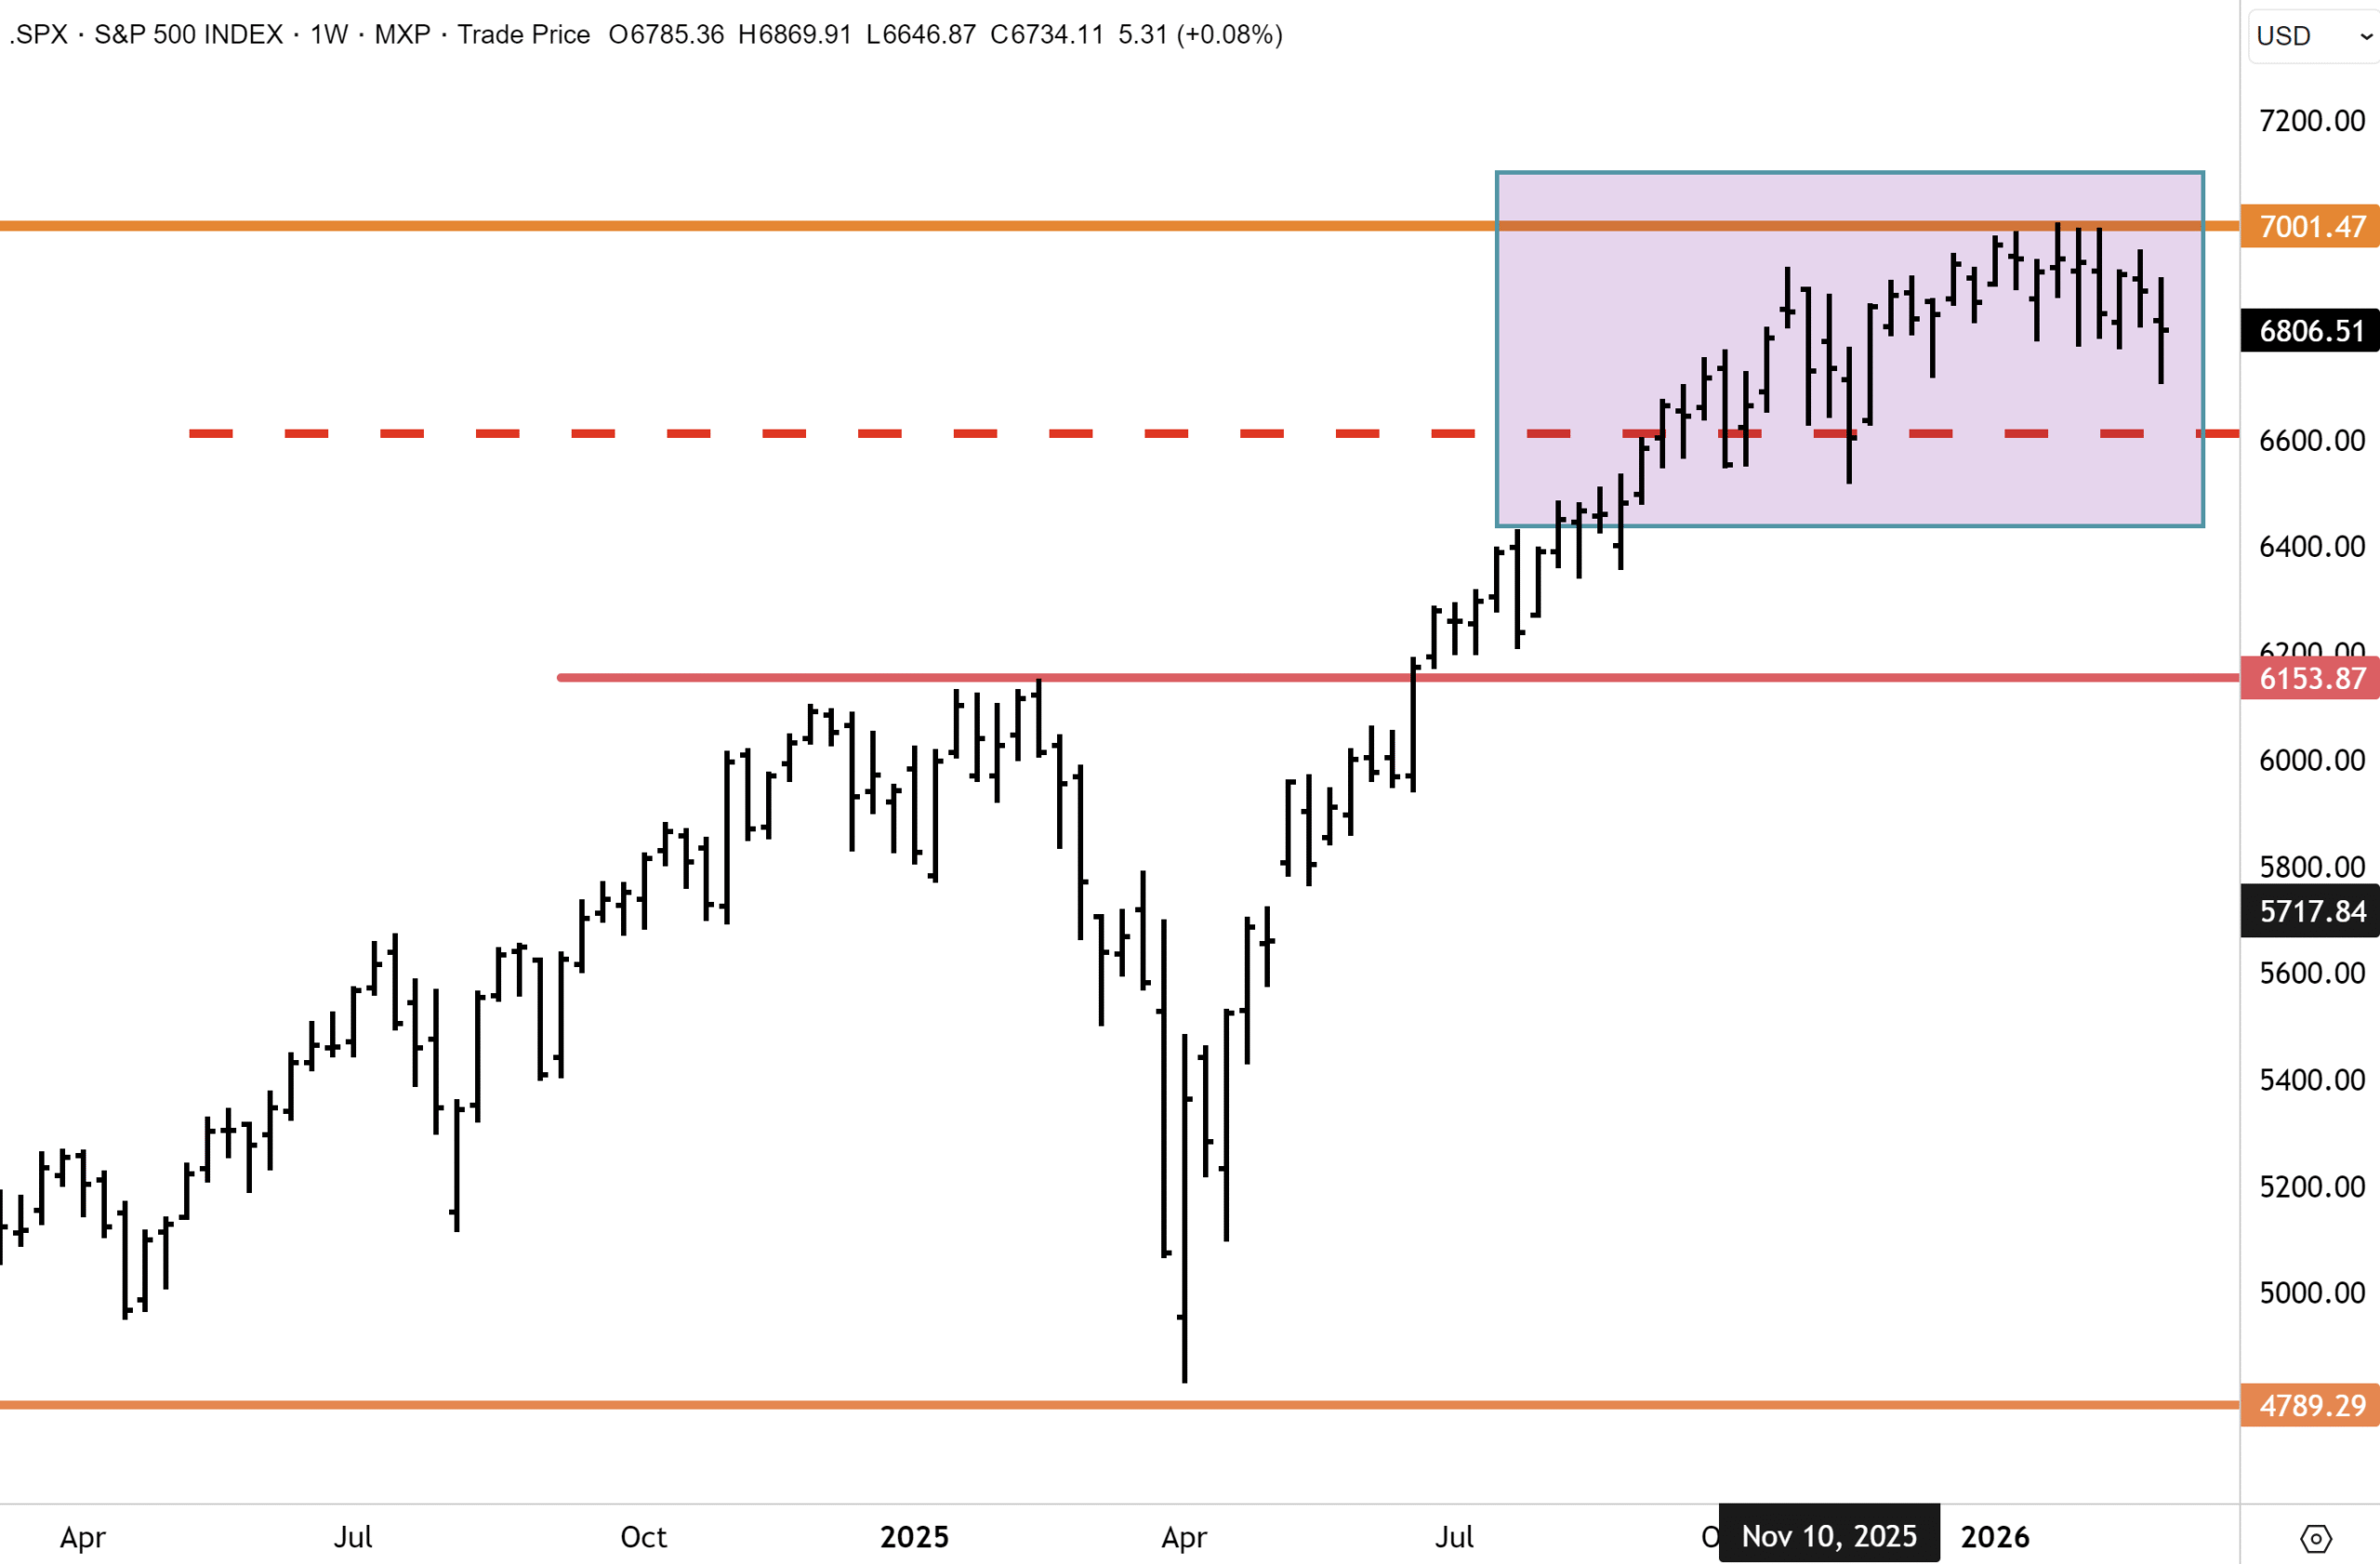
- The week’s most important signal wasn’t on an equity screen: the US 30-year Treasury yield rose just 16 basis points. Bond markets delivered a quiet verdict that the shock is temporary
- The VIX peaked at 28 and turned lower, well below the pandemic (90), yen carry unwind (65), and Liberation Day (60), suggesting the acute fear phase is likely behind us
- RBA Governor Bullock talked tough at the AFR Business Summit, leading markets to repricing March hike probability higher and fully price a May 25bp move
- Australia’s Q4 GDP came in at +0.8%, beating the consensus of +0.5%
- The ASX February reporting season delivered a “better than feared” verdict. Banks were solid, miners strong, with BHP reaching an all-time high and claiming Australia’s largest market cap crown. We continue to like copper as a key metal for the coming years.
- US Q4 earnings season wrapped with 14.2% blended growth, record 13.3% net margins, and full-year 2026 EPS estimates raised.
- Australia’s property market is running a two-speed story: Perth surged 2.3% in February (+22% annually) while Sydney was flat and Melbourne dipped.
REPORT SPOTLIGHT
- St Barbara (ASX: SBM): Development play with two very valuable projects that are game changers that are on the go.
WHAT TO WATCH
- US non-farm payrolls (Friday morning, NY time). Consensus near 70,000, a sharp deceleration; a weak print revives rate-cut expectations, a strong one confirms Fed patience and adds to the oil-inflation narrative
- Strait of Hormuz / oil trajectory: Saudi Red Sea rerouting is a partial workaround, not a solution; daily tanker flow data and any update on the US military escort programme will move oil
- Iran diplomatic back-channel: Any confirmation of substantive talks is a material positive for energy-sensitive markets
- RBA March 17 meeting: Watch for any interim RBA communication ahead of the meeting; rate-sensitive ASX sectors remain exposed
- China NPC follow-through: Detailed budget and fiscal measures due
- VIX second test: The fear gauge held below 28 on Thursday’s second test

Markets have been volatile this week, with risk-off sentiment dominating, albeit not as badly as it could have been.
The US and Israel’s launch of strikes on Iran has triggered a sharp repricing in the energy markets, with important second-order effects for global markets. Iran responded by targeting Gulf energy infrastructure and disrupting tanker traffic through the Strait of Hormuz, and that second move is what spooked markets far more than the military strikes themselves.
The Strait of Hormuz is a 33-kilometre-wide chokepoint between Iran and Oman through which roughly 20% of the world’s daily oil supply passes. There is no easy alternative. Saudi Arabia can reroute some crude via its East-West pipeline to Red Sea terminals, which it began doing this week, but not enough to offset a sustained closure. A fully blocked Hormuz for an extended period would send oil much higher, and threaten to detonate inflation across a wide range of energy-importing economies. For example, Japan is a major energy importer, so it was vulnerable this week.
Markets spent four days deciding whether that scenario was plausible. Their conclusion, delivered through price action rather than proclamation, was that it wasn’t, at least not yet. The VIX peaked at 28 and retreated. The US 30-year Treasury added only 16 basis points across the entire week despite WTI surging $14 per barrel. Both signals say the same thing: temporary disruption, not structural rupture.
Still, the surge in the price of oil sparked another selloff on Wall Street on Thursday. Equities in both the US and Europe fell on concerns that oil prices surging above $80 will reignite inflation. The US-Israeli war on Iran waged for a sixth day with little sign of easing, and as energy prices lifted to multi-year highs, with little sign that the conflict is going to end soon. The disruption to crude flows here is key, but on that front, I believe oil markets are now showing signs of being overbought. Euro sovereign bond yields rose sharply while US treasuries were once again much more contained. The VIX surged 15% to 24 but has yet to take out this week’s spike high of 28. Meanwhile, the US dollar rallied, and precious metals slid once again following the relief rally yesterday.
Meanwhile, the Trump administration is weighing a range of options for addressing the spike in oil and gasoline prices amid the war in Iran. A global bond rout showed no respite, with the 10-year Treasury yield rising for a fourth straight day on concern that higher oil prices will fuel inflationary pressures that could hinder the Federal Reserve’s ability to cut rates. But the rise has been very muted (I discuss this below) relative to the seismic shift in European bond markets.
Here are some of the key moves from Thursday and over the past week (note that our FatWrap is put together on Friday morning before the markets resume trading).
In the run-up to the payrolls report (due later today), data showed jobless claims are settling near some of the lowest levels in the last year amid a low-firing environment. Markets are bracing for a strong number that could push back on the Fed rate cut narrative.
The consensus is near 70,000, a sharp deceleration from prior months, against the backdrop of Thursday’s jobless claims data showing a low-firing environment but rising continuing claims. A weak print would revive rate-cut expectations and provide equity markets with a convenient narrative to rally into the weekend; a strong print confirms the Fed’s patience and adds to the oil-inflation-persistence argument. Watch the wage data in particular: unit labour costs already printed 2.8% in Q4, above expectations, and another strong wage reading alongside soft payrolls would present the Fed with a dilemma.
In other news, Fed official Tom Barkin said the central bank’s response to the war will depend on how long the impact on the economy lasts. In commodities, precious metals weakened on the stronger dollar.
In commodities, precious metals weakened on the stronger dollar. Gold fell 0.9% to $5,100, while silver and platinum gave up around 1.8%. Copper declined 1.5% to $5.81. Oil prices surged with WTI climbing above $81 for the first time since early 2024. Brent had a similar move, rising 4.5% to $85. Assuming the conflict is resolved over the coming weeks (which is my base case), the spike in oil will likely prove transitory. However, the caveat is that oil joins the other commodities in what is shaping up to be a new super cycle. Oil has lagged many other commodities for some time, and my view is that the gap will close later this year. Presently, there is a massive ME risk premium priced in, which could quickly dissipate, but I don’t see WTI or Brent going below the levels of a month ago.
Energy exposure earned its keep this week. WTI crude’s move reflected a genuine, if potentially temporary, supply disruption. The technical setup for oil skewed to the upside before US and Israeli strikes on Iran.
Gold’s corrective week was, on balance, healthy. The metal gave up its initial safe-haven gain as the dollar surged, but found support above $5,000oz, and the structural bid from central bank demand remains intact. The prior high at $5,600 is the medium-term target.

US and European stocks fell on Thursday after the US WTI oil price surged above $81 a barrel. This clearly spooked most facets of the stock market, as oil approaches the market’s pain threshold, which is likely now north of this number. US benchmarks declined and reversed yesterday’s gains, while the VIX fear gauge surged 17.8% to 24.8. On the surface, some investors are beginning to panic about the headline price of crude oil. Brent crude went above $85, and the US dollar index lifted 0.5%.
Gold, other precious metals, and major FX currencies also sold off and corrected lower. European bonds (being much more energy sensitive) were, however, the largest casualty, and yields jumped sharply across continental Europe. Ten-year maturities in Germany, the UK, France, Spain, Italy and France were all sold lower with yields sharply higher by between 10 and 13 bps. Yet the US bond market was once again fairly well contained.
In the US, trading in the bond market was much less disorderly than the fallout in Europe. Yields rose between 3 and 4 bps on the 2yr to 10yr tenures, but were little changed at the long end of the curve. Aside from the VIX failing to take out this week’s peak above 28, this was, in my view, telling….US financial markets are continuing to look through the current war going on in the Middle East to stability on the other side.
The “long end of the tail”…wags the dog in terms of the bond markets’ sensitivity to inflation…or to put it another way, when inflation stirs, the long end of the curve, meaning bonds with long-term duration, such as the 30yr feel the pinch the hardest.
The super sensitive “long end of the curve” – the US 30 yr treasury – that is positioned in the largest and most important bond market in the world, more-or-less has shrugged off inflationary risks around higher oil prices and barely moved this week. On Thursday, the yield on the US 2yr added 3bps to 3.58%, the US 10yr rose 3 bps to 4.13%, while the 30yr was little changed at 4.74%.
The muted reaction in the bond market is revealing – since the onset of the ME war over the weekend, the yield on the 30yr has risen from 4.6% on Monday to 4.76%, reflecting an upward move of 16 bps.

Over the same time, WTI crude has jumped from jumped from $67 last week to $81 on yesterday. That represents one of the biggest intraweek moves in crude markets in quite some time. However, the reaction in financial markets – and pertinently the longer dated, ultra inflationary sensitive 30yr treasury bond yield has been a minor upward adjustment of 16 bps. The rise in the 2yr and 10yr has not been much greater. The US2yr and US10yr both increased 20bps.

Coupled with VIX, or “fear gauge” hitting a ceiling this week of 28 and presently at 24, and the key US benchmark – the S&P500 not yet collapsing below key support levels, and as at the end of this week, remaining range bound, I hold the view that financial markets are looking for a quick end to the war, that the White House wants “regime recalibration” in Iran, not “regime change”, and that with the mid-term elections rapidly approaching, the focus of the Trump Administration will soon turn to delivering rate cuts to boost the domestic economy.
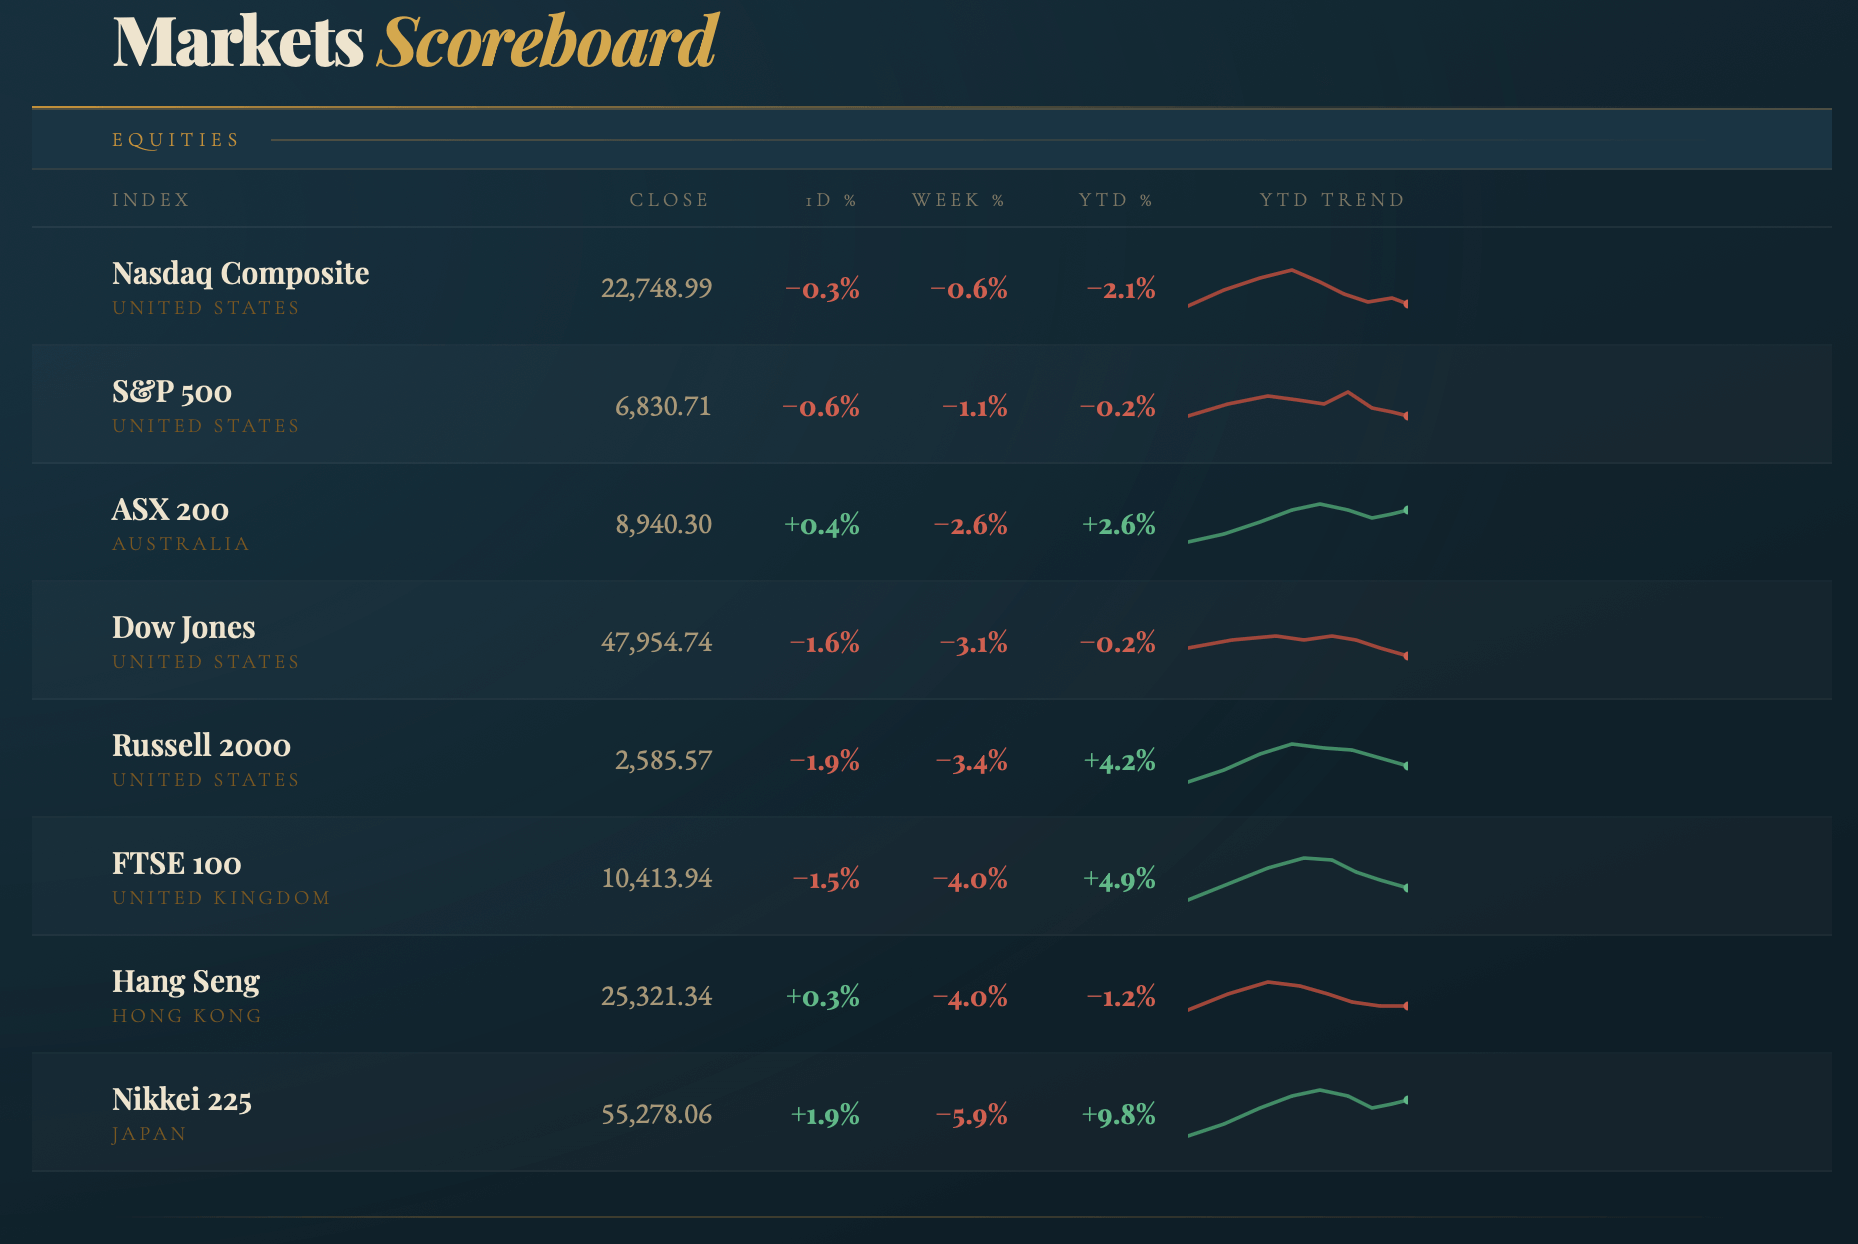
The S&P500 has yet to break below support at the bottom of the range near 6,600 and remains almost at the midpoint within the range that extends back to mid 2025.
The VIX, or “fear gauge,” is a key signal this week. The “long end of the tail” in bond markets has more or less shrugged off inflationary risks – but it is the VIX that most clearly tells us where traders and investors have settled their collective view on the severity of this geopolitical shock.
During the Pandemic, the VIX hit 90 – a historic record, when the markets collectively priced the global economy falling into the abyss. The last two big drawdowns occurred more recently: the 2024 Japanese yen carry trade unwind sparked mayhem and widespread dislocation, with the VIX spiking to 65; and Liberation Day in 2025, where the VIX hit 60. This week, the VIX failed to breach 28. On Wednesday, the fear gauge fell 10% to 21 and was up again on Thursday, but only to 24. Once again, this is a key signal that the acute response phase of financial markets to the Middle East war may already be priced in.
Goldman Sachs Chairman David Solomon said at the AFR Business Summit that he wasn’t surprised to see the VIX climb, and that “it’s going to take a couple of weeks for markets to really digest the implications.” I disagree. The market, in my opinion, has already done the heavy lifting in terms of de-risking. Two intraday rejection dynamics off the lows each day, combined with the VIX failing to breach 28 on multiple occasions, tells a different story from the one Mr Solomon is telling.
Barring another left-field incident, there is a good chance the VIX has already seen its peak. We might not be completely out of the woods – there will likely be further incidents around the ME war, the Strait of Hormuz, and oil prices that cause concern. But the worst phase that has impacted financial markets this week is, in my view, likely behind us.
I tend to agree with Mr Solomon being surprised at the benign reaction by the markets this week – it could have been much worse. But I disagree with him completely in terms of his outlook. The market, as a consensus, must always be respected. In terms of price action, market internals often move well ahead of where the consensus thinking is at. The key point here is that it is entirely plausible the market has already worked out where the ME war is headed and what the outcome will be.
While the US guaranteeing military escorts to keep shipping lanes open in the Strait of Hormuz has lifted sentiment and helped steady the markets, the real question is over US policy and what outcome the White House is intently focused on securing. I believe the market is sensing that the goal of the Trump Administration is more benign than “regime change”. This might explain why the price action of the US (and European benchmarks) was much better than expected this week and certainly on Wednesday.
Mr Solomon then said, “he wasn’t surprised to see the VIX Index and other volatility measures climb. It’s going to take a couple of weeks for markets to really digest the implications.” Again, I disagree with Mr Solomon and am more surprised that the VIX didn’t spike higher – hitting 28 was a muted reaction to the ME war, when considering what has occurred in previous market panics.

Returning to some different perspectives on the markets, I listened to JP Morgan Chase CEO Jamie Dimon this week on CNBC, and he sees the conflict in the ME blowing over in the coming weeks, and not being a risk or threat to financial markets and the economy, “unless it’s prolonged”. Mohamed El Erian also made this point, where elevated energy prices lead to higher inflation.
Morgan Stanley’s CIO Mike Wilson also sees the ME conflict dying down quickly and that it would take an oil price above $100 a barrel to negatively impact the stock market and economy. “That would put oil’s year-over-year gains in the 75%-100% range, which has historically marked a tipping point for stocks. But until then, investors don’t have to stress about how the oil picture might complicate the outlook”.
Mr Wilson also noted that “historically, geopolitical risk events haven’t led to sustained volatility for equities. In fact, 1/6/12 months post these occurrences, the S&P 500 has been up 2%/6%/8%, on average. The bear case scenario for stocks related to this past weekend’s events in Iran and across the Middle East would be if oil prices were to rise sharply/persistently, thereby posing a risk to the duration of the business cycle.”
WTI crude has broken out above near-term resistance at $68 but has yet clear the topside of the primary downtrend in place since the 2022 highs. However, the technical setup for oil is far from bearish, and if anything, a topside breakout and sustained advance higher is potentially on the cards this year. As discussed previously, many of the major diversified energy majors pre-empted this week’s move in crude markets. Exxon Mobil has been one of the strongest performers this year, with other majors such as Shell, BP, Occidental and Woodside all exhibiting bullish technical setups.
Mr Wilson said that increases to crude prices so far are “modestly positive. Thus, unless oil prices spike in a historically significant manner and remain elevated, recent events are unlikely to change our bullish view on US equities over the next 6-12 months.” Mr Wilson posted a chart showing that US recessions have typically started when oil prices surge by 75%-100% year over year. When recessions strike, US consumers tend to pull back on spending, hurting corporate earnings and sending stocks lower.

Source: Morgan Stanley
But the leading US strategist analyst appears to be more relaxed about the US economy being in a new, early-stage business cycle, with the financial markets being underpinned by solid earnings and with the rally broadening out to cyclical and more value-oriented (old school) sectors. “We believe we’re in an early cycle environment today as the earnings recovery accelerates. In addition, the year-over-year rate of change on crude was just modestly in positive territory. Thus, unless oil prices spike in a historically significant manner and remain elevated, recent events are unlikely to change our bullish view on US equities over the next 6-12 months.” Mr Wilson also believes the market will soon look through the AI disruption debate.
These are fair points, but oil prices could in fact extend higher this year on further disruption, despite a widely perceived looming supply glut. However, Morgan Stanley is correct in that damage and accompanying inflationary fallout to the global economy is unlikely unless crude prices push beyond $80 a barrel. Further escalation in the Persian Gulf could see oil prices quickly do this.
The US dollar has surged significantly this week and is being seen as a safe haven trade, which often happens during times of war. The stronger dollar this week has taken a toll on commodities, gold & precious metals, and emerging markets, which were all down sharply yesterday. European stocks also came under severe pressure. Meanwhile, bonds were shunned around the world as a haven as yields rose, with the notable exception of the US, where the yield curve was little changed. Rising energy prices bring inflationary risks back into focus, which is kryptonite to the bond market.
For now, financial market volatility will continue as risk is taken off the table. There is at present no clear-cut, defined off-ramp to de-escalate the ME war. Expectations around timelines for de-escalation have extended from a near-consensus view of around 1 week on Monday to one month or potentially longer as of today. The US has yet to rule out a ground war, although I see this as a highly unlikely outcome.
A quick war?
However, with mid-term elections looming towards the end of the year in the US, the White House needs a quick outcome in the ME and cannot politically let this drag on, or spillover with a negative impact (higher inflation and energy prices) into the domestic economy. DJT needs a quick war, given the looming mid-term election. I also believe the White House wants “regime recalibration”, not “regime change”, and will definitely be fully reluctant to commit “boots on the ground in Iran.
Despite all that is going on with escalating global geopolitics, now is a time for pragmatism, and whilst acknowledging heightened volatility, we might soon see perceived risks dialled back quickly if the situation in the ME stabilises. This also seems to be the conclusion of US financial markets, which rallied once again into this morning’s close.
The good news is that for now, key US financial markets have more or less taken the dramatic turn of events in the ME and escalation of geopolitical pressures in relative stride, despite some moderate volatility. If crude oil begins “flowing” again through the Hormuz Strait chokepoint, then risk will be dialled back significantly.
I concede that my position and outlook for a quick end to the war and for oil prices to recede quickly in the coming weeks/next few months might be totally wrong. But having closely followed the reaction function in financial markets this week, I have conviction that the most acute phase of ME shock is now behind the markets. We selectively added to some key positions yesterday in core Chinese technology holdings yesterday, and I note the Nasdaq has this week outperformed the broader S&P500 and the Dow Jones after a harrowing time in February.
We also boosted our total portfolio exposure to copper, which has held up well this week and traded constructively in stress-laden markets (I truly hate to say this, but at a minimum, all those ballistic missiles and drones deployed this week will need to be replaced, and copper is a central component). The point I am trying to make here is that we deployed capital yesterday into the beaten-down China technology sector (which has held up well versus the US), after the price action showed relative outperformance against the major benchmarks. The same was true for US tech stocks, which have been at the centre of investor fears for over a month now, around AI disruption and displacement by new technology.
I believe the lows are now possibly in for many global technology stocks, and in particular, the companies that investors fear the most with respect to AI. I have conviction that most of the Chinese technology stocks we hold have now bottomed out, following the AI induced selloff in February, and that is where we have chosen to focus. I would also add that most of our technology holdings in China now have a well-established pattern of a series of higher reaction lows.
This is a bullish pattern and consistent with a new bullish cycle that is in the early stage of the second innings (bull markets can typically have multiple innings – the US, for example, arguably is in the 4th or 5th year depending on your perspective).
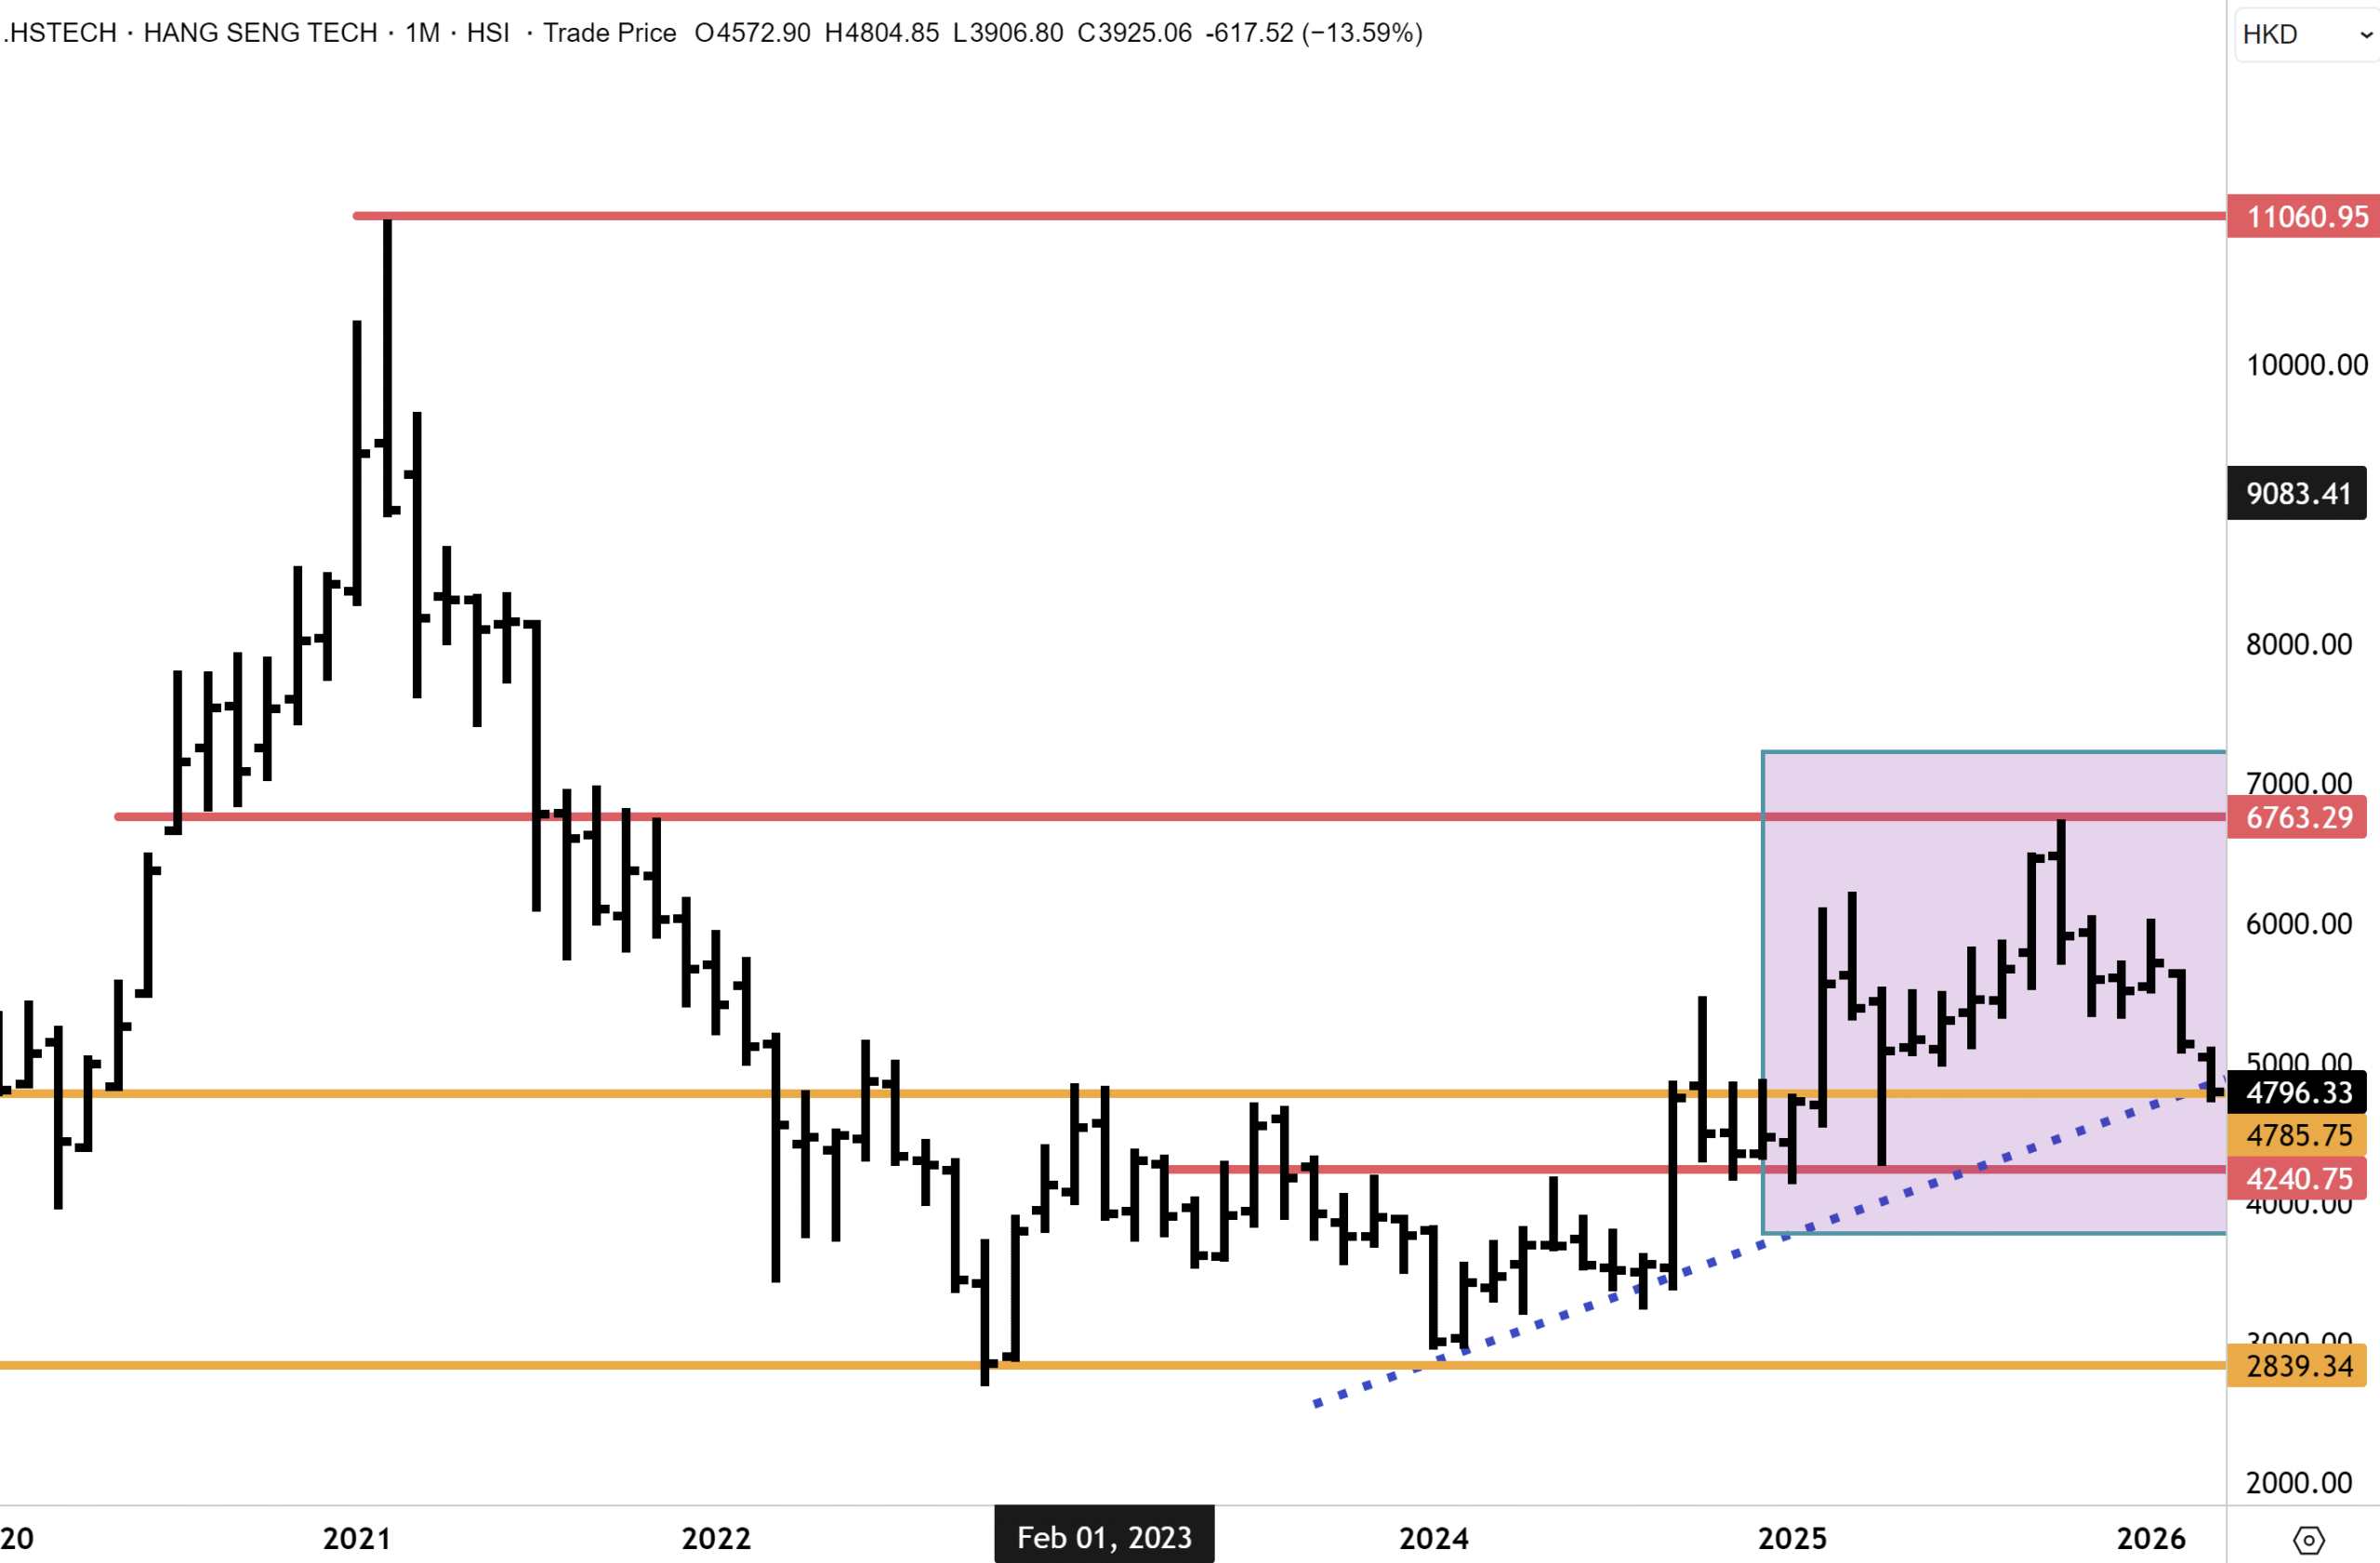
We were prominent in calling the end of the Chinese bear market back in 2024 when the PBOC commenced aggressive easing. I have a strong opinion that the severe bear market that commenced in 2021, when the property bubble popped, actually ended in September 2024 when the key benchmarks confirmed a double bottom. Back then, the world considered Chinese equities as “un-investible”, and the Government caved in amidst a depressed domestic economy, and pivoted to prioritising the economy.
President Xi, around that time, finally recognised the value inherent in the private sector (before that point, the Xi government was on a witch hunt to rein in the corporate sector, which had flourished during the previous bull market).

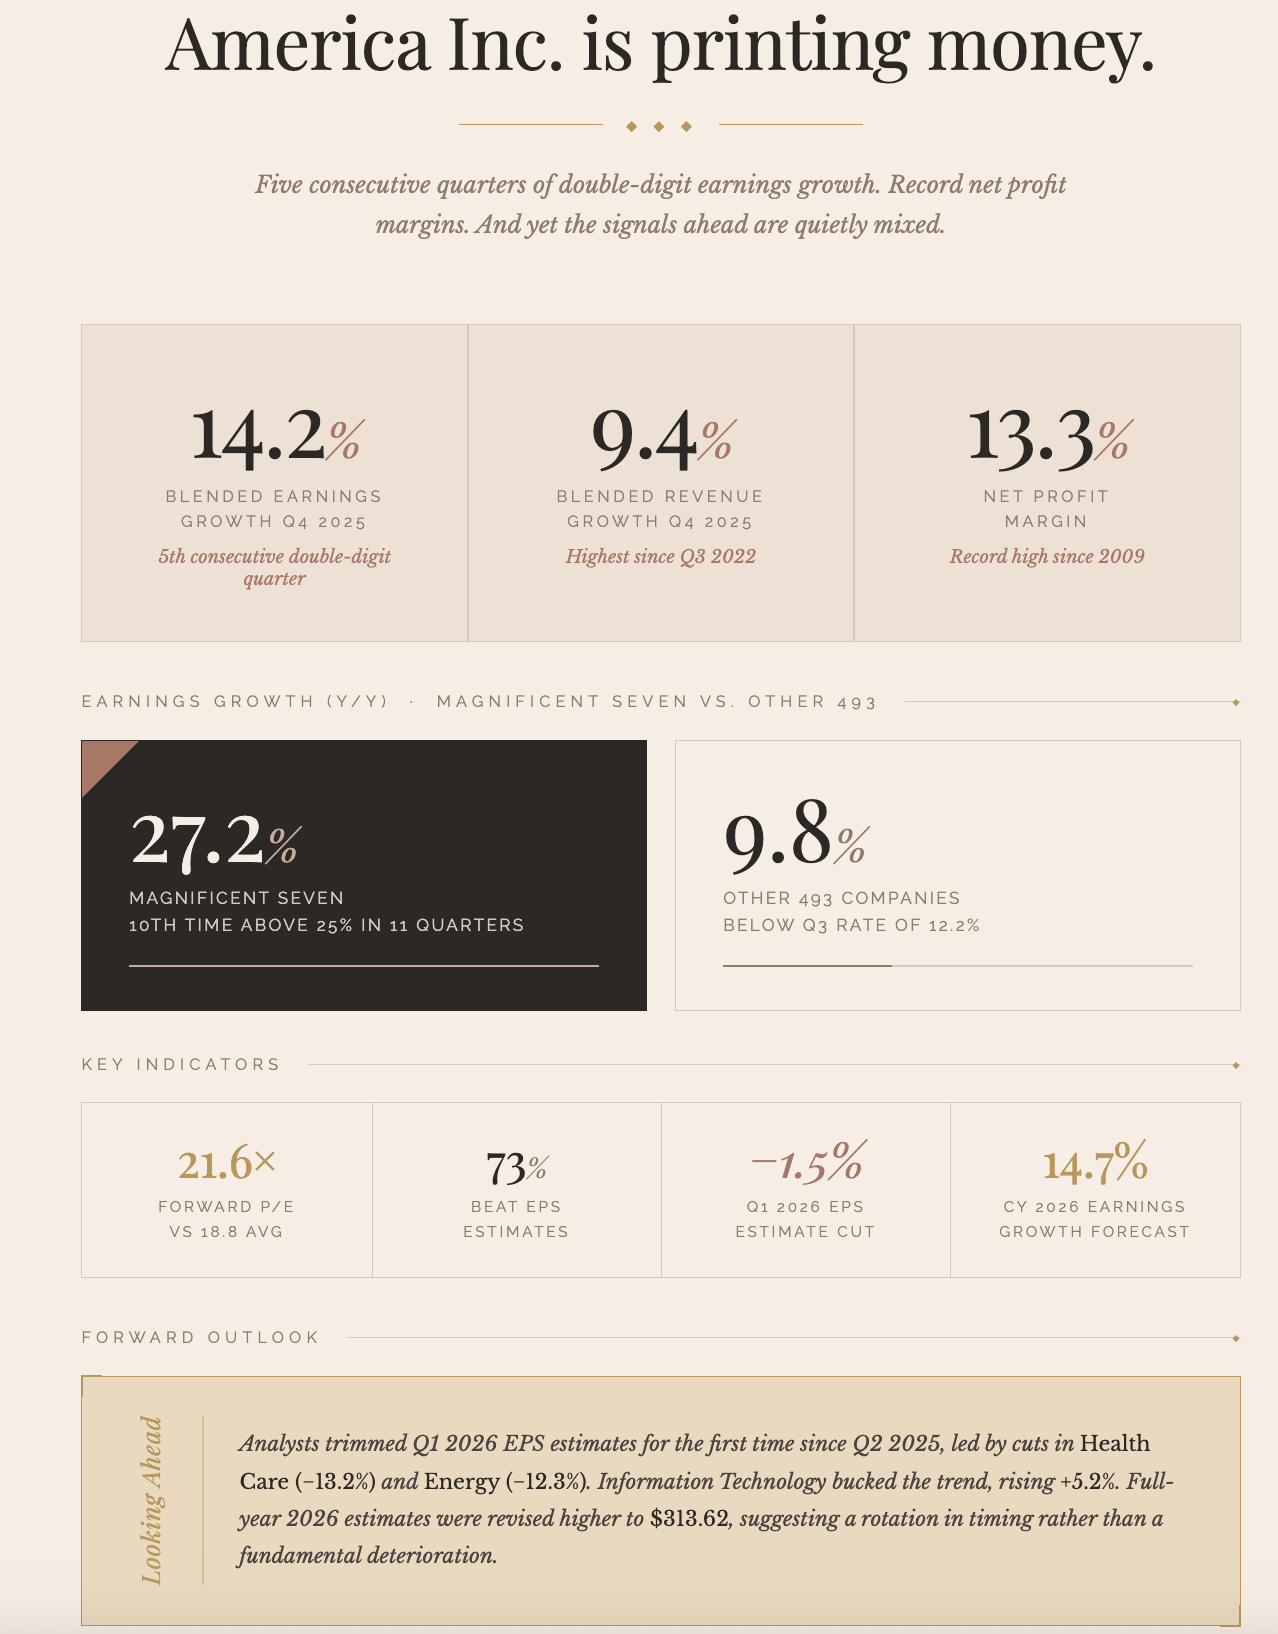
The US reporting season is winding up, but overall, the corporate sector delivered a solid performance. American corporate earnings delivered a fifth consecutive quarter of double-digit growth in 4Q25. According to FactSet data, after 96% of the S&P 500 have reported, the blended earnings growth rate is 14.2%, with revenue growth of 9.4%, the strongest top-line result since 3Q22. Net profit margins hit 13.3%, a record high since FactSet began tracking the metric in 2009.
The Mag 7 is still dominant. These seven companies grew earnings 27.2% for the quarter, marking the tenth time in eleven quarters they have delivered above 25% growth. The remaining 493 companies managed a solid but considerably more modest 9.8%. Remove NVIDIA alone from the Information Technology sector, and that sector’s blended growth rate drops from 33.4% to 24.8%.
Source: Chart is based on FactSet data
The Industrials sector’s headline number of 26.7% growth is a little misleading. Boeing and GE Vernova, between them, contributed billions in one-off gains from an asset sale and a tax release, respectively. Strip those out, and Industrials would actually be marginally negative.
On the scorecard, 73% of companies beat earnings estimates, which sounds impressive until you note it is below both the five-year average of 78% and the ten-year average of 76%. Revenue beats were more encouraging, with 73% topping estimates, above both long-run averages. Companies are genuinely bringing in more revenue through some combination of higher volumes, new products/services and higher prices in many instances.
Looking ahead, while Q1 estimates were cut, analysts raised their EPS projections for Q2, Q3 and Q4 of 2026, and the full-year 2026 bottom-up EPS estimate actually rose 0.8%, to $313.62. This means analysts are projecting 14.7% EPS growth in CY2026 on 7.7% revenue growth.
The earnings cycle remains healthy. Again, according to the FactSet data, the forward 12-month P/E ratio for the S&P 500 stands at 21.6, above the five-year average of 20.0 and well above the ten-year average of 18.8. Bulls can take comfort that the multiple has actually compressed slightly since year-end, as earnings estimates have risen faster than prices, a healthy dynamic if it continues.
I also note that stock performance has been broadening nicely. Although the S&P500 posted a slightly negative performance in February, the equal-weighted S&P500 index was up circa +3%, logging a fourth straight gain. We are on record as expecting other pockets of the market to do some of the heavy lifting when it comes to driving the US market performance in 2026.

RBA governor Michele Bullock was a downer early in the week, while speaking at the AFR Business Summit. Ms Bullock explicitly rejected the market’s long-held assumption that the RBA board would wait for quarterly inflation data before moving on rates. The declaration that every meeting was “live”, coming just weeks after the RBA lifted the cash rate to 3.85% in February to contain a renewed pickup in inflation, was read by the market as a signal that a back-to-back hike in March was still on the table.
The probability of a move at the March 17 meeting repriced from roughly 21% to 33%, and a 25bp increase by May is now fully priced. By year-end, traders have pencilled in 47bp of further tightening (effectively two additional hikes), up from 36bp the prior week. Australia’s three-year bond yield surged 13 bps to 4.31%, with the rate-sensitive end of the equity market (real estate, technology, and consumer discretionary) taking a hit.
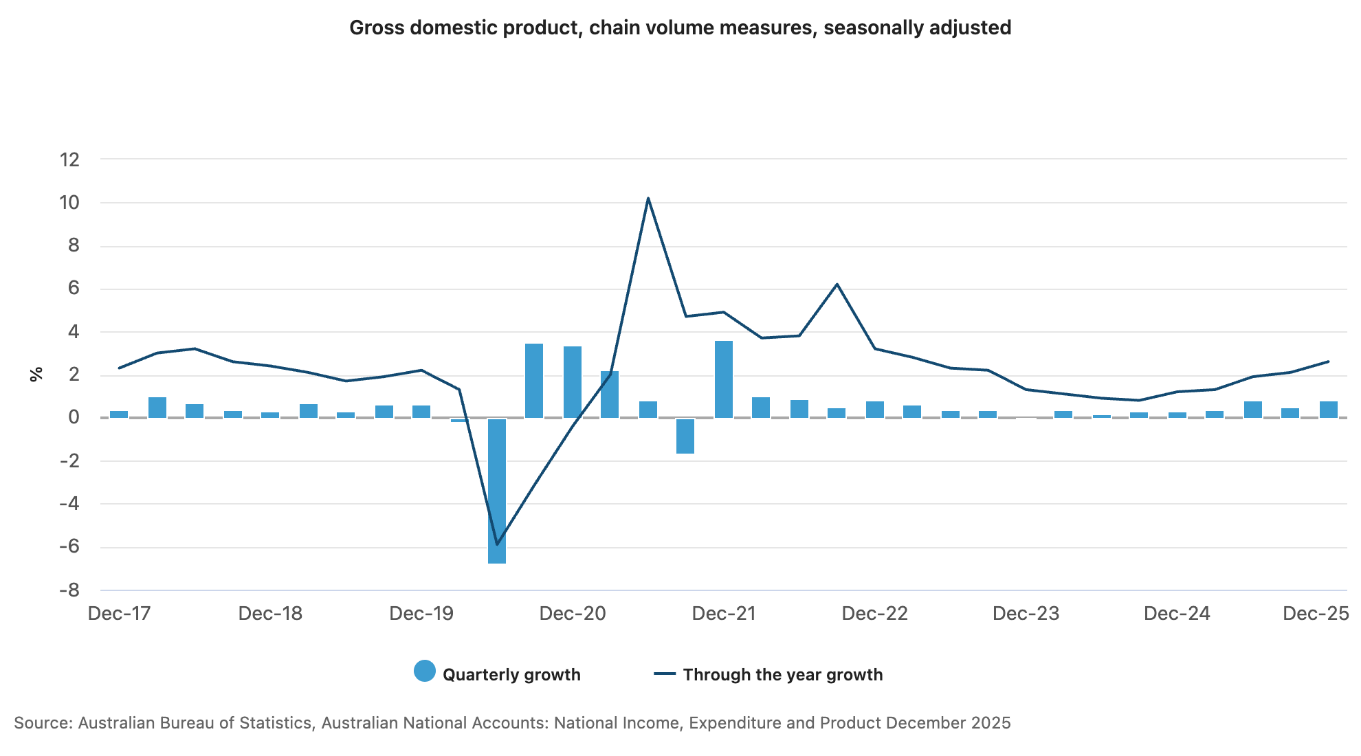
Australia’s economy expanded +0.8% in the December quarter, accelerating from an upwardly revised +0.5% in Q3 and marking the 17th consecutive quarter of growth. Annual GDP rose +2.6%, well above the +2.2% consensus forecast and the fastest yearly pace in nearly three years. The detail beneath the headline was broadly constructive.
Household consumption contributed positively, private investment rose +0.7% with elevated spending on data centres and aircraft, and government outlays added to momentum through both spending and transport infrastructure. Net trade was the lone drag, with imports growing faster than exports. Encouragingly, GDP per capita has turned higher, rising around +0.4% QoQ and +0.9% over the year as real incomes picked up while the household savings ratio rose to 6.9%, the highest since mid-2022. The bottom line, the GDP beat was much better than expected and would have been received well, but for the tide of selling on Tuesday.
Australian Property Update: A Two-Speed Story
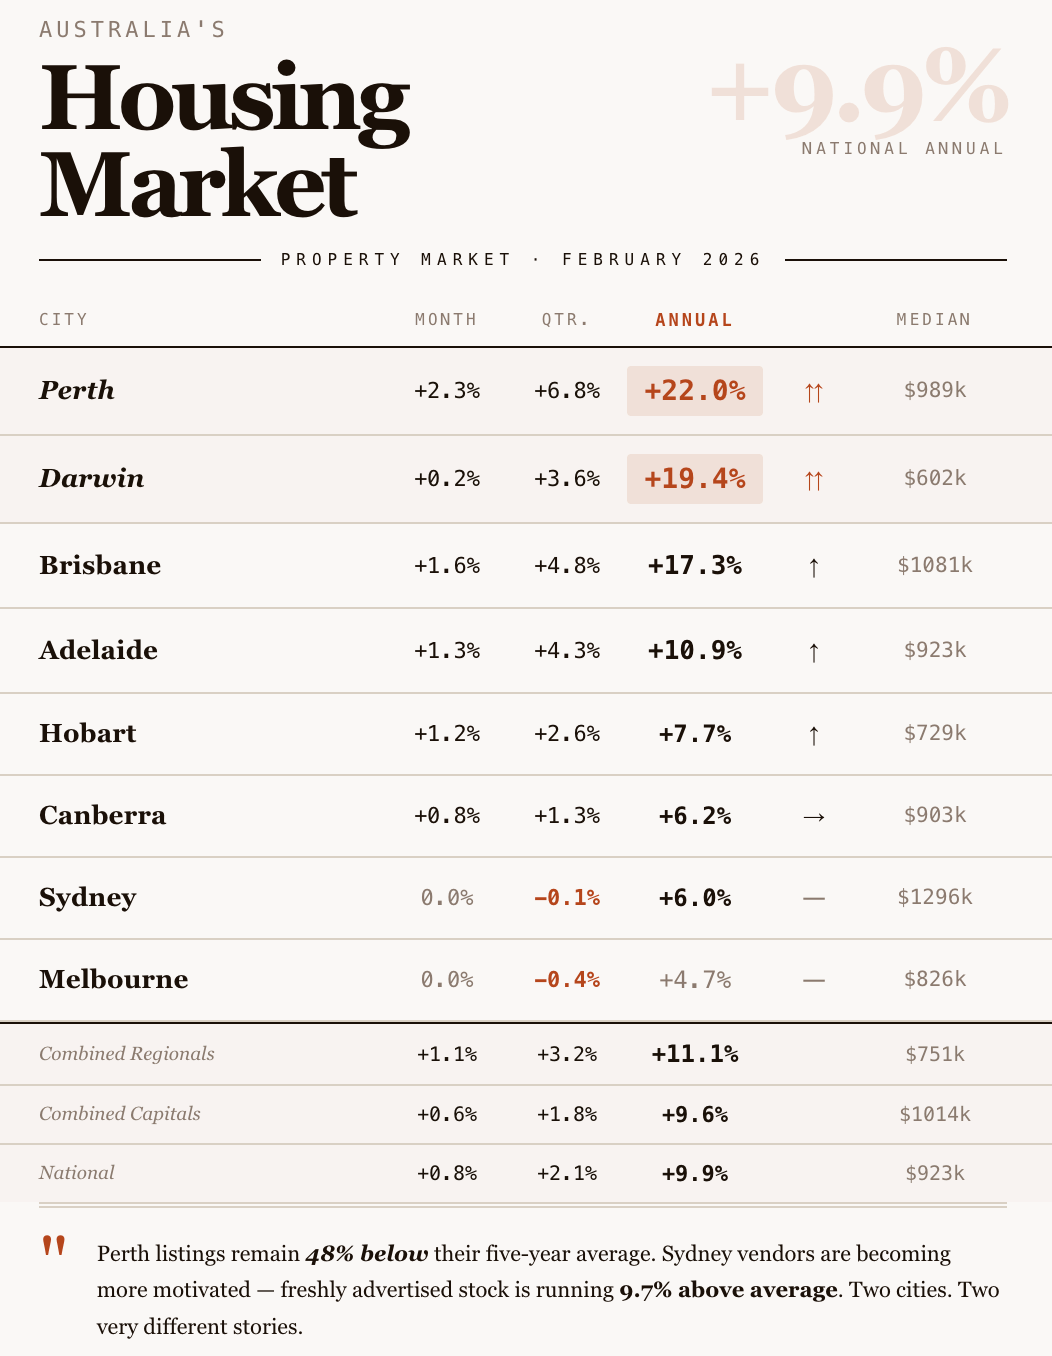
The numbers are in, and Australia’s property market has split into two halves. One half is where momentum remains alive and kicking, and another where the February rate hike is doing some crimping. National dwelling values rose 0.8% in February to a median of $922,838, up 9.9% over the year. Sounds strong, right? Look closer, and a more interesting picture emerges.
Perth home values surged 2.3% in a single month, adding more than $22,500 to the median dwelling value in February alone. Annually, Perth is up 22%, and the total return, including rent, sits at an eye-watering 27.1%. Brisbane (+17.3% annually) and Darwin (+19.4%) aren’t far behind. The driver is the housing supply. Perth listings are sitting 48% below their five-year average. Brisbane is 31% below. Adelaide, 23% below.
Meanwhile, Sydney housing was flat in February, and Melbourne dipped marginally. Both are now negative over the rolling quarter (-0.1% and -0.4% respectively). A few things are converging at once. The February rate hike likely knocked confidence a little. New listings in Sydney are running nearly 10% above their five-year average, and Melbourne is 12% higher.
Vendors are getting motivated, sensing conditions such that they’d rather sell now than wait. The affordability ceiling is also biting hard at the top end. Sydney’s lower-quartile houses rose 0.8% in February, while upper-quartile houses fell 0.9%. The average new mortgage is approaching $700,000.
Credit: Based on Cotality data
Regional Australia is, however, outperforming the capitals. Combined regionals rose 1.1% in February versus 0.6% for combined capitals, and the 12-month gap (11.1% vs 9.6%) is widening. Regional Queensland, WA and SA are among the standout performers. This isn’t just a lifestyle story anymore. It’s also about price points, internal migration flows, and the simple arithmetic of affordability. When you can’t service a $1.3 million Sydney mortgage, Tamworth (up 17.7% annually) or Toowoomba (up 20.4%) are better options for many if you can find work.
The Rental Market: Still Tight, But Yields Are Thin
Nationally, rents rose 5.5% over the year, accelerating to the fastest quarterly pace since April 2024. Darwin is running at 8.6% annual rental growth. Yet despite all this, the gross rental yield on a national combined capital dwellings sits at just 3.4%. That math is uncomfortable. As Cotality’s Research Director, Tim Lawless, notes, once you layer in mortgage repayments, maintenance, insurance and land tax, most investors entering the market today are cash-flow negative from day one. The strategy is entirely a capital growth bet.
I note too, the dwelling approvals data that dropped on Tuesday, tumbling 7.2% in January to a 19-month low of 14,564 units, a result that missed forecasts for a 5.5% rise and followed a 14.9% slump in December.

The weakness was concentrated in higher-density approvals, where private sector dwellings excluding houses fell 24.5%, while approvals for standalone houses continued to creep higher at +1.1%. The picture was uneven across state lines. Victoria shed -11.0% and South Australia -9.3%, while Western Australia bucked the trend with a 13.7% gain. On an annual basis, approvals are now down 15.7%, a data point that sits awkwardly alongside the RBA’s renewed hawkishness and those implications for the already-stretched construction pipeline.
The Takeaway
Australia’s housing market in early 2026 is tilting. Prices are holding, and in Perth, Brisbane and Adelaide, still running hard, but the foundations are quietly shifting. The February rate hike has already drawn a line between markets with supply constraints and those running on fumes. The approvals data suggest the pipeline that was supposed to eventually ease supply pressure isn’t coming anytime soon.
For investors and owner-occupiers alike, the key variables to watch are: whether further rate moves materialise (the February hike looks to have had an effect), whether Sydney and Melbourne’s new listing surge continues post-Easter, and whether the inventory constraint in Perth, Brisbane and Adelaide eases enough to take the heat out of those markets. Location, price point and yield discipline are firmly back on the table as they should always be.
The February reporting season has left the Station Down Under.

Australia’s February 2026 earnings season delivered results that were, on balance, much “better than feared”. This was despite some significant dispersion and extreme volatility for those companies that missed expectations. The ASX200 gained roughly +3.7% in February, the best month since last April’s rebound from the “Liberation Day” lows.
The reporting season in Australia had plenty of drama, though. The market response has become particularly violent to companies that miss expectations or provide underwhelming guidance. Downside volatility is often proving sharper than rallies, and stocks move quickly. This can create medium-term opportunities, despite feeling very painful for a retail investor.
The full magnitude of some of the falls often isn’t explained by the shift in the fundamental view of the update/guidance, but rather the systematic selling triggered by the initial move. In today’s fast-moving markets, there is a growing layer of funds that operate on ‘rules’ rather than judgment. Momentum strategies exit positions when price signals deteriorate past a threshold. Volatility-targeting funds mechanically reduce exposure when a stock’s daily move exceeds their risk parameters.
Options market makers who have sold downside protection to institutions must hedge their exposure by selling the underlying stock as it falls, automatically, and regardless of valuation. When a result disappoints and the stock gaps down sharply on open, all of these mechanisms can fire simultaneously, adding selling pressure that far exceeds the report content itself.
The investor implication cuts both ways. The post-result low is frequently not a reliable read of where the market has settled its fundamental view. Rather, it reflects the clearing price after programmatic selling has exhausted itself. The same can apply to stocks that surge, especially when they were heavily shorted heading into the results. Which means two things are worth keeping in mind. First, the initial panic creates noise that obscures the signal. Second, once that systematic pressure clears, the snapback in genuinely mispriced names can be swift.
Talking about the signals underneath the noise, there were a few worth noting. The major banks reported solid to impressive results across the board. Loan growth is running ahead of system, net interest margins have stabilised, and cost discipline has improved materially. The banks posted a strong double-digit percentage gain in February, providing a broad-based lift to the ASX200. Below we have put together a ‘League Table’ of many of the biggest movers and shakers based on the move around the day their respective reports dropped. It isn’t comprehensive, and we used + or -7% as a cutoff. Look out for the research team’s post-match report on the February 2026 season, which contains a more comprehensive review.

Another key driver was the miners, which all posted strong numbers across most of the board, led by BHP. The ‘big Australian’ moved to all-time highs and took the crown of the largest market cap in Australia, propelled by strong results from copper. Rio Tinto also benefited from a strong copper contribution, but not to the same extent due to changes in the overall metals mix, and the shares were modestly lower after reporting. Meanwhile, the gold miners reported supernormal profits as elevated gold prices pushed margins higher. Multiple names across our wealth management and research portfolios in this category enjoyed a strong February, including Evolution Mining, Vault Minerals and St Barbara, to name a few.
Consumer names held up better than many had anticipated entering the season. Woolworths, JB Hi-Fi and Super Retail all surprised to the upside, though market reactions reflected relief more than conviction. The underlying consumer environment remains one of selective spending, with cost-of-living pressures still present even as the worst appears to be passing. Elsewhere, there were sporadic winners and losers across the other sectors.
Telstra enjoyed a warm reception, as did Sonic Healthcare, Reece, Woolworths and WiseTech, among others. CSL, Treasury Wine, Domino’s and AMP were among those being ‘relegated.’

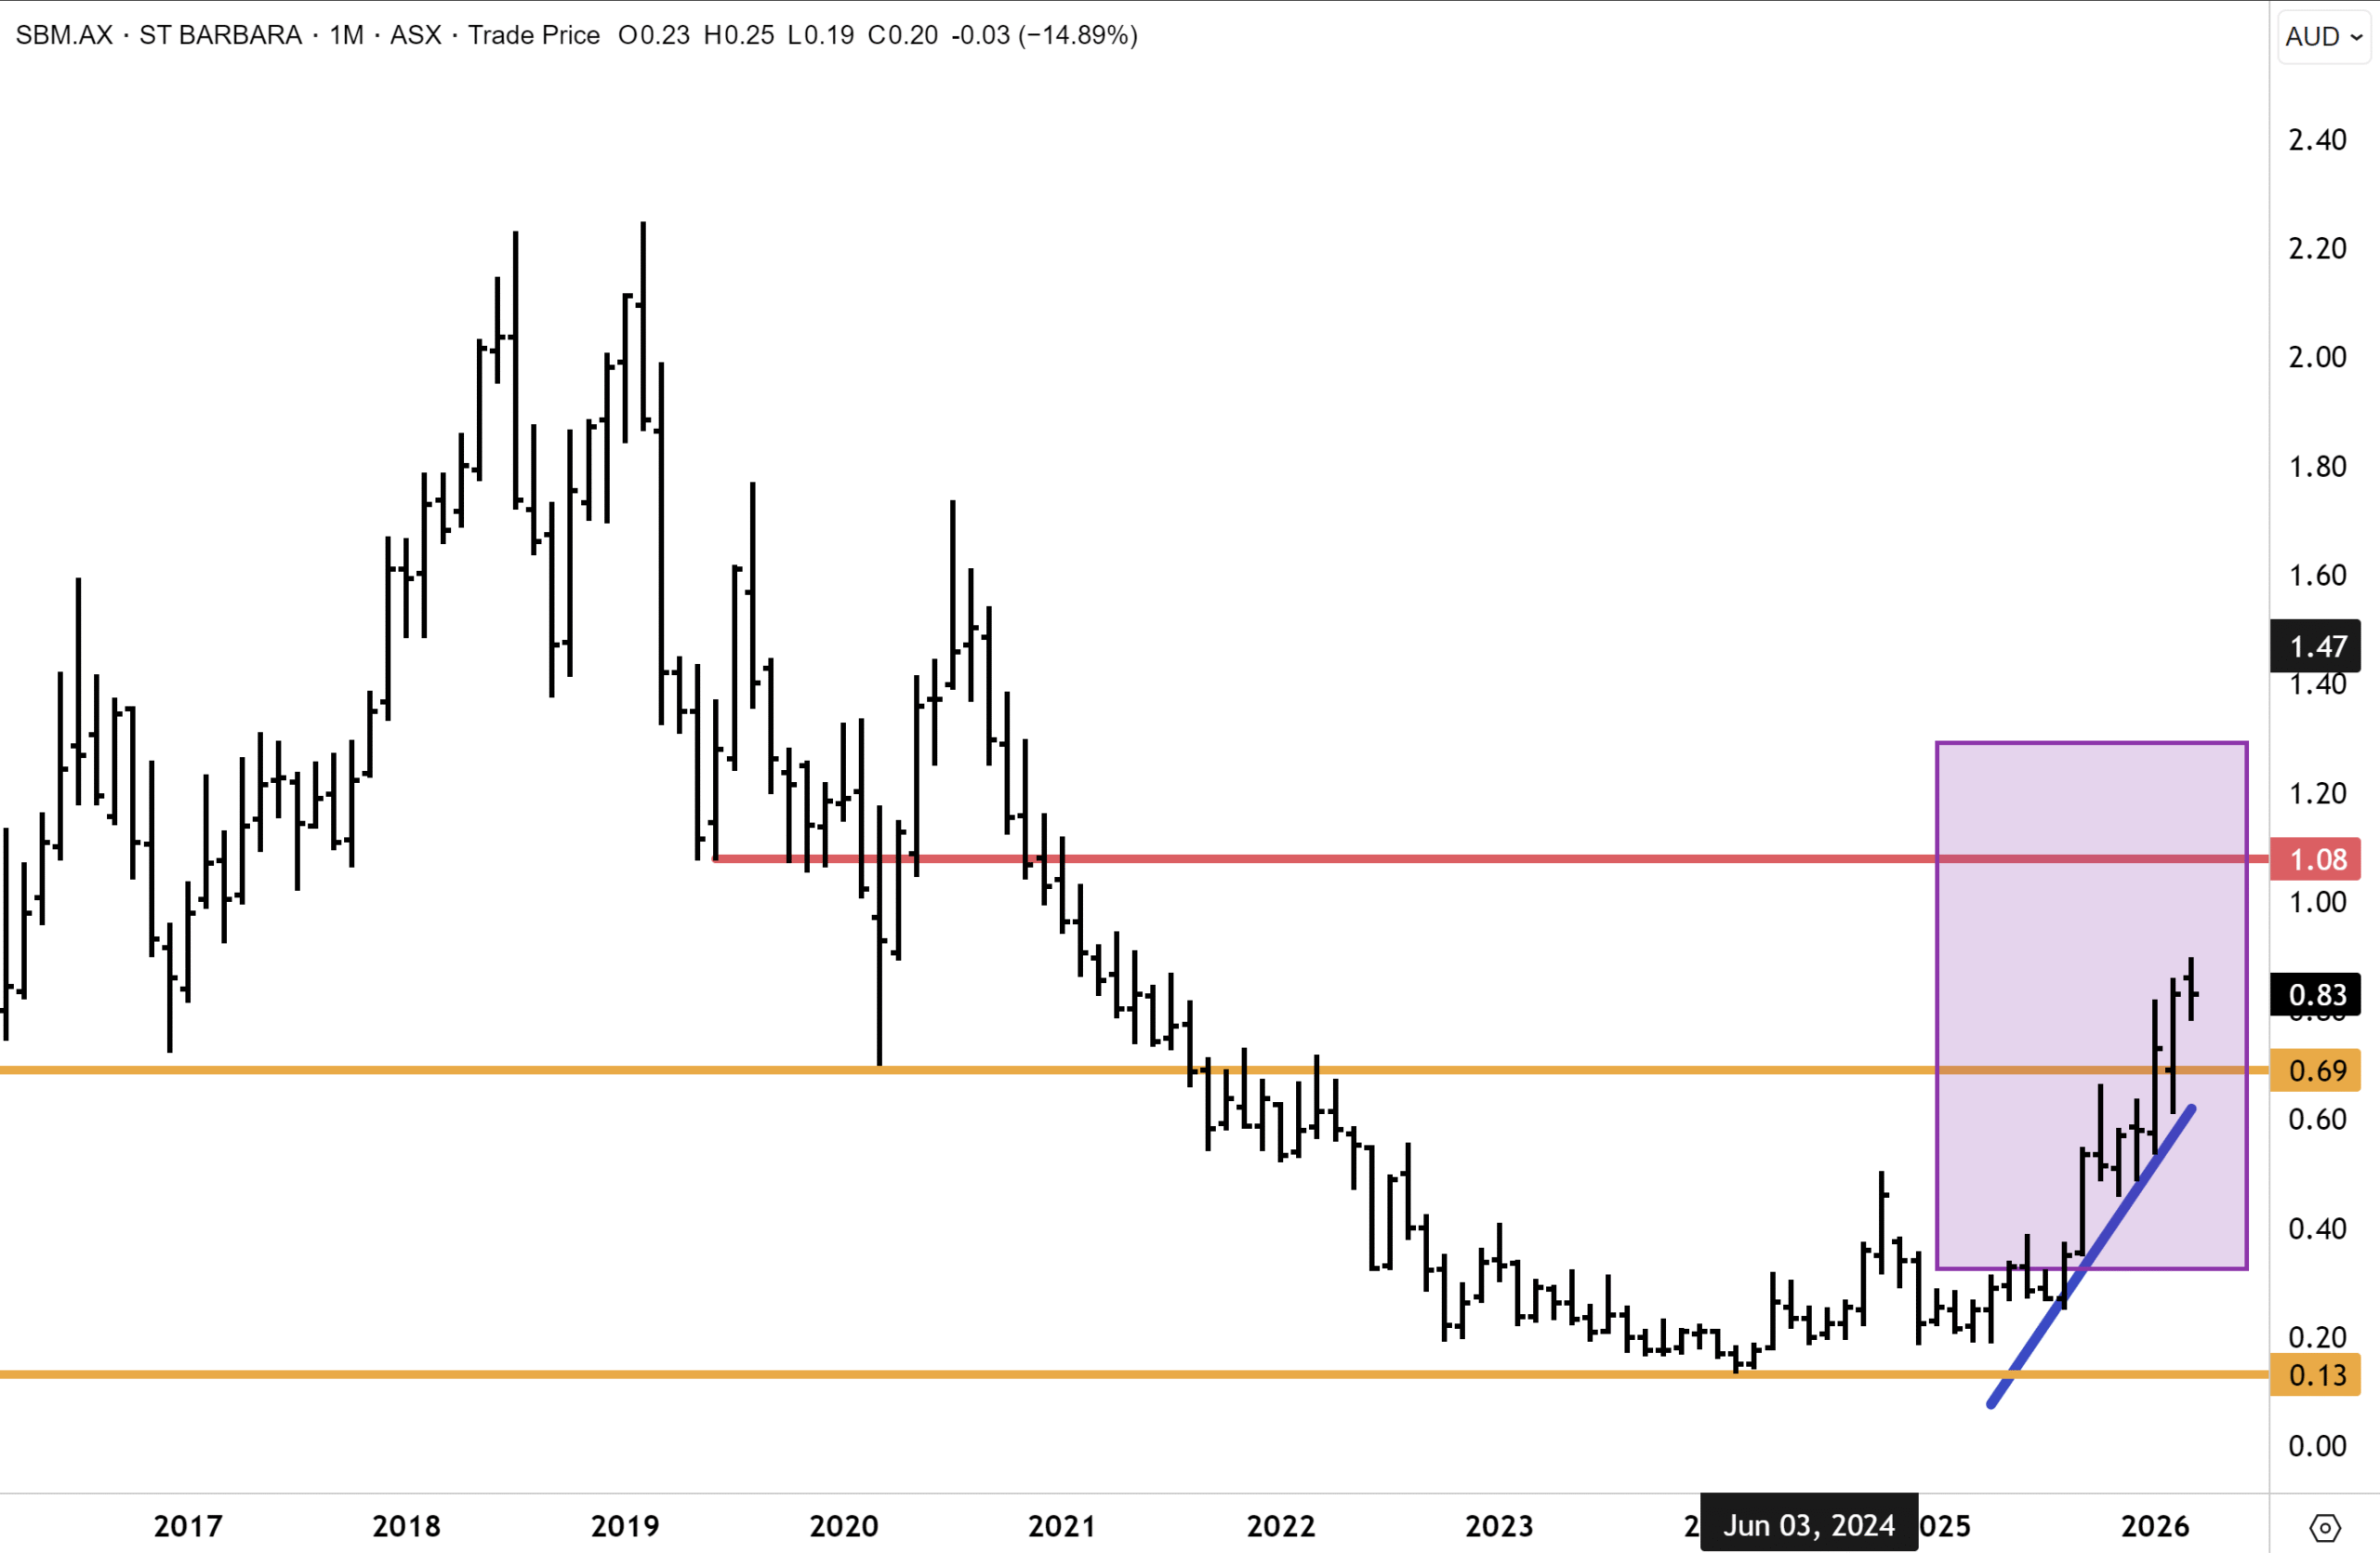
St Barbara (ASX: SBM)
St Barbara is a development play where the risk-to-reward proposition is compelling for many. The company holds two NPV-positive gold projects with a combined potential attributable NPV of just under A$2 billion at a conservative US$3,000/oz gold assumption. At today’s gold price, north of US$5,000/oz, those numbers are materially higher. The current market cap sits around A$1 billion.
The catalyst that closes that gap is transaction completion. The Lingbao Gold deal (A$370 million cash for 50% of the operating vehicle) and the Kumul Minerals transaction (20% project stake for A$100 million) are targeting completion this quarter. On close, St Barbara’s unrestricted cash position approaches A$440 million, roughly 44% of the current market cap, transforming the balance sheet. The PNG tax dispute of approximately A$190 million is the key residual risk, but with binding agreements in place, the PNG Government holding skin in the game via Kumul, and commercial incentives strongly aligned on all sides, we think the risk is relatively low.
Meanwhile, the Nova Scotia exploration pipeline (47,841 hectares hosting 44 active targets) sits entirely outside the current NPV. Only 25% of the prospective ground has been drilled at the recommended spacing. That is unpriced optionality acquired on a shoestring. With Simberi generating positive operating cash flow at current gold prices and the development pipeline backed by a fortress of near-term liquidity, the risk/reward is compelling. BUY.
St Barbara stood out this week in terms of relative outperformance versus the sector. Angus Geddes noted, “The relative price strength is telling. While other gold stocks have pulled back meaningfully, I would be adding to positions in SBM on weakness. The next plausible price target for SBM is $1.08 in my opinion, being the higher up 2019 – 2021 resistance cluster. SBM is undercovered by brokers and analysts, significantly undervalued, and with a mining portfolio that is now largely de-risked in my view. We hold SBM across all our portfolios.
This report and many others spanning Australasia, Mining and Global Equities are available online for your reading pleasure in the Members area, should you be interested in subscribing for investment snapshots and deep dives across a range of investment vectors, along with our regular Daily correspondence on the markets.
Have a great weekend.
Carpe Diem
Angus
Sign up to receive full reports for
the best stocks in 2026!
Where to Invest in 2026?
The market is full of opportunities—but which stocks will deliver real wealth-building potential?
At Fat Prophets, our expert analysts uncover the best Australian and global stocks to help you stay ahead of the curve. Whether you’re looking for growth, income, or diversification, our carefully curated portfolio gives you access to high-conviction stock recommendations backed by deep research and proven insights.
Subscribe now to get full reports of these stocks and get ready for the next big opportunities!
Over 25,000 customers worldwide
Need a try? You’re first-time customer?
Enjoy our Welcome Gift with $500 OFF your Membership
Use code: FPWELCOME
FAQ’s
How much does a Membership cost?
We have a number of Membership options for the DIY investor. Our research services cover individual stock opportunities in Australia, as well as the UK, global markets, and a sector-specific report focussing on the mining space. Annual Membership prices start at $1395.
Do you offer execution services?
No we do not, and our research is independent in the sense that we are not conflicted by operating broking services alongside them. We also do not offer ‘sponsored research’ and are not financially incentivised by any of the companies that we recommend to Members.
Can I access any special offers?
Our introductory joining offers relate only to new Members. We do however offer ‘early bird’ discounts to existing Members who renew in advance of their Membership expiring.
Can I get tailored financial advice?
Our research products are ‘general advice’ in nature only, however we do categorise all our recommendations by the level of risk appetite which we believe is involved. Members looking for more direct advice can also make an inquiry to our wealth management team which offers a separately managed accounts service.
Do you offer a Money-Back guarantee?
Yes we do. Fat Prophets offers a 100% money back guarantee on annual subscriptions within 30 days of taking out a Membership.