
KEY CONTENT
- Last week had four acts driven by the US-Iran conflict: Monday’s strike pause triggered a sharp rally; Wednesday’s formal 15-point US peace plan submission lifted sentiment; last Thursday saw Iran reject the plan and the S&P retest lows at 6,477; then, post-close Thursday, Trump extended the pause a further ten days with “talks going very well”
- Core thesis: both the US and Iran are incentivised to resolve quickly – the White House faces oil above $100, bond yields approaching pain thresholds, and midterm elections; Iran faces overwhelming force but a significant economic carrot (sanctions relief, US-backed investment program)
- S&P 500 key support at 6,500; a break lower could trigger a capitulatory flush to 6,300–6,150, consistent with prior selloff patterns (tariffs, yen carry, COVID)
- Oil tracked the diplomatic narrative faithfully. The current Brent price is heavily conflict-premium
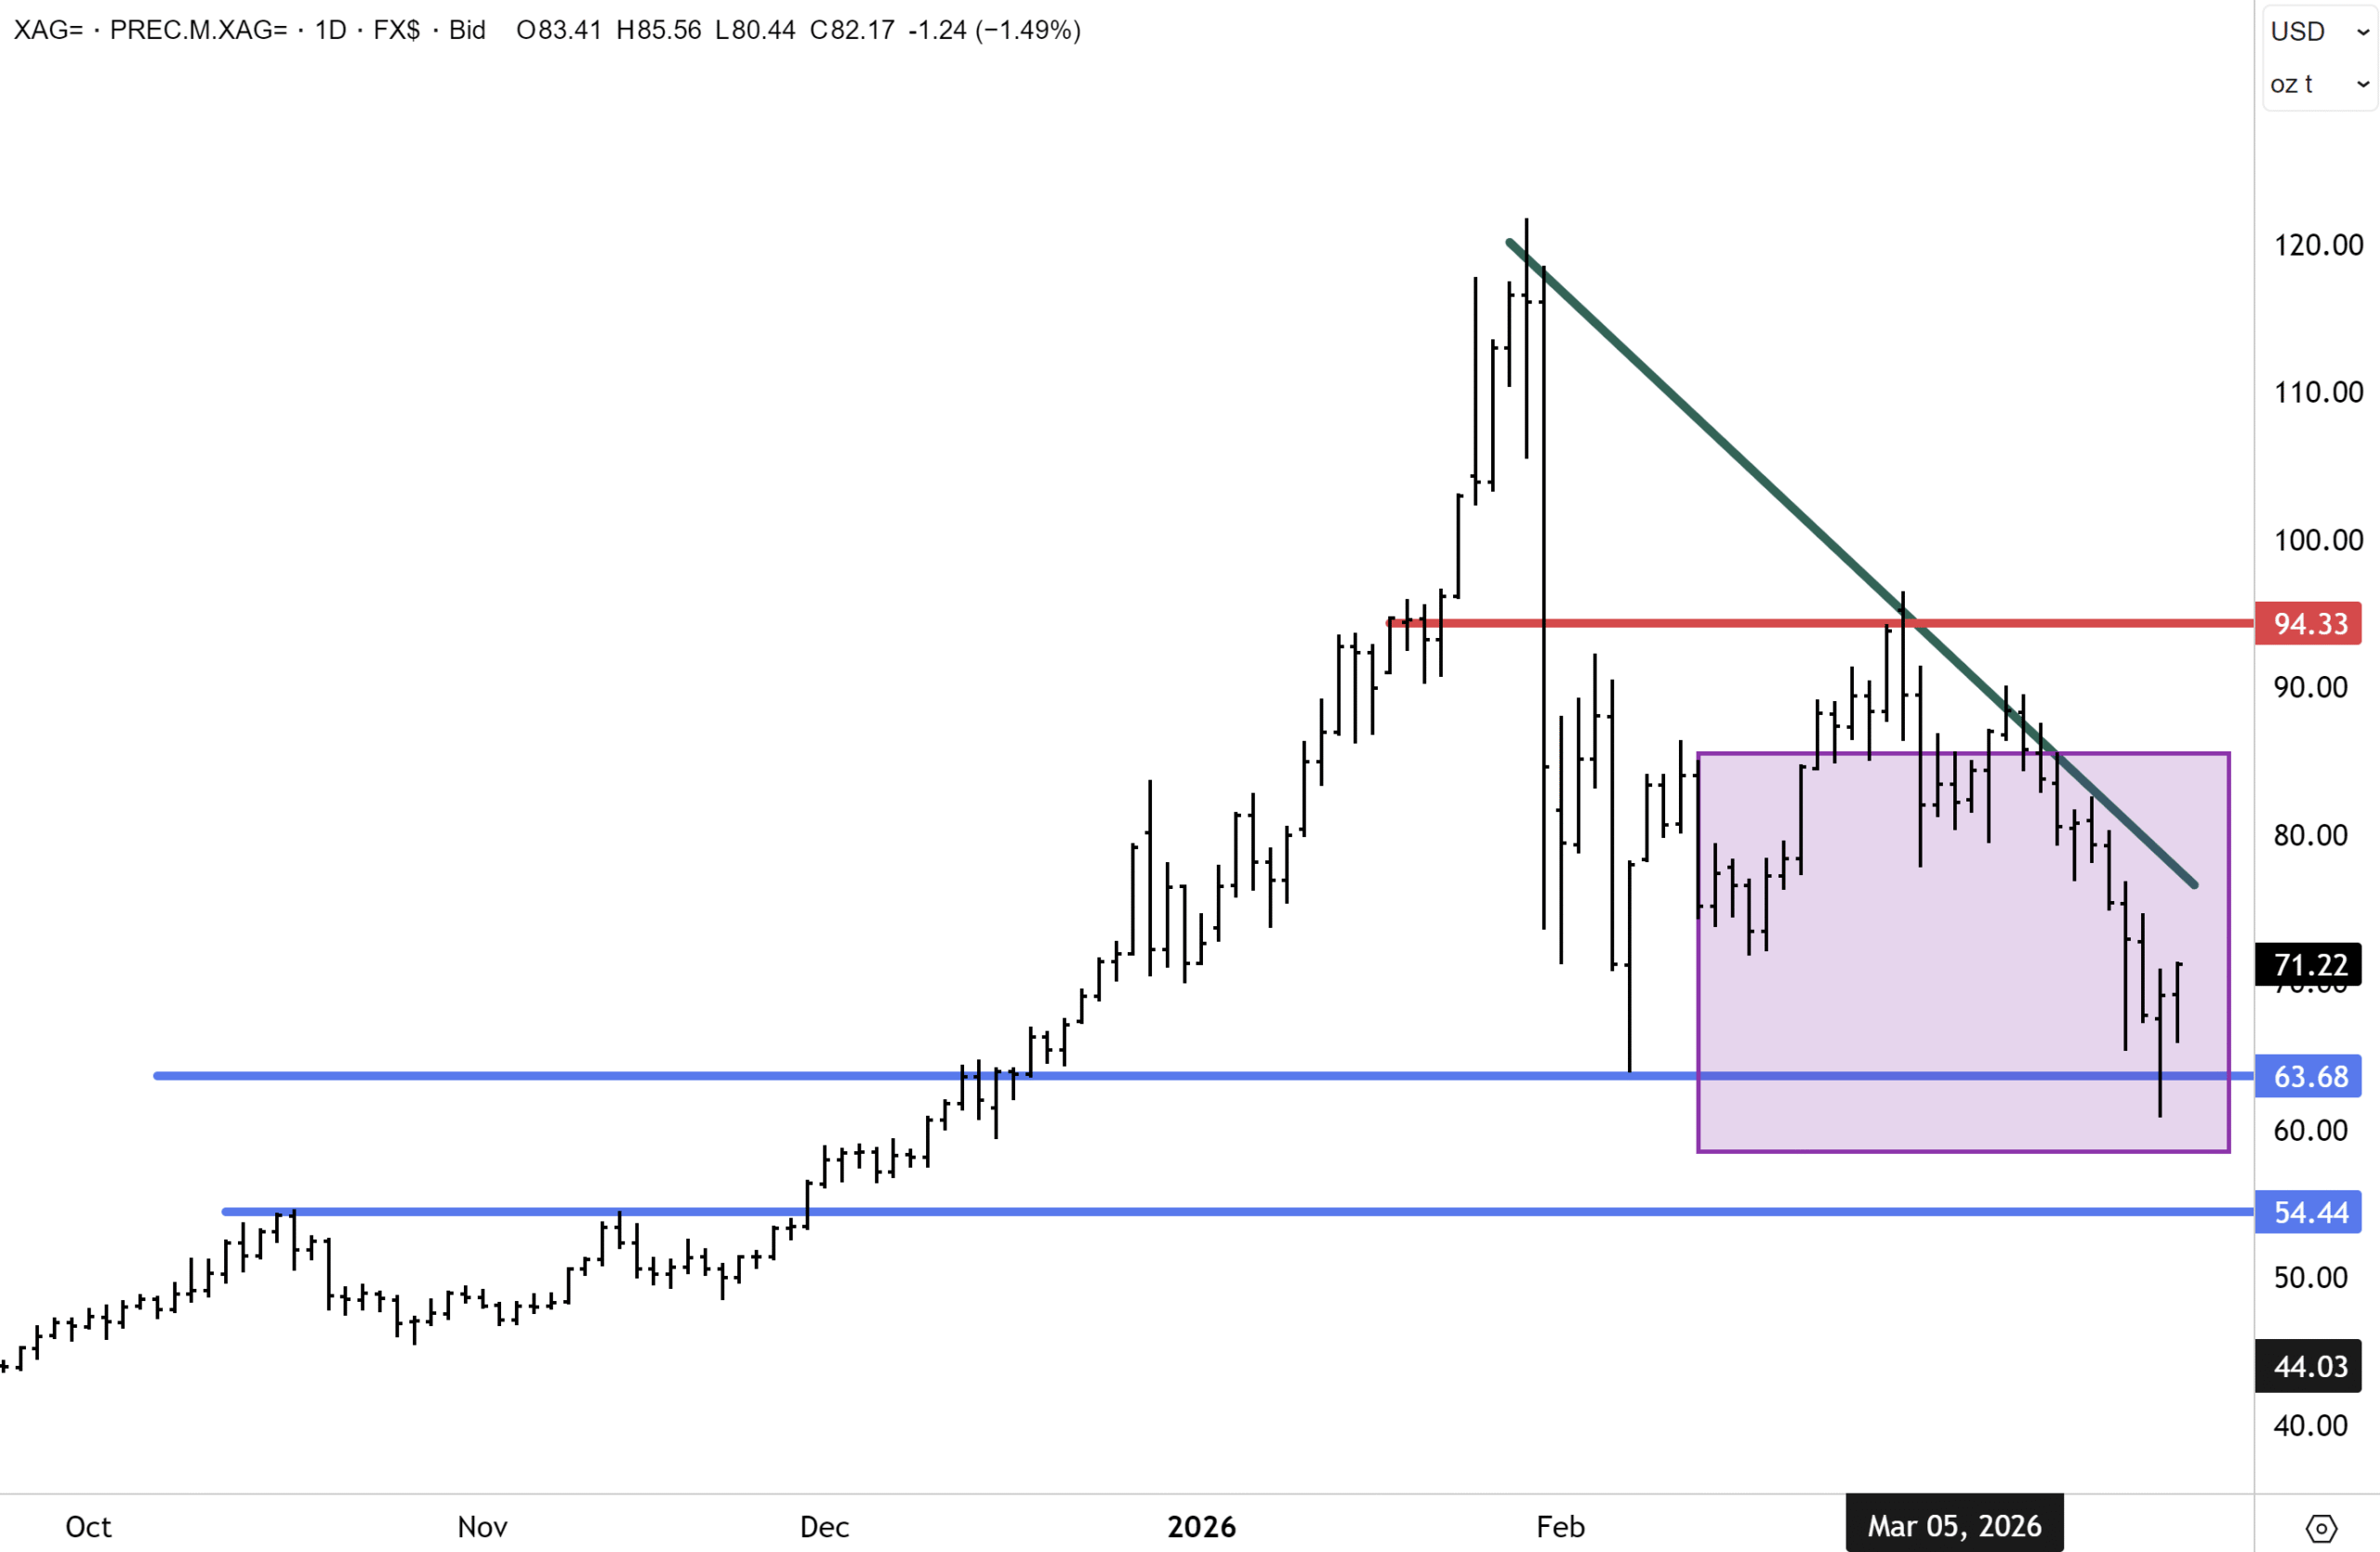
- Gold corrected. Turkey’s central bank selling (~60 tons, ~$8bn) has been a driver – finite and situation-specific; structural bull case intact; our bullish house view is maintained.
- RBA: RBA official Chris Kent hawkish, market pricing two more 25bps hikes. Should the conflict be resolved, that pressure will reduce.
- Copper held stable around US$5.50/lb. The market is increasingly pricing structural demand over geopolitical noise.
- Silver: China buying at 8-year high, double bottom technical setup, inventories falling; bull case building
REPORT SPOTLIGHT
- Evolution Mining (ASX: EVN) – BUY
Full reports across Australasia, Global Equities and Global Mining are available to members, along with our complete model portfolio positioning. If you’re not yet a member, you can join today.
ON THE HORIZON
- The Diplomatic window is key – a deal could trigger the “everything rally”. A breakdown risks flush to the downside.
- Today is month- and quarter-end: rebalancing noise.
- US on Friday: consumer sentiment, likely to be dented
- US Q1 earnings in two weeks: banks lead; KBE down 10% in March, but an upside reversal pattern is forming.
- Oil/gas prices: Expect more volatility on each contrasting headline.
Good afternoon,
Well, it has been a long and gruelling week in the financial markets. The volatility and relentless headlines around the Middle East war – and where it could all go – are trying, as all selloffs and times of panic are. They test our character.
One scene from the 1987 film Wall Street always comes to mind during these times. An old timer in the firm says to Bud Fox, just before the police arrive to end his career: “Man looks in the abyss, there’s nothing staring back at him. At that moment, man finds his character. And that is what keeps him out of the abyss.”
In my forty years in financial markets, on every occasion during times like this – selloffs, panics, corrections – the worst storms have always come and gone. Fear is always present. Worst-case scenarios always get bandied about. And on every occasion, these moments eventually pass. What this week confirmed, beneath all the noise, is that the mechanisms for resolution are in motion.
We are acutely aware that behind the price moves in markets and power plays are real people – Middle East regional populations, seafarers stranded in the Strait of Hormuz, the hundreds of millions globally for whom additional costs are applying uncomfortable financial pressure – whose lives this conflict directly affects. When we talk about markets and money in our notes, we do so knowing that the human stakes are considerably higher. The timing of resolution remains uncertain. What follows is our best read of where things stand, and what it means for portfolios.

When Both Sides Need the Off-Ramp
Our market thesis is that both the US and Iran are incentivised (in different ways) to bring this to a conclusion sooner rather than later. The Trump administration needs this war to end because oil above $100, a bond market approaching its pain threshold, and midterm elections later this year make a prolonged conflict politically toxic. Iran is using its levers to apply much pressure, but faces an overwhelming military force – that is the ‘stick.’ Meanwhile, reported overtures from the US offer a massive economic ‘carrot.’
The bond market mechanism is the same one investors watched play out last April. When the US 10-year yield approached 4.6%, and the 30-year crossed 5.1%, Treasury issuance costs became politically challenging. This week, the US 2-year moved from 3.81% Monday to 4.00% Thursday, +19bps in four sessions. The 10-year hit 4.42%, tracking toward the same threshold. On Thursday evening (after the market close), Trump extended his strike pause by a further ten days and said talks were “going very well.” The positioning is similar to last year’s tariff pivot.
On the Iranian side, the incentive is generational. Iran has been excluded from global oil export markets since Reagan’s sanctions in the 1980s. The 15-point peace plan reportedly offered full sanctions removal and a US-backed investment program – the largest economic carrot extended to Tehran in four decades. For a regime whose primary objective is survival, the case for resolution is overwhelming. Jamie Dimon captured it precisely: Middle East nations investing trillions to diversify beyond oil cannot do so while ballistic missiles are landing in data centres.
The week’s arc confirmed the thesis rather than breaking it. Monday: a violent short-covering rally – the VIX collapsed from 30 to 26, Morgan Stanley declared the correction “well advanced in both time and price.” Wednesday: confirmation – JPMorgan closed its tactical bearish call and cited “everything rally” potential on a formal ceasefire. Thursday: the stress test — Iran called the plan “one-sided,” the S&P retested Monday’s lows at 6,477, and bond yields surged. Then, after the close, ten more days were offered by Trump.

Gold was again volatile this past week. It is looking like a market caught between structural demand and a specific, finite source of selling pressure that only became clear on Thursday.
Turkey’s central bank sold approximately 60 tons of gold – roughly $8 billion – in the two weeks following the war’s outbreak, partly outright into the spot market and partly via swaps to secure foreign exchange. Bloomberg reported that this supply exceeded total outflows from gold-backed ETFs over the same period. Rising energy import costs were straining Turkey’s disinflation strategy, which depends on lira stability. The critical point: this supply is finite and situation-specific. It explains the correction without negating the structural bull case, and it fades as the conflict resolves.
Ed Yardeni – who cut his year-end target from $6,000 to $5,000 last week – maintained his $10,000 target by the end of 2029 and said the uptrend “should resume.” Our house view remains bullish. We have recommended tactical buying opportunities in multiple names over the past two weeks, available on our website for members here.

The bond market’s role this week was not simply as a risk barometer. Every basis point the US 10-year climbed toward 4.5% added urgency to the diplomatic timetable. The US 30-year briefly touched 4.93%. The direction of travel was clear, and the White House is taking notice. This, along with general inflationary risk and the looming midterms later this year, is pushing Trump into a corner, and he wants an exit.
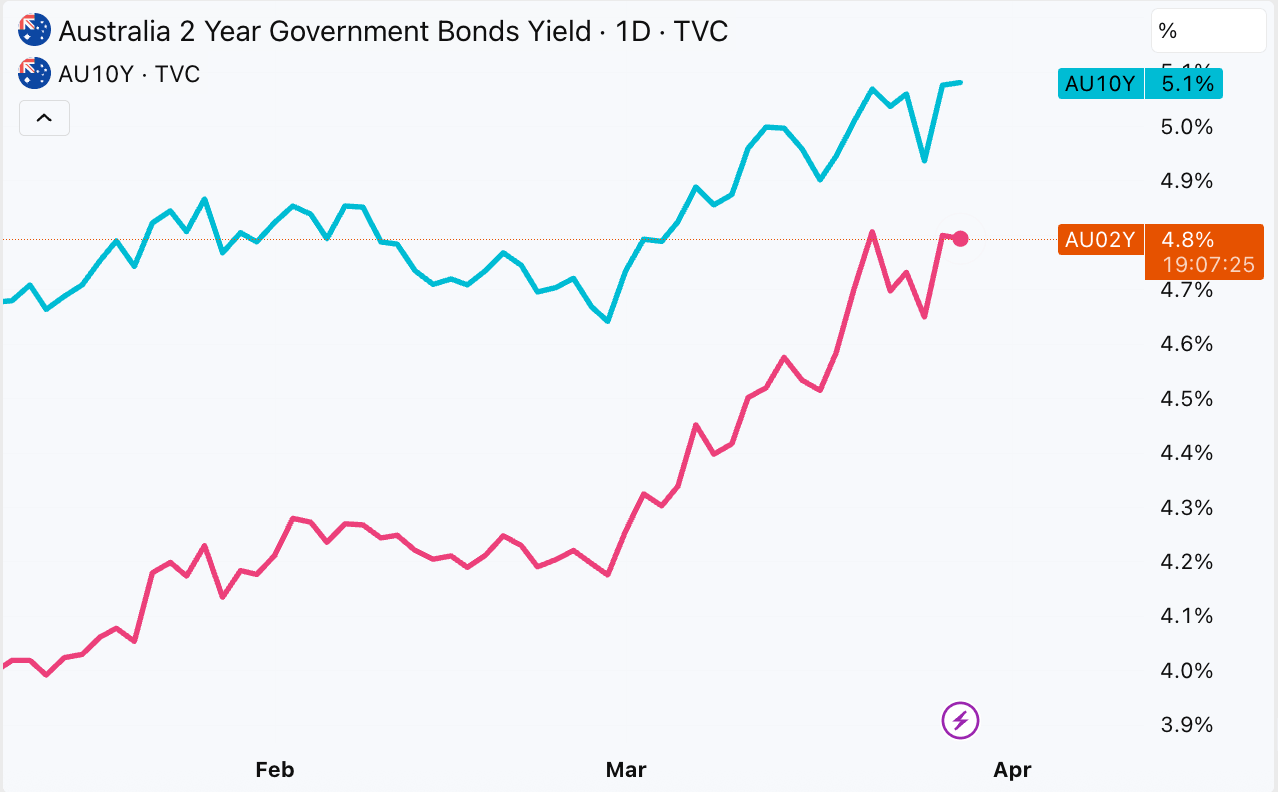
Domestically, RBA Assistant Governor Chris Kent warned that a prolonged Middle East supply shock could require a more restrictive policy stance. One-year Australian bond yields rose +5bps to 4.62%; the market is now pricing two more 25bps hikes this year. Our view here is more sceptical. If the conflict resolves and energy prices recede somewhat, which Thursday’s post-close announcement makes materially more likely, the new primary inflation pressure would be more transitory. The RBA is not cutting in this environment, but two more hikes require the current geopolitical stress to persist considerably longer than we expect it to.
As can be seen below, we have seen a steep increase in the Aussie 2-year and 10-year yields since the Iran conflict began, marking a stiff headwind for equities. Any relief here would quickly become a tailwind for stocks.
When local inflation data dropped on Wednesday (before Kent’s speech), it supported market sentiment, and rate rise expectations for May softened. February CPI eased to 3.7%, a tick below the 3.8% forecast (trimmed mean came in at 3.3% vs the 3.4% expected), but predated the conflict’s energy price shock.
We are bullish on select Australian banks and insurers in this climate. Check out recent research updates on the Fat Prophets website for more details.
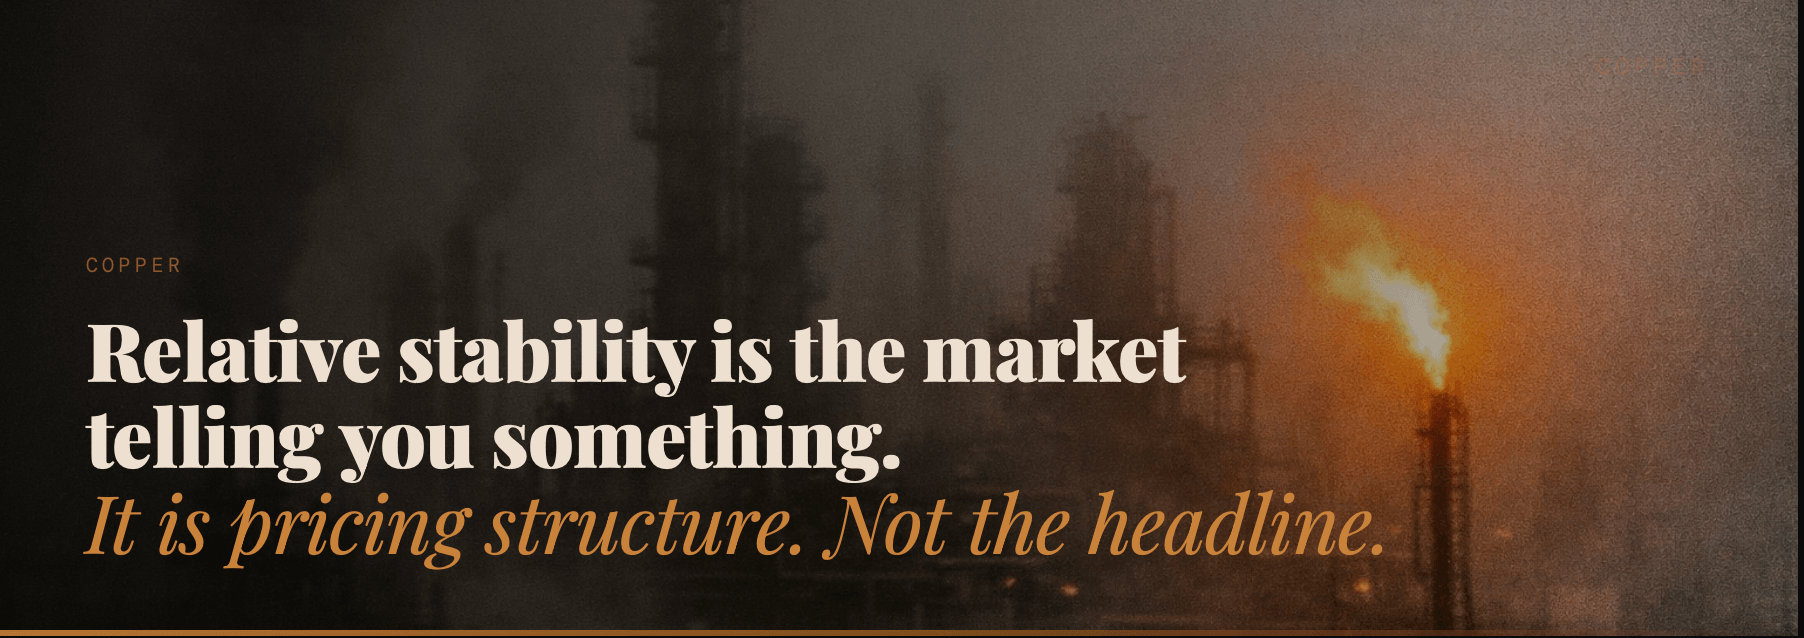
Copper’s relative stability this week was very interesting. The red metal traded in a very tight range around the US$5.50/lb level, in a week when there were big swings in oil, gold, silver and several other commodities. After a correction since the beginning of the Iran conflict, the market now appears to be increasingly pricing structural demand, not trading the geopolitical headline. Copper’s use case – energy transition, electrification, AI infrastructure – provides a compelling structural demand story against a backdrop of tight supply. We view the medium-term investment case very positively and have BUY ratings on select names across the complex.

Silver should follow a similar pattern to gold, and I think both silver and gold miners look attractive after this month’s selloff. A report on Bloomberg this week highlighted that “China’s overseas purchases of silver reached an eight-year high at the start of 2026, with importers feeding a surge in industrial and investment demand. Strong demand has pushed local prices well above international benchmarks, and silver prices have had a volatile start to the year, soaring about 70% before giving up their gains.” Overbought conditions in silver have now been corrected, and the froth and excess have been corrected in the market. The selloff in silver this week to a low of $61, which accompanied gold, also potentially defines a bottom.
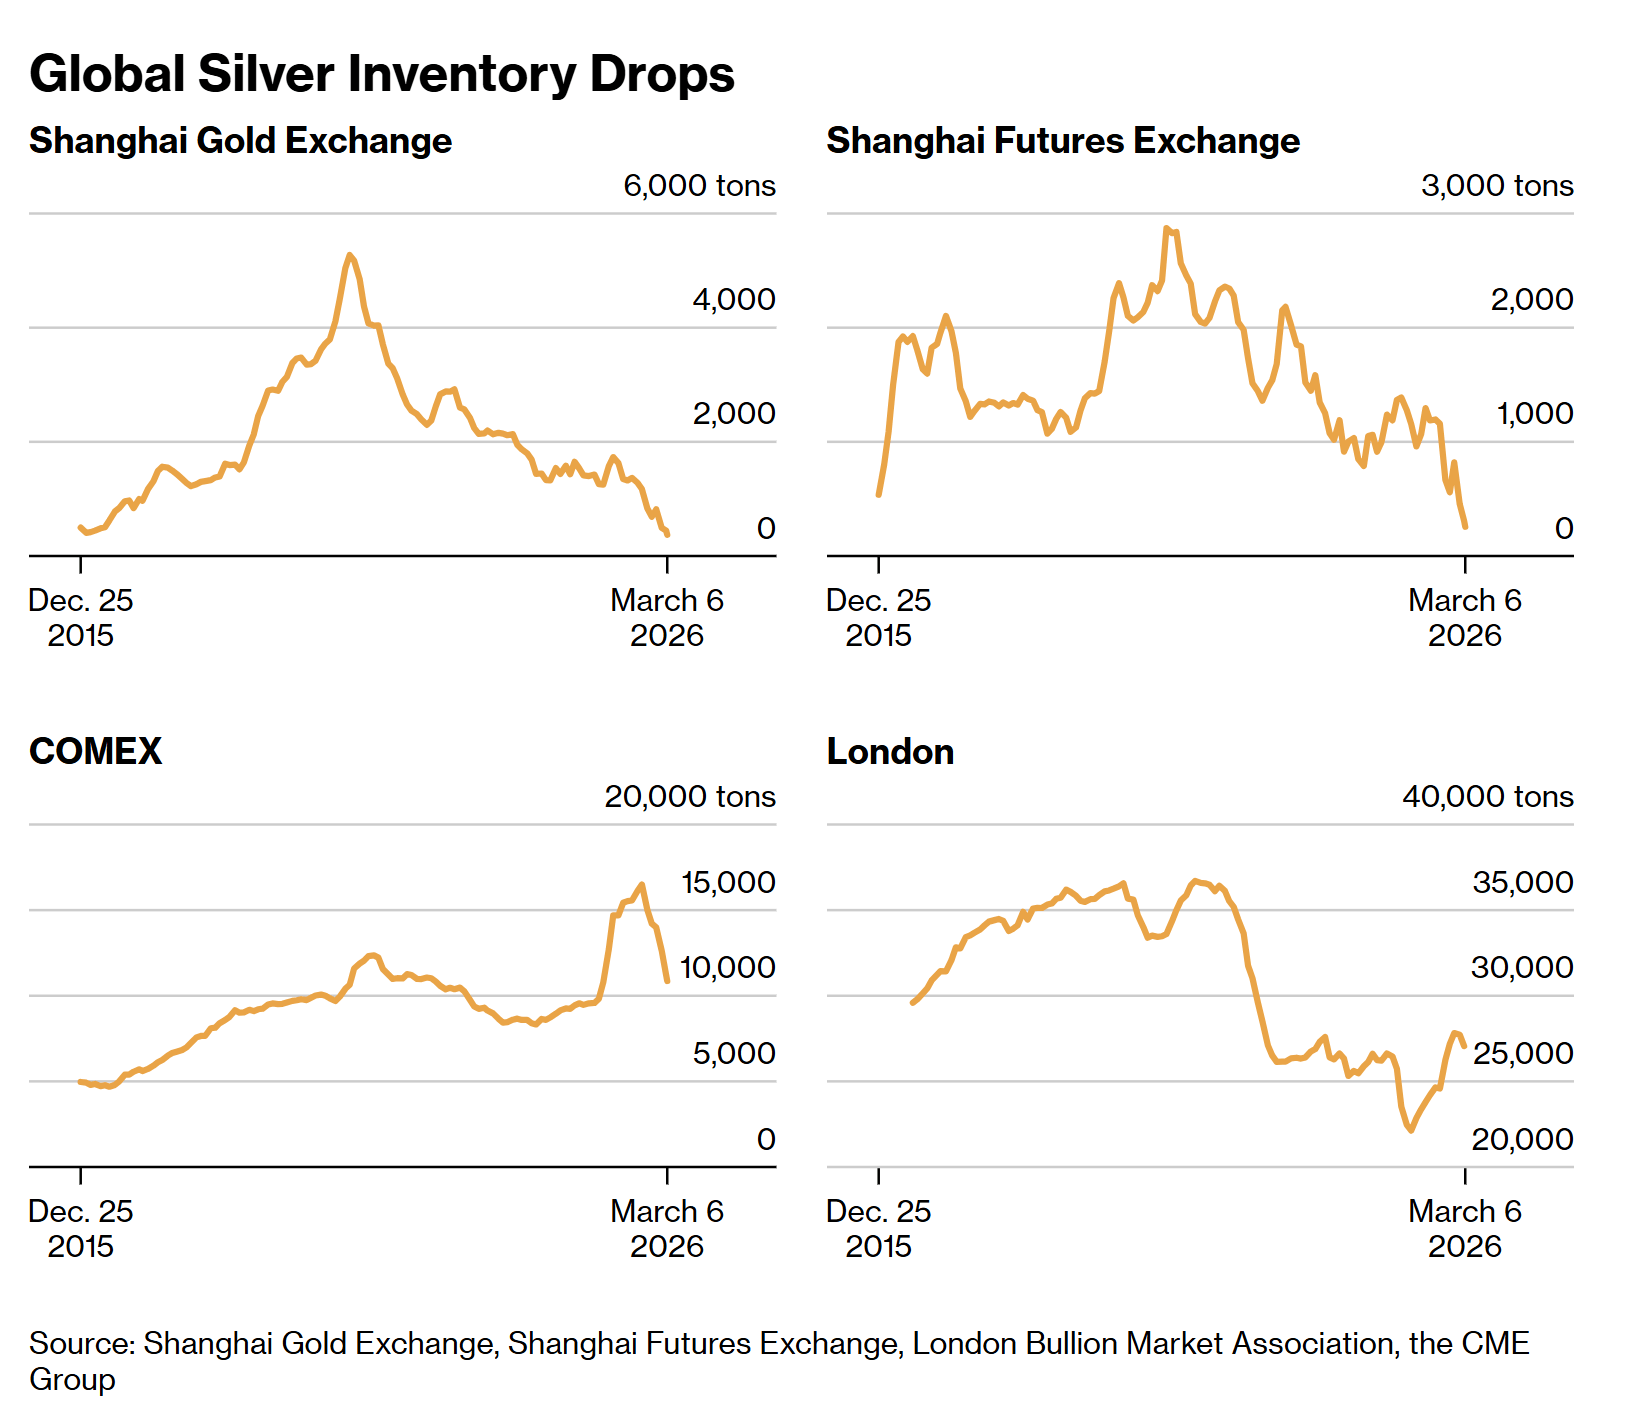
Bloomberg noted that “demand for physical [silver] bars is very strong, with retail investors and solar manufacturers driving consumption, and inventories in Chinese exchanges have been falling, having a psychological effect on the market.” According to Chinese customs data on Friday, China, which is the world’s biggest buyer of silver, pulled in over 790 tons in the first two months of ‘26, including nearly 470 tons in February, the highest ever for that month.
A silver lining?
Inventories and global stockpiles of silver at key exchanges have receded sharply. This points to supply tightening.
In terms of the technical setup for silver, a double bottom appears to have been confirmed with the retesting of the early February lows. Overbought conditions have been corrected and flushed out of the market, which points to a bottom. I have conviction that silver will soon be heading higher once we have clarity and more resolution around ME.
Last year, one of our silver exposure recommendations, Fresnillo, was the top FTSE100 performer in 2025, returning +413%. While we certainly aren’t expecting those types of returns this year, we believe a buying window has reopened in the sector and recommend a few exposures across our research reports.

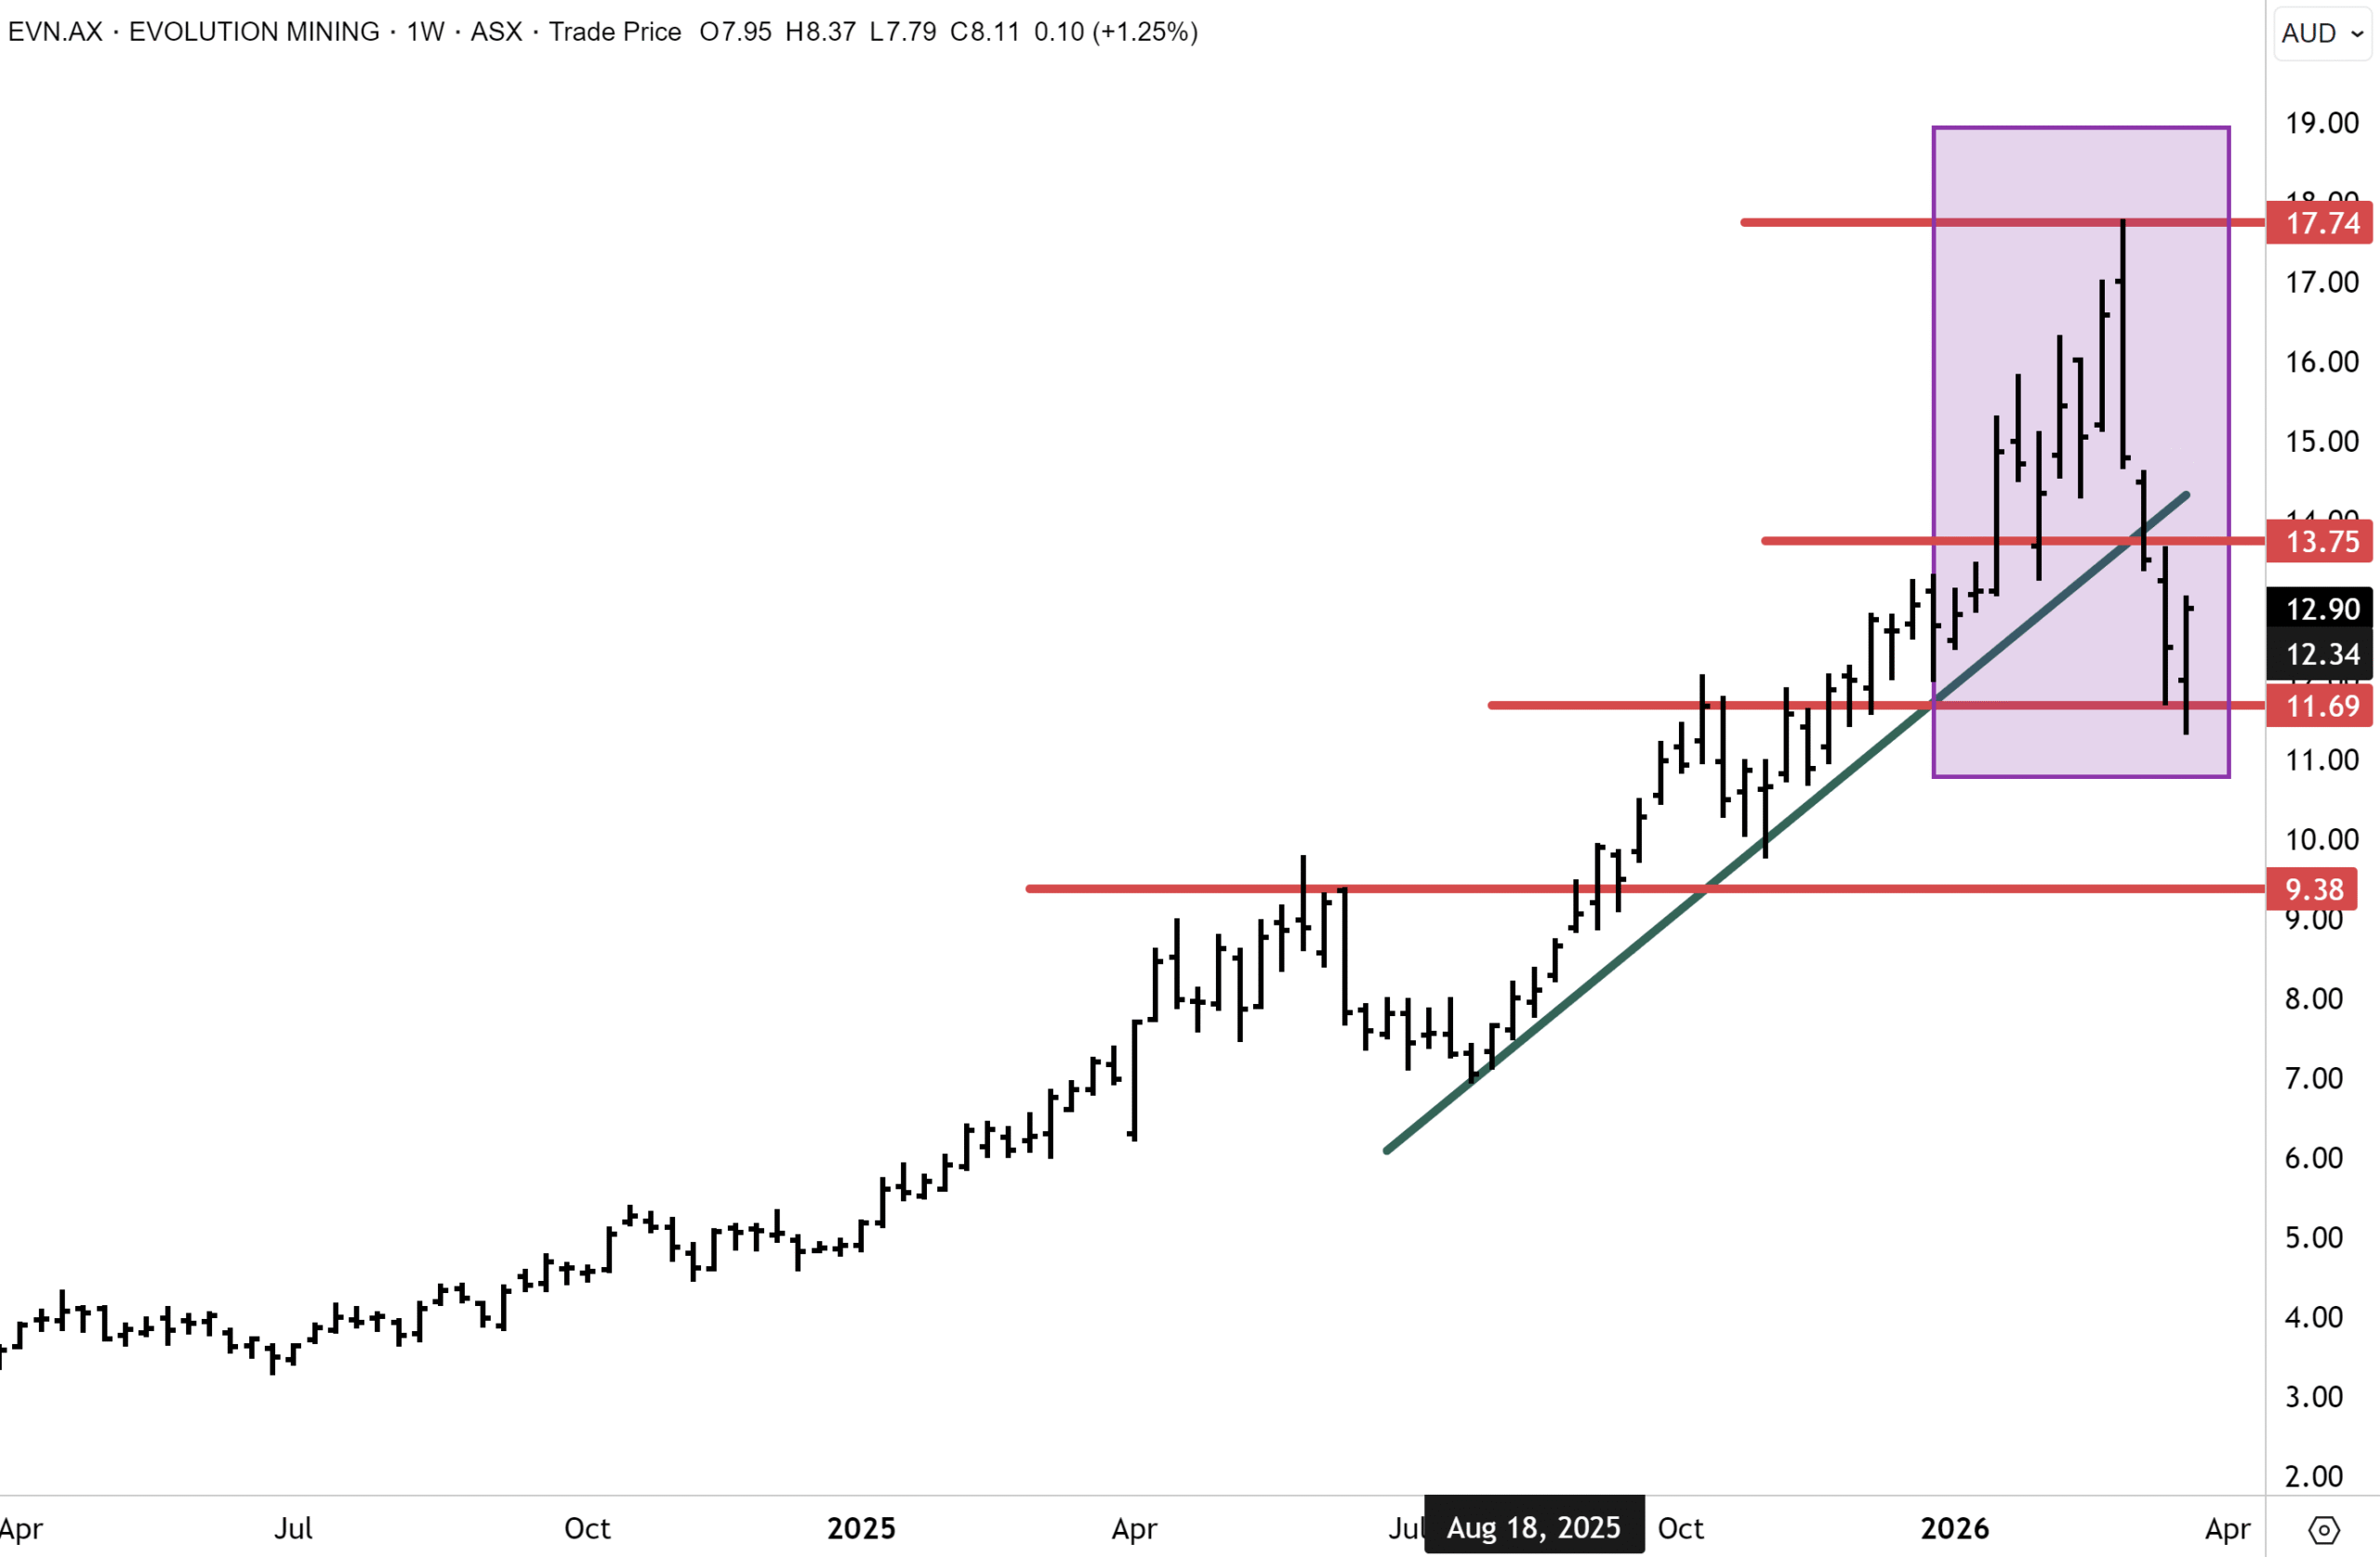
Evolution Mining (ASX: EVN) – BUY
A 30% correction has burned off a premium valuation for Evolution Mining. We see this as a tactical buying opportunity in a still favourable gold/copper environment. FY26 guidance looks achievable; the balance sheet has strengthened to support higher dividends and project investment. The company’s asset base is long-life and high-margin, with growth initiatives offering further production and reserve-life upside. The valuation is undemanding on our forecast price decks. The technical picture is supportive.
Evolution made a new record high near $18 just before the ME war on 28th February. The selloff has been severe in March, but in line with the “risk off” move in other gold stocks and the fall in the gold price. Evolution has retraced approximately half the advance from last July’s lows around $7, representing a 50% Fibonacci retracement. We expect support to emerge below $12 and for upward momentum to resume when risk appetite returns. If we are correct in spot gold having hit a major bottom during this correction, then EVN likely has also seen the lows during the incumbent selloff in financial markets. This is our base case. The next technical target for EVN to hurdle resides around $14, which we believe will be cleared on the topside in the coming months.
Want the Full Picture?
This edition of The Narrow Path is a condensed version of our full weekly Wrap, which includes deeper positioning analysis and more targeted investment opportunities. A subscription also includes 4 daily market commentaries during the week and reports on stocks, ETFs and special reports spanningAustralasia, Mining and Global Equities.
Have a great weekend.
Carpe Diem
Angus
Sign up to receive full reports for
the best stocks in 2026!
Where to Invest in 2026?
The market is full of opportunities—but which stocks will deliver real wealth-building potential?
At Fat Prophets, our expert analysts uncover the best Australian and global stocks to help you stay ahead of the curve. Whether you’re looking for growth, income, or diversification, our carefully curated portfolio gives you access to high-conviction stock recommendations backed by deep research and proven insights.
Subscribe now to get full reports of these stocks and get ready for the next big opportunities!
Over 25,000 customers worldwide
Need a try? You’re first-time customer?
Enjoy our Welcome Gift with $500 OFF your Membership
Use code: FPWELCOME
FAQ’s
How much does a Membership cost?
We have a number of Membership options for the DIY investor. Our research services cover individual stock opportunities in Australia, as well as the UK, global markets, and a sector-specific report focussing on the mining space. Annual Membership prices start at $1395.
Do you offer execution services?
No we do not, and our research is independent in the sense that we are not conflicted by operating broking services alongside them. We also do not offer ‘sponsored research’ and are not financially incentivised by any of the companies that we recommend to Members.
Can I access any special offers?
Our introductory joining offers relate only to new Members. We do however offer ‘early bird’ discounts to existing Members who renew in advance of their Membership expiring.
Can I get tailored financial advice?
Our research products are ‘general advice’ in nature only, however we do categorise all our recommendations by the level of risk appetite which we believe is involved. Members looking for more direct advice can also make an inquiry to our wealth management team which offers a separately managed accounts service.
Do you offer a Money-Back guarantee?
Yes we do. Fat Prophets offers a 100% money back guarantee on annual subscriptions within 30 days of taking out a Membership.