
KEY CONTENT
- Operation Epic Fury – the joint US-Israeli campaign against Iran launched February 28 – effectively closed the Strait of Hormuz, through which roughly a fifth of the world’s daily oil supply ordinarily passes
- Brent crude briefly spiked above $120/bbl before headlines of a coordinated G7 response and actions by the IEA took some heat out; WTI remains above $96 as of Thursday’s session, with Goldman Sachs warning of a potential $148 overshoot if the Strait stays shut through March
- The oil/gas shock was compounded by last Friday’s US non-farm payrolls, which delivered a 92,000 contraction against expectations of a gain the largest monthly decline in four months, with the unemployment rate edging to 4.4% and wage growth still running hot at 3.8% year-on-year
- The combination of an energy-driven inflation shock colliding with a softening labour market hints at the word central bankers dread most: stagflation
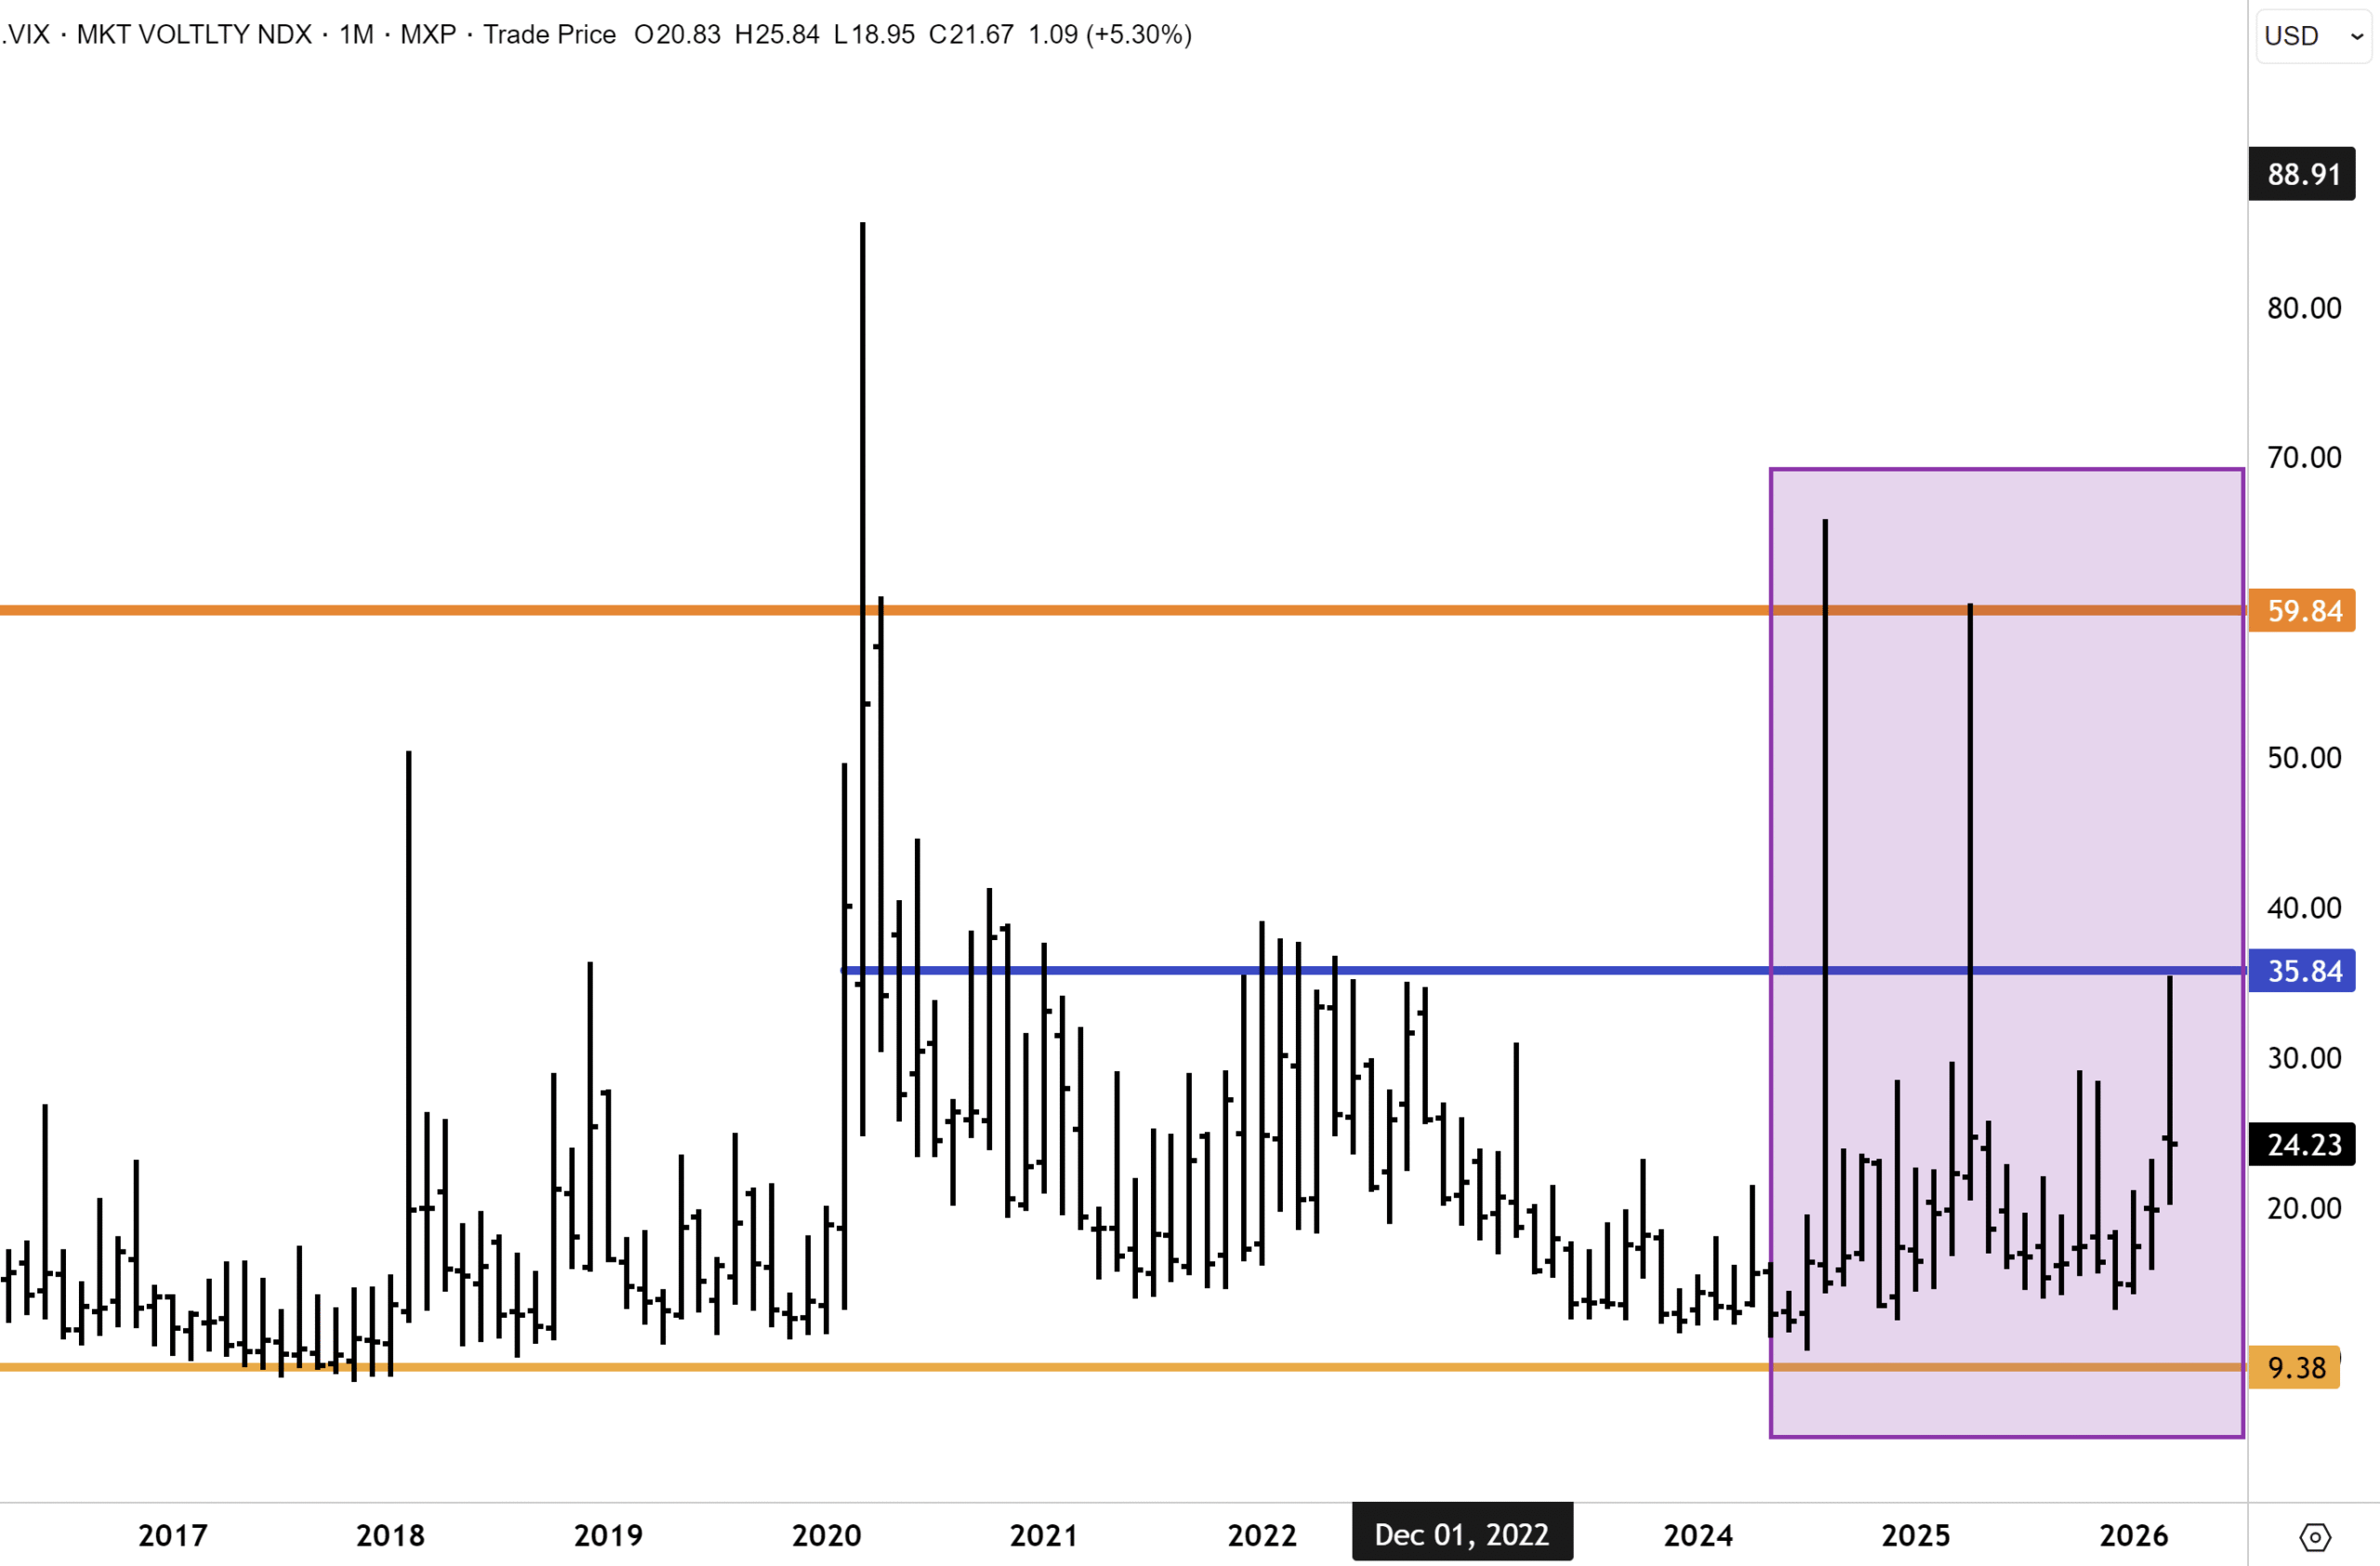
- The VIX peaked above 39 on Monday and has retreated; Morgan Stanley’s Mike Wilson is looking for the S&P 500 to make a final low around 6,300, before the bull market can resume
- Australian bond yields surged across the curve. RBA Deputy Governor Andrew Hauser warned that the oil shock will push inflation above the bank’s June-quarter forecast
- Our base case remains that an off-ramp to the Middle East conflict arrives by April, triggering a sharp oil reversal and a V-shaped equity recovery similar to the Liberation Day playbook of 2025
- Baron Nathan Rothschild’s maxim from the Napoleonic wars – “buy when the cannons are firing, sell when the trumpets are blowing” – is worth keeping front of mind; by the time the Middle East conflict visibly loses momentum, and oil prices roll over, markets will in all likelihood have already moved
REPORT SPOTLIGHT
- BHP (ASX: BHP): A sharp correction from record highs near $60 is a textbook pullback to breakout support; copper now accounts for more than half of group EBITDA for the first time in BHP’s history, and iron ore has recovered above $100/t. The dip is the opportunity. BUY
WHAT TO WATCH
- RBA meeting, Tuesday: The debate between hold and hike has sharpened sharply; Hauser’s hawkish commentary has markets pricing a meaningful hike probability – watch for the statement’s language on second-round inflation risk
- Fed meeting, Wednesday: A hold is near-certain; the entire value lies in Powell’s press conference – specifically, whether he frames the oil shock as temporary or signals the dot plot shifting toward fewer 2026 cuts
- Strait of Hormuz: No event on any calendar matters more; any credible ceasefire signal or humanitarian shipping corridor likely triggers a sharp oil reversal and equity relief rally – conversely, further attacks on Gulf infrastructure are unambiguously negative
- BOJ meeting: A hold at 0.75% expected; watch for any softening in tightening rhetoric given Japan’s acute energy import exposure
- PCE data (today): The Fed’s preferred inflation gauge; the print will reflect pre-war conditions, and markets will look through it, but any upside surprise narrows the Fed’s room to move

It has been a turbulent week for markets. Wall Street entered the week already wounded after a down week. The oil market provided the opening scene. The world’s most important energy corridor has effectively closed, and traders have spent the week trying to determine the longevity of the impact and its second and third-order implications for inflation and the global economy – bond yields have reacted. The joint US-Israeli campaign against Iran – Operation Epic Fury, launched February 28 – escalated into something that financial models are struggling with: a near-total halt to shipping through the Strait of Hormuz, through which roughly a fifth of the world’s daily oil supply and global LNG trade ordinarily passes. Last Friday and on Monday, we saw the type of historic intraday and daily move in oil that breaks quantitative models.
. The ASX’s morning session on Monday saw the market down more than -4%, before a partial recovery to -2.85% for the day. Still, an ominous beginning. It was the world’s first major market to price that verdict. Inflationary fears linked to oil/gas prices abounded.
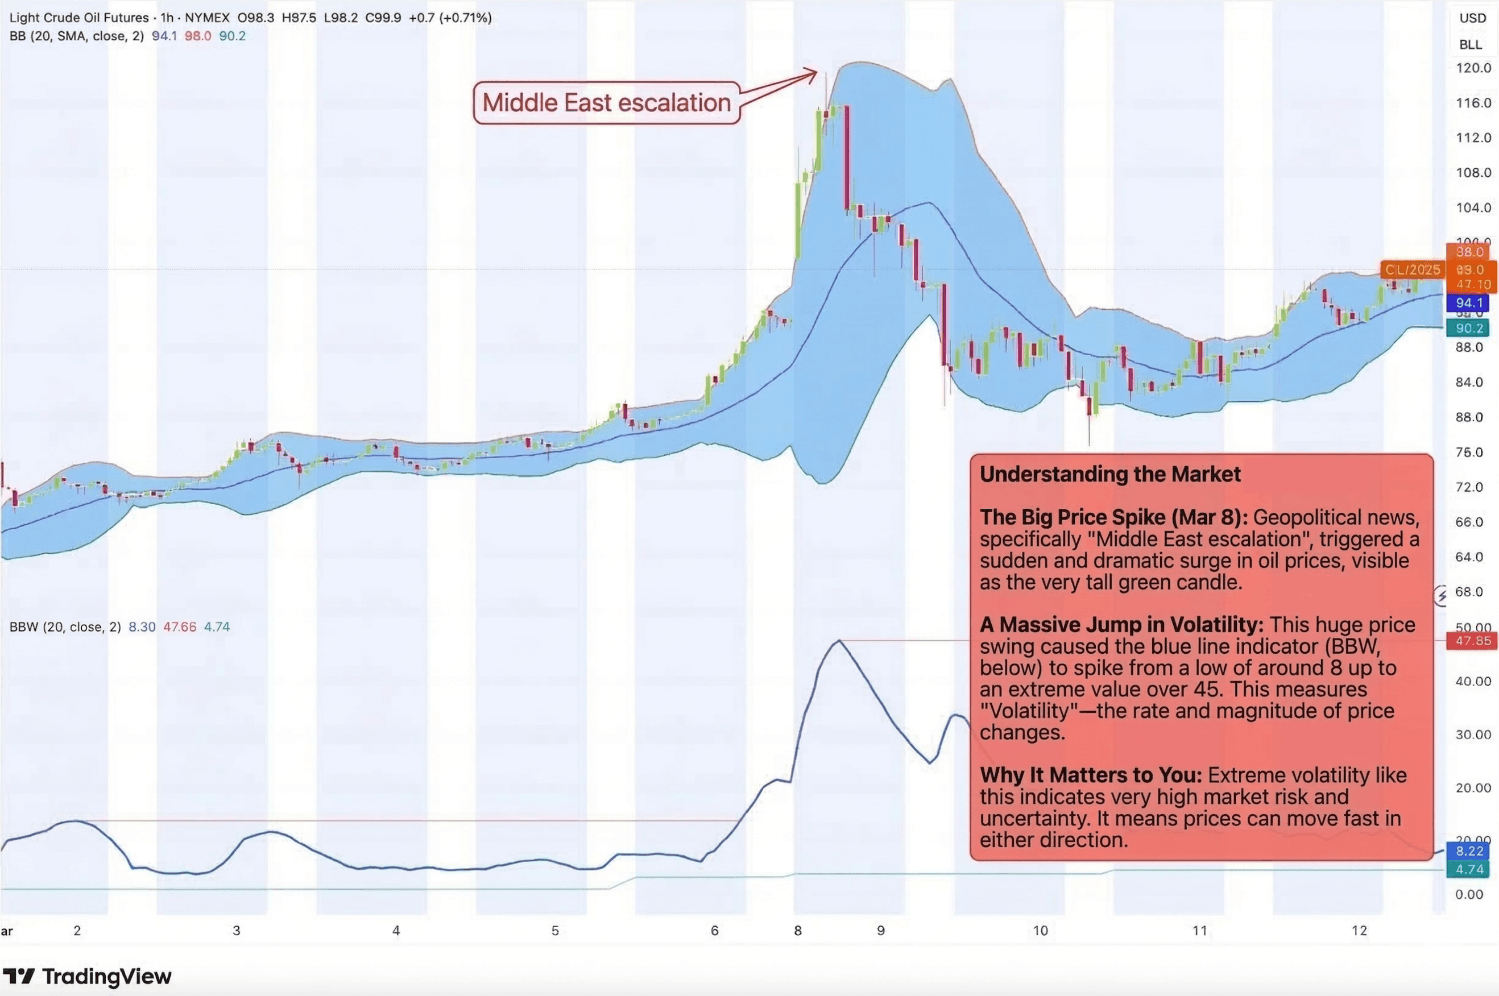
The well-regarded Bespoke Investment Group wrote (emphasis ours) on March 8th, “Crude oil surged 36% this week, the largest weekly gain since at least 1985. The catalyst was the US/Israeli strikes on Iran, which effectively shut down tanker traffic through the Strait of Hormuz. By Friday afternoon, oil was trading above $91/barrel and sitting more than four standard deviations above its 50-day moving average, its most overbought reading in history.”
What happened next?
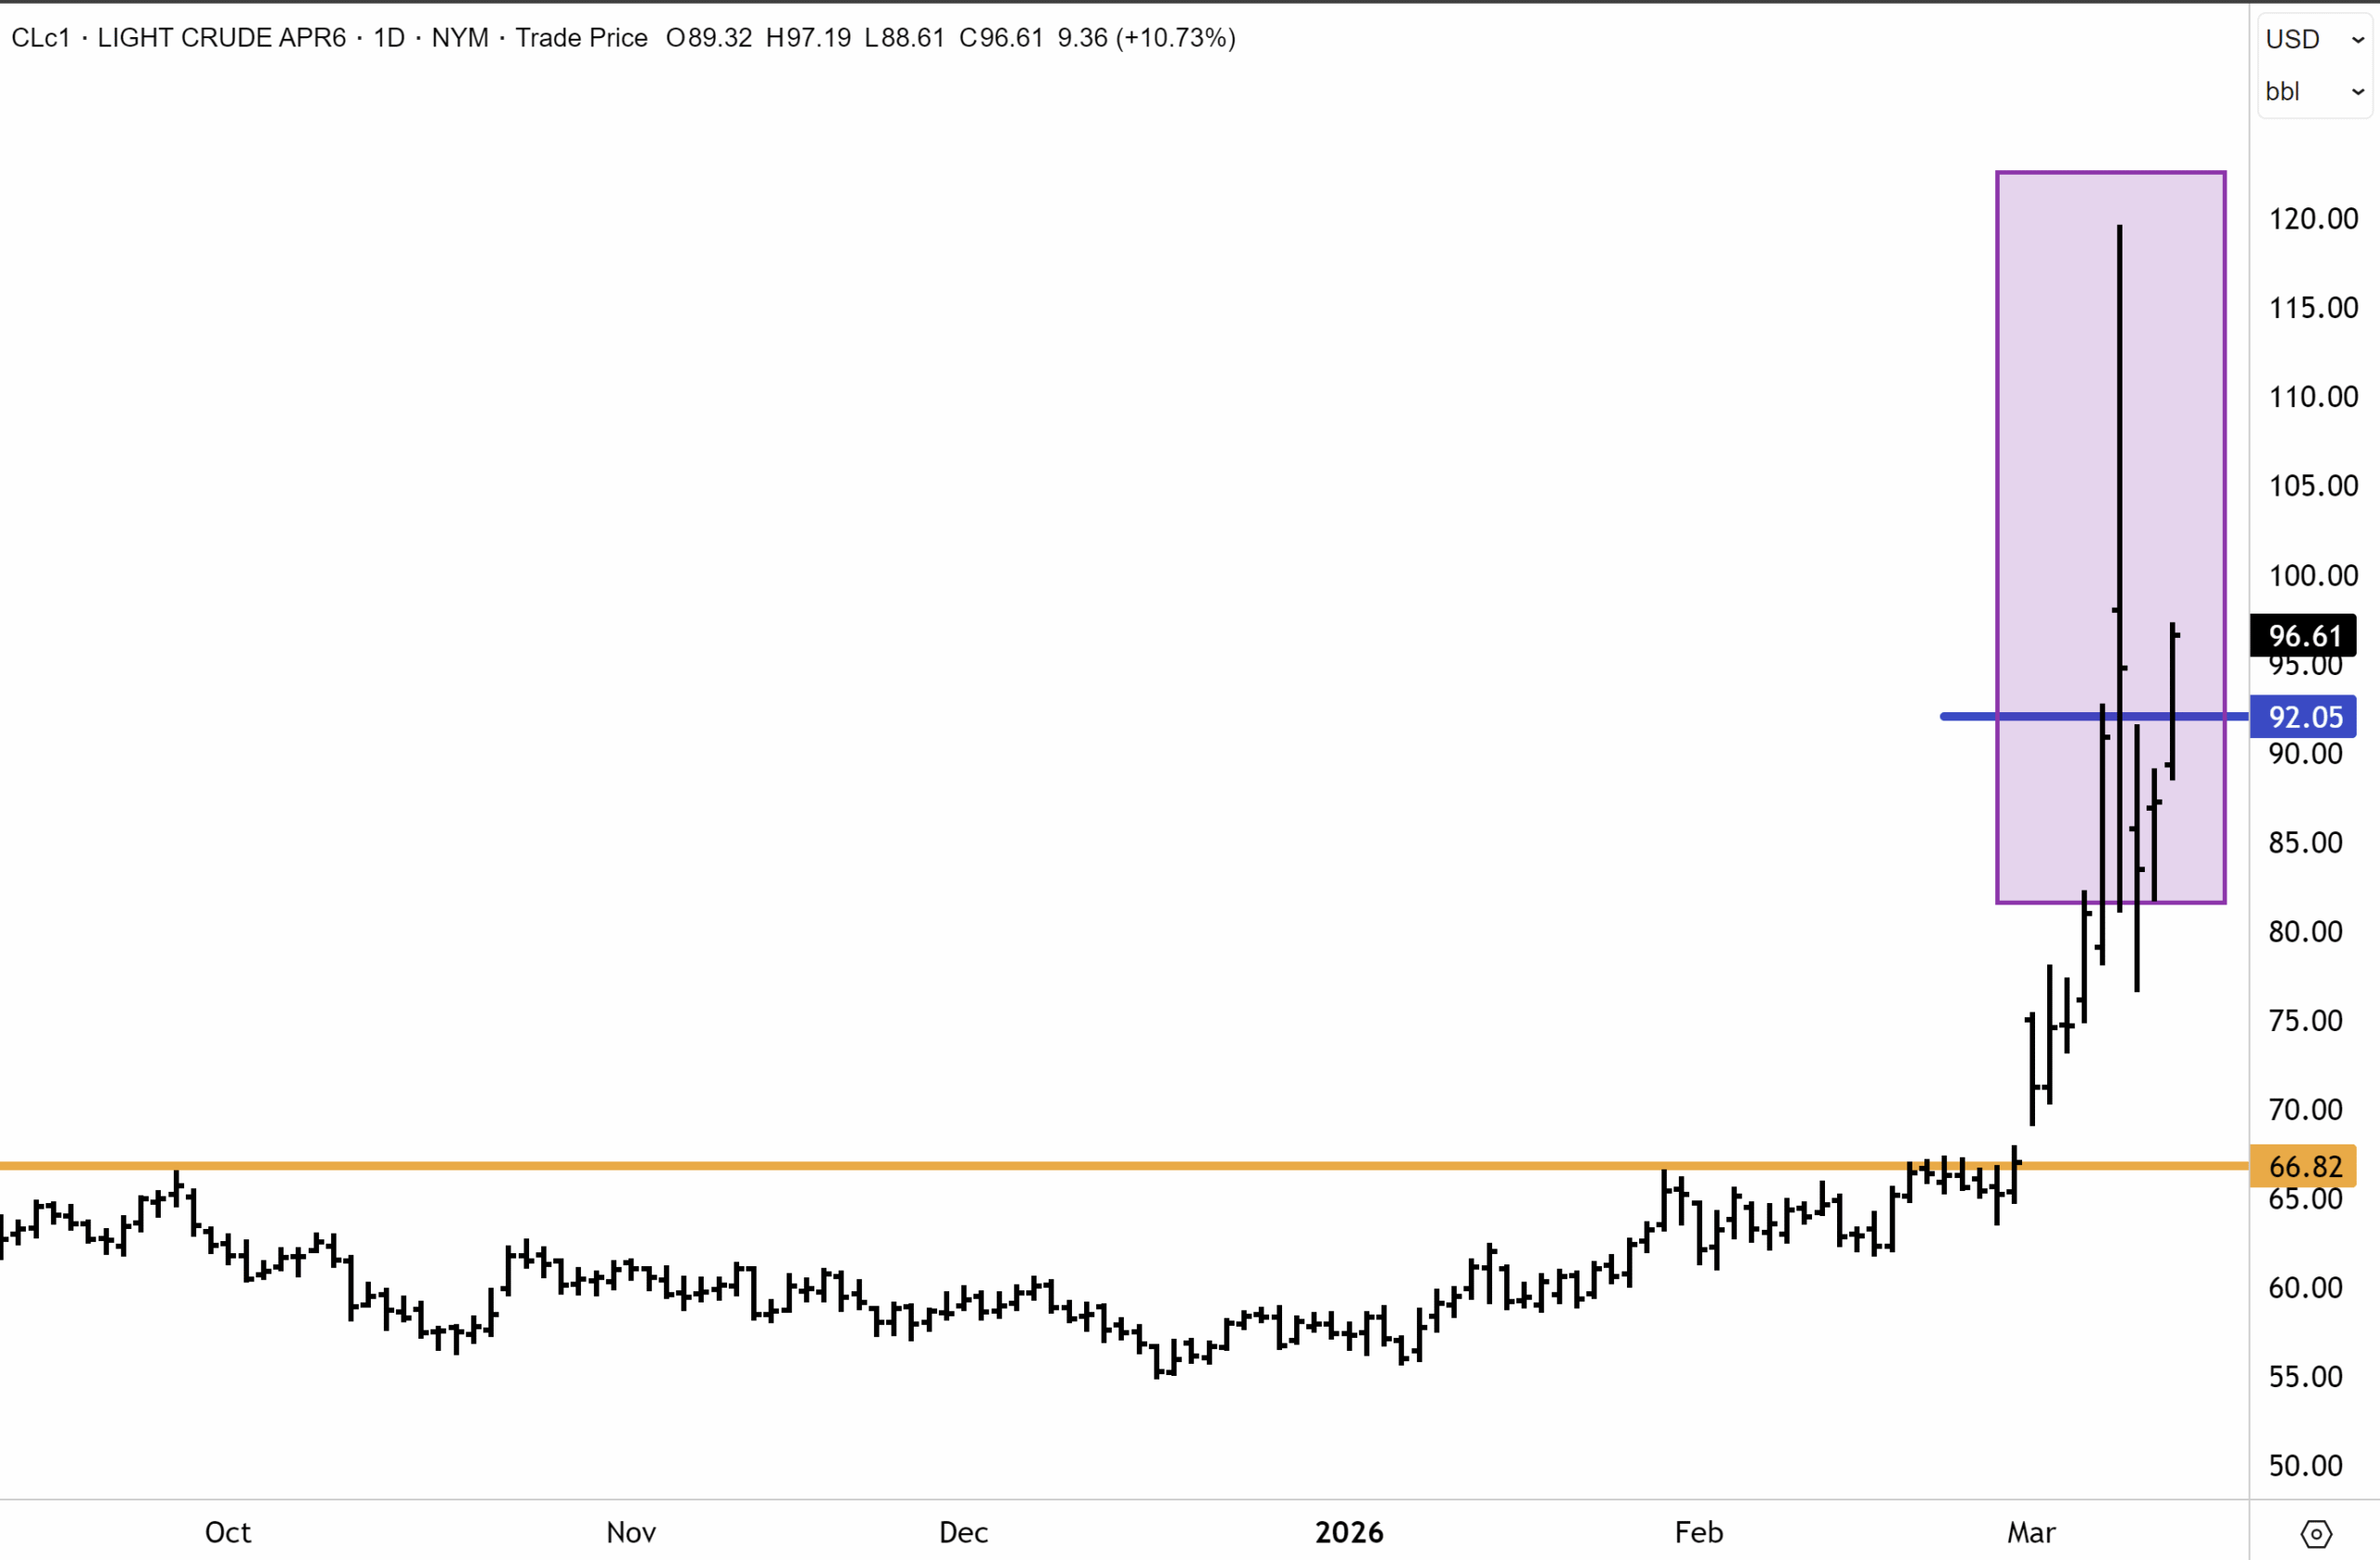
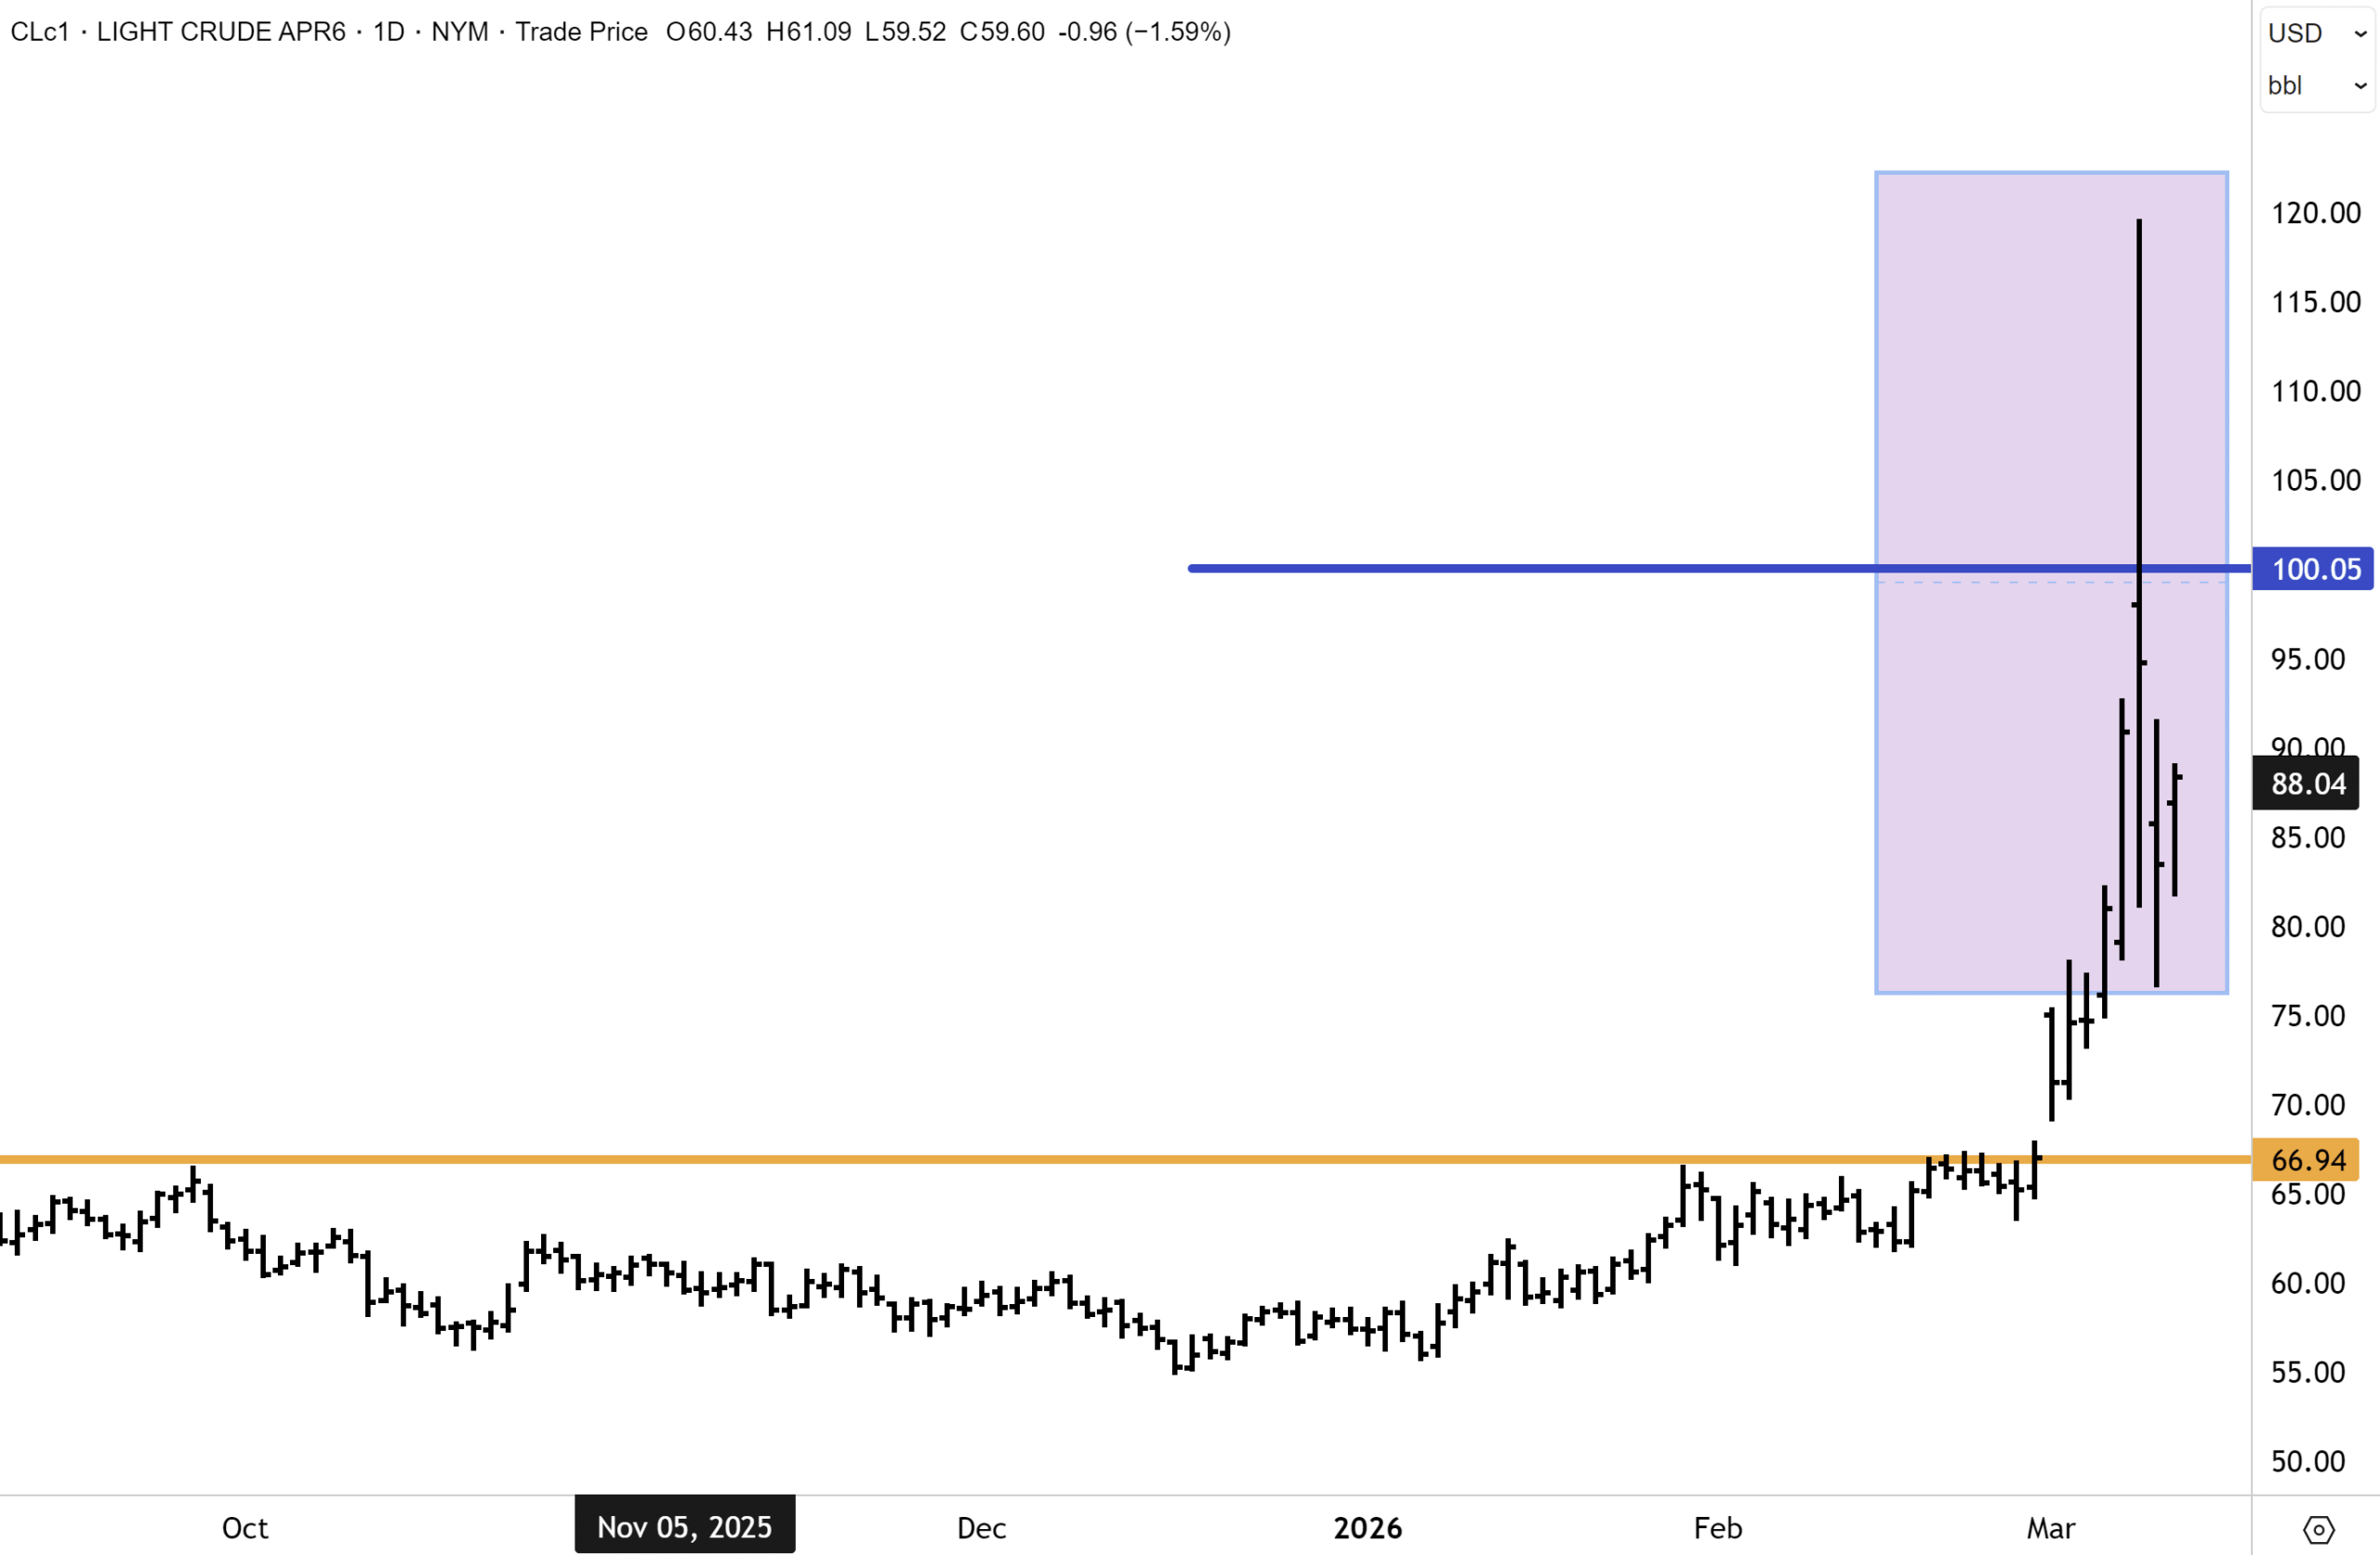
Well, Brent Crude effectively briefly spiked to the $120 a barrel before headlines about Western governments/G7 discussing a coordinated response to high fuel prices took some risk premium out and helped cool the move. The following chart shows Light Crude Oil futures since Epic Fury began.
Wall Street opened weak on Monday. Then came the intraday reversal. Trump told CBS News the war was “very complete, pretty much,” and WTI collapsed back to $85, the largest single-day crude reversal since the 1980s, excluding the pandemic’s negative-price episode. It was a spectacular swing that illustrated the week’s central question. The end date of the Iran war is the most important variable in global markets, and nobody knows it. Markets are trying to price a distribution of outcomes ranging from weeks to months, and that uncertainty could very well be a feature we have to live with for a while.
The mid-week sessions offered some stabilisation. The February CPI report on Wednesday, 2.4% YoY, 0.3% MoM, core at 2.5%, hit consensus on every measure and briefly flattered the macro backdrop. The problem is, of course, that it’s completely outdated. This week, the IEA’s announcement of a record 400-million-barrel strategic reserve release provided some relief again, but trading has remained volatile. On Thursday, during US trading hours, WTI crude rose +11% above $96, while Brent topped $100 as the Strait remained closed.
Monday’s volatility in equity markets was compounded by last Friday’s US non-farm payroll data, showing a 92,000 contraction in February against expectations of an increase. It was the largest decline in four months. January payrolls were revised down to a gain of 126K, while December was revised to a loss of 17K, leaving employment across the two months 69K lower than previously reported. Meanwhile, the unemployment rate edged up to 4.4% from 4.3% and to add insult to injury, wage growth remained firm. Average hourly earnings increased by 0.4% on the month, matching January’s pace and exceeding forecasts. Over the past year, average hourly earnings have been up 3.8%, slightly faster than the 3.7% pace recorded in January.
Job losses in February surprised on the downside.
 That combination – an energy-driven inflation shock colliding with a softening labour market – provided a firm hint of the word that central bankers dread most: stagflation. The February CPI print from the US of 2.4% on Wednesday looked like a data artefact from a calmer era, as it precedes this oil shock. The RBA meets week and we will know its decision on Tuesday. Australian traders spent much of the week positioning for an increased likelihood of a 25bps hike, and local bond yields flew higher. Meanwhile, the Fed will announce on Wednesday.
Signs of distress emerging in the $1.8 trillion private-credit market also weighed on sentiment. Meanwhile, Iran’s new leader, Mojtaba Khamenei, signalled no intention of ending the war. Short-dated bond yields jumped, and the dollar rallied ahead of next week’s FOMC meeting, with rate cuts now priced out for 2026 and the Fed expected to remain on hold.
Goldman Sachs warned that oil prices could exceed the 2008 peak of $148 if flows via the Hormuz Strait remain depressed through March. For each day the war continues, and the Strait is closed, the world is short around 15 million barrels of oil. While energy prices eased earlier this week after the US confirmed strategic reserves would be released, upward pressure has returned with no sign of the ‘fog of war’ clearing and no “off ramp” to the ME war being apparent to the markets.
Iran warned that oil prices will soon hit $200. US Energy Secretary Chris Wright said this was unlikely on CNBC earlier this morning, and the US Navy would start escorting tankers through the Strait of Hormuz, but this is not anticipated until the end of March. Some oil is still being transported from the Gulf in Iranian and Chinese-flagged ships. Oil backed away from intraday highs after reports emerged of Iran allowing these ships to cross the Strait of Hormuz and that mines were not being laid yet. The war has entered its 13th day, with the Strait of Hormuz remaining shut and oil prices reasserted on the topside.
The bond market stirred on Thursday and was volatile at the short end of the curve. Short-dated US2yr yields jumped 11 bps to 3.75% as traders priced out rate cuts this year. The longer end of the curve was better contained with the US10yr adding 4 bps to 4.27%, and the 30yr little changed at 4.88%. Inflation comes into focus later today with the release of the PCE index, which is the Fed’s preferred gauge. The print will likely be benign (reflecting this week’s CPI), but the market will likely look through the February number, which is dated.
With the dollar index rising 0.5% to 99.7, aside from oil, commodities came under pressure. Gold fell 1.6% to $5,100 while silver and platinum dropped 0.9% to $85 and $2,148. Copper declined 0.9% to $5.83oz. Iron ore bucked the trend, surging +4.3% to $108.60. Aside from aluminium, which rose 1.5%, all the other base metals were lower. The Bloomberg Commodity Index added 2.4% to top 135.
Government bond markets saw a pronounced move higher in yields over the past week, reflecting a sharp repricing of interest rate expectations amid heightened geopolitical tensions and surging oil prices. Both US and Australian yields climbed across the curve, though the move was most evident at the front end, where markets are most sensitive to shifts in monetary policy expectations.
As noted above, in the United States, the two-year Treasury yield rose steadily through the week to approach 3.75%, marking one of the largest short-term moves in a while. The benchmark 10-year yield also pushed higher, trading above 4.3% by the end of the period. The parallel move higher in both maturities suggests investors have been reassessing the outlook for Federal Reserve policy as the spike in energy prices raises fresh concerns about inflationary pressures.
Australian government bonds followed a similar trajectory, albeit from higher starting levels. The two-year yield climbed toward 4.5%, while the 10-year yield moved back toward the 5% mark. The move underscores how global bond markets remain tightly linked, with shifts in US rates quickly feeding through to other developed markets.
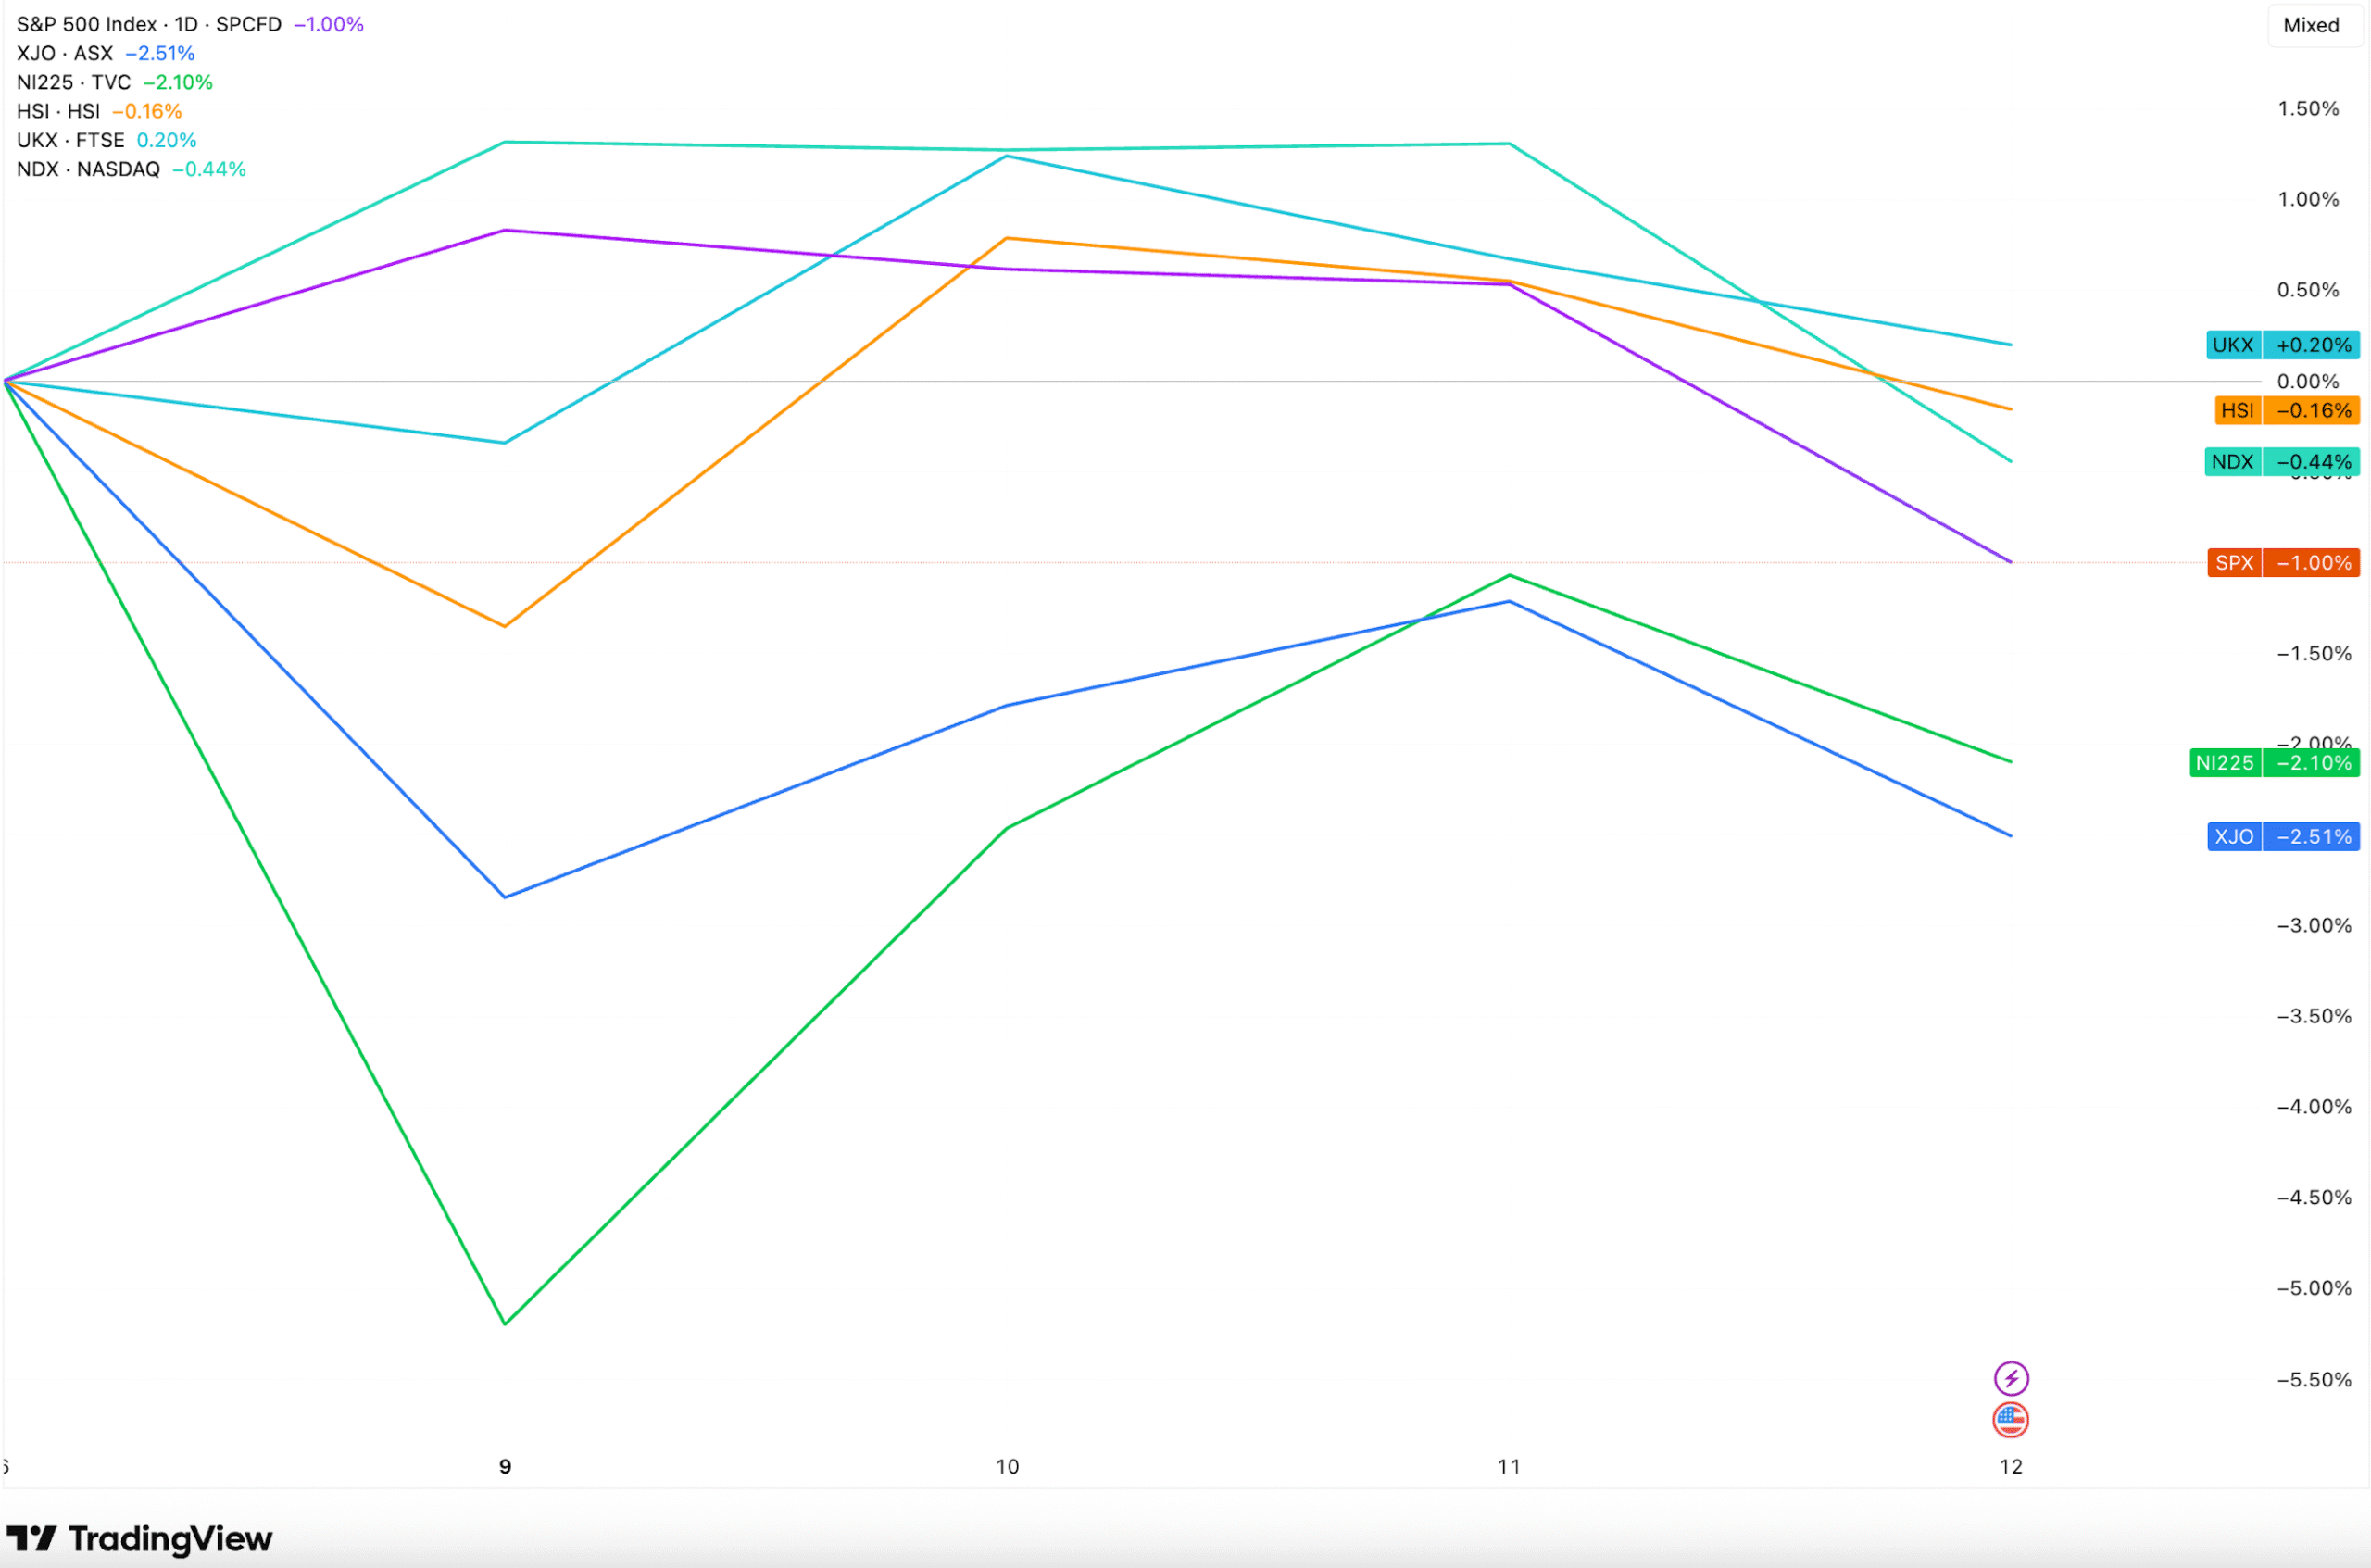
Equity markets, especially in Australia, Asia and Europe, saw big daily moves, but the weekly moves were more modest, as shown in the chart below. Australia and Japan have fared the worst among the majors. Japan is a major energy importer, and higher oil/gas prices are therefore a severe headwind. In Australia, the heavyweight materials sector has been the biggest drag, as USD strength and global growth concerns weighed. Our energy sector is very small relative to the broader market capitalisation, so despite it staging gains, it did little to offset the pain in materials, real estate, healthcare, industrials and tech.
The Week Ahead
PCE data: Later today (Friday morning US time), the Fed’s preferred inflation metric is published. That will provide data for the Fed decision next week. A hold is near-certain. The meeting’s entire value lies in Jerome Powell’s press conference. The market will be listening for whether Powell treats the oil shock as a temporary supply disruption (the 1970s’ first mistake) or acknowledges the stagflationary risk more explicitly. Any shift in the dot plot toward fewer 2026 cuts than previously projected would be a significant signal.
The Reserve Bank of Australia meets next week against a completely transformed backdrop from its February decision. We talk about this more below, but markets have priced in a higher rate risk.
BOJ meeting. A hold at 0.75% is expected. The more interesting question is forward guidance, given the energy shock. Japan’s positive real wage data and strong GDP revision give the board justification to stay the course; watch for any softening in tightening rhetoric as the oil overhang clouds the near-term outlook for an energy-import-dependent economy.
Ongoing — Strait of Hormuz developments
No event on any calendar matters more than this. Watch for any diplomatic track emerging. Any credible ceasefire signal or humanitarian corridor for shipping would trigger a sharp oil reversal and an equity relief rally. Conversely, further attacks on Gulf energy infrastructure will be negative.

We know that the number one issue facing global financial markets right now is the war in the Middle East. The conflict is clearly not abating, and stress in the markets is rising by the day. This week, US banks also began to come under pressure with growing stress in credit markets, and the short end of the US yield curve finally began to rise on Thursday after being quite well contained since the outbreak of war in the ME. Despite all that has happened in the past two weeks, there are similarities with what occurred last April, amidst Liberation Day and the tariffs.
Back then, there was no visible or apparent “off ramp” from the tariff-induced selloff until the Trump Administration alleviated pressure and dialled back rhetoric from initial threats. But this wasn’t before the S&P500 had fallen nearly 20% peak to trough. A huge rally ensued after the government’s pivot, and a “V” shaped recovery followed with the S&P500 making new record highs.
In terms of the ME war, we know what the threats are to the global economy and the stock market. And while stock markets might go lower before a bottom is reached, it makes sense to look through some of the near-term headlines beyond the immediate horizon – which paid off in a major way for investors last year. Those investors who reacted to the headlines and sold near the lows paid a high price when the recovery rally arrived.
Presently, there is no apparent “off-ramp”, but I remain of the view that with mid-term elections approaching at the end of the year, one could soon arrive (likely by the first few weeks in April, in my view) if the Trump Administration pivots. If the status quo war in the ME continues for longer than this time frame, then the Republicans could potentially face losing the upper and lower houses in Congress at the mid-term elections in November.
I don’t think the White House will let things come to this. DJT wants regime recalibration “not change”, and has clearly articulated goals, most of which have now been attained (albeit enriched uranium stockpiles are still a big issue).
We know the risks are high with each passing day that oil prices remain elevated.
The International Energy Agency (IEA) said this week that the Iran war is causing unprecedented turmoil in oil markets, hitting 7.5% of global supply. In their monthly report, the IEA stated that “the war in the ME is creating the largest supply disruption in the history of the global oil market: and estimates that closure of the Strait will slash global oil supply by 8 million barrels a day this month, or almost 250 million barrels in total with flows down 90%. “The resulting price surge, flight cancellations and economic uncertainty are also taking a toll on demand…the effective closure of Hormuz also jeopardises about 4 million barrels a day of regional refining capacity. Constraints on the availability of feedstock limits the ability of other regions to offset the squeeze, posing particular risks for supplies of diesel and jet fuel…”
The risks and stakes are high, especially if another wave of inflation breaks out, leading to central banks collectively hiking rates this year. Under this scenario, DJT would almost certainly lose on a wide front in the mid-term elections at the end of the year (this outcome would not help Israel either). But similar to the tariff-induced selloff last year, when at the bottom and investors assumed the very worst, a pivot might soon arrive. I therefore believe there is a good chance that an ‘off ramp’ to the ME war could arrive, which might involve a negotiated settlement (that reopens the Strait) with Iran’s existing regime and the US government…But the conflict could continue for a few more weeks yet until other key US objectives are secured.
Further volatility is therefore likely before the end of the month. However, I firmly believe that if history is any guide, retreating from markets during periods of heightened volatility is unlikely to be the best strategy over the long term, and that the 2025 playbook is a prescient guide.
It is worth repeating what Morgan Stanley’s CIO, Mike Wilson (the highest-rated strategist in the US), said this week in a podcast I listened to a few days ago. “The stock market is down year to date, and it might have to fall even further before it can resume its bull rally…though stocks have already taken a hit from the US-Iran war, market corrections typically don’t end until the ‘best’ companies and ‘highest quality’ indexes on the market see significant damage…while much of the damage has likely been done to the most vulnerable parts of the equity market, the index remains vulnerable to another 5%-7% downside in my opinion, while crowded stocks could see double digit declines before a final low appears next month.”
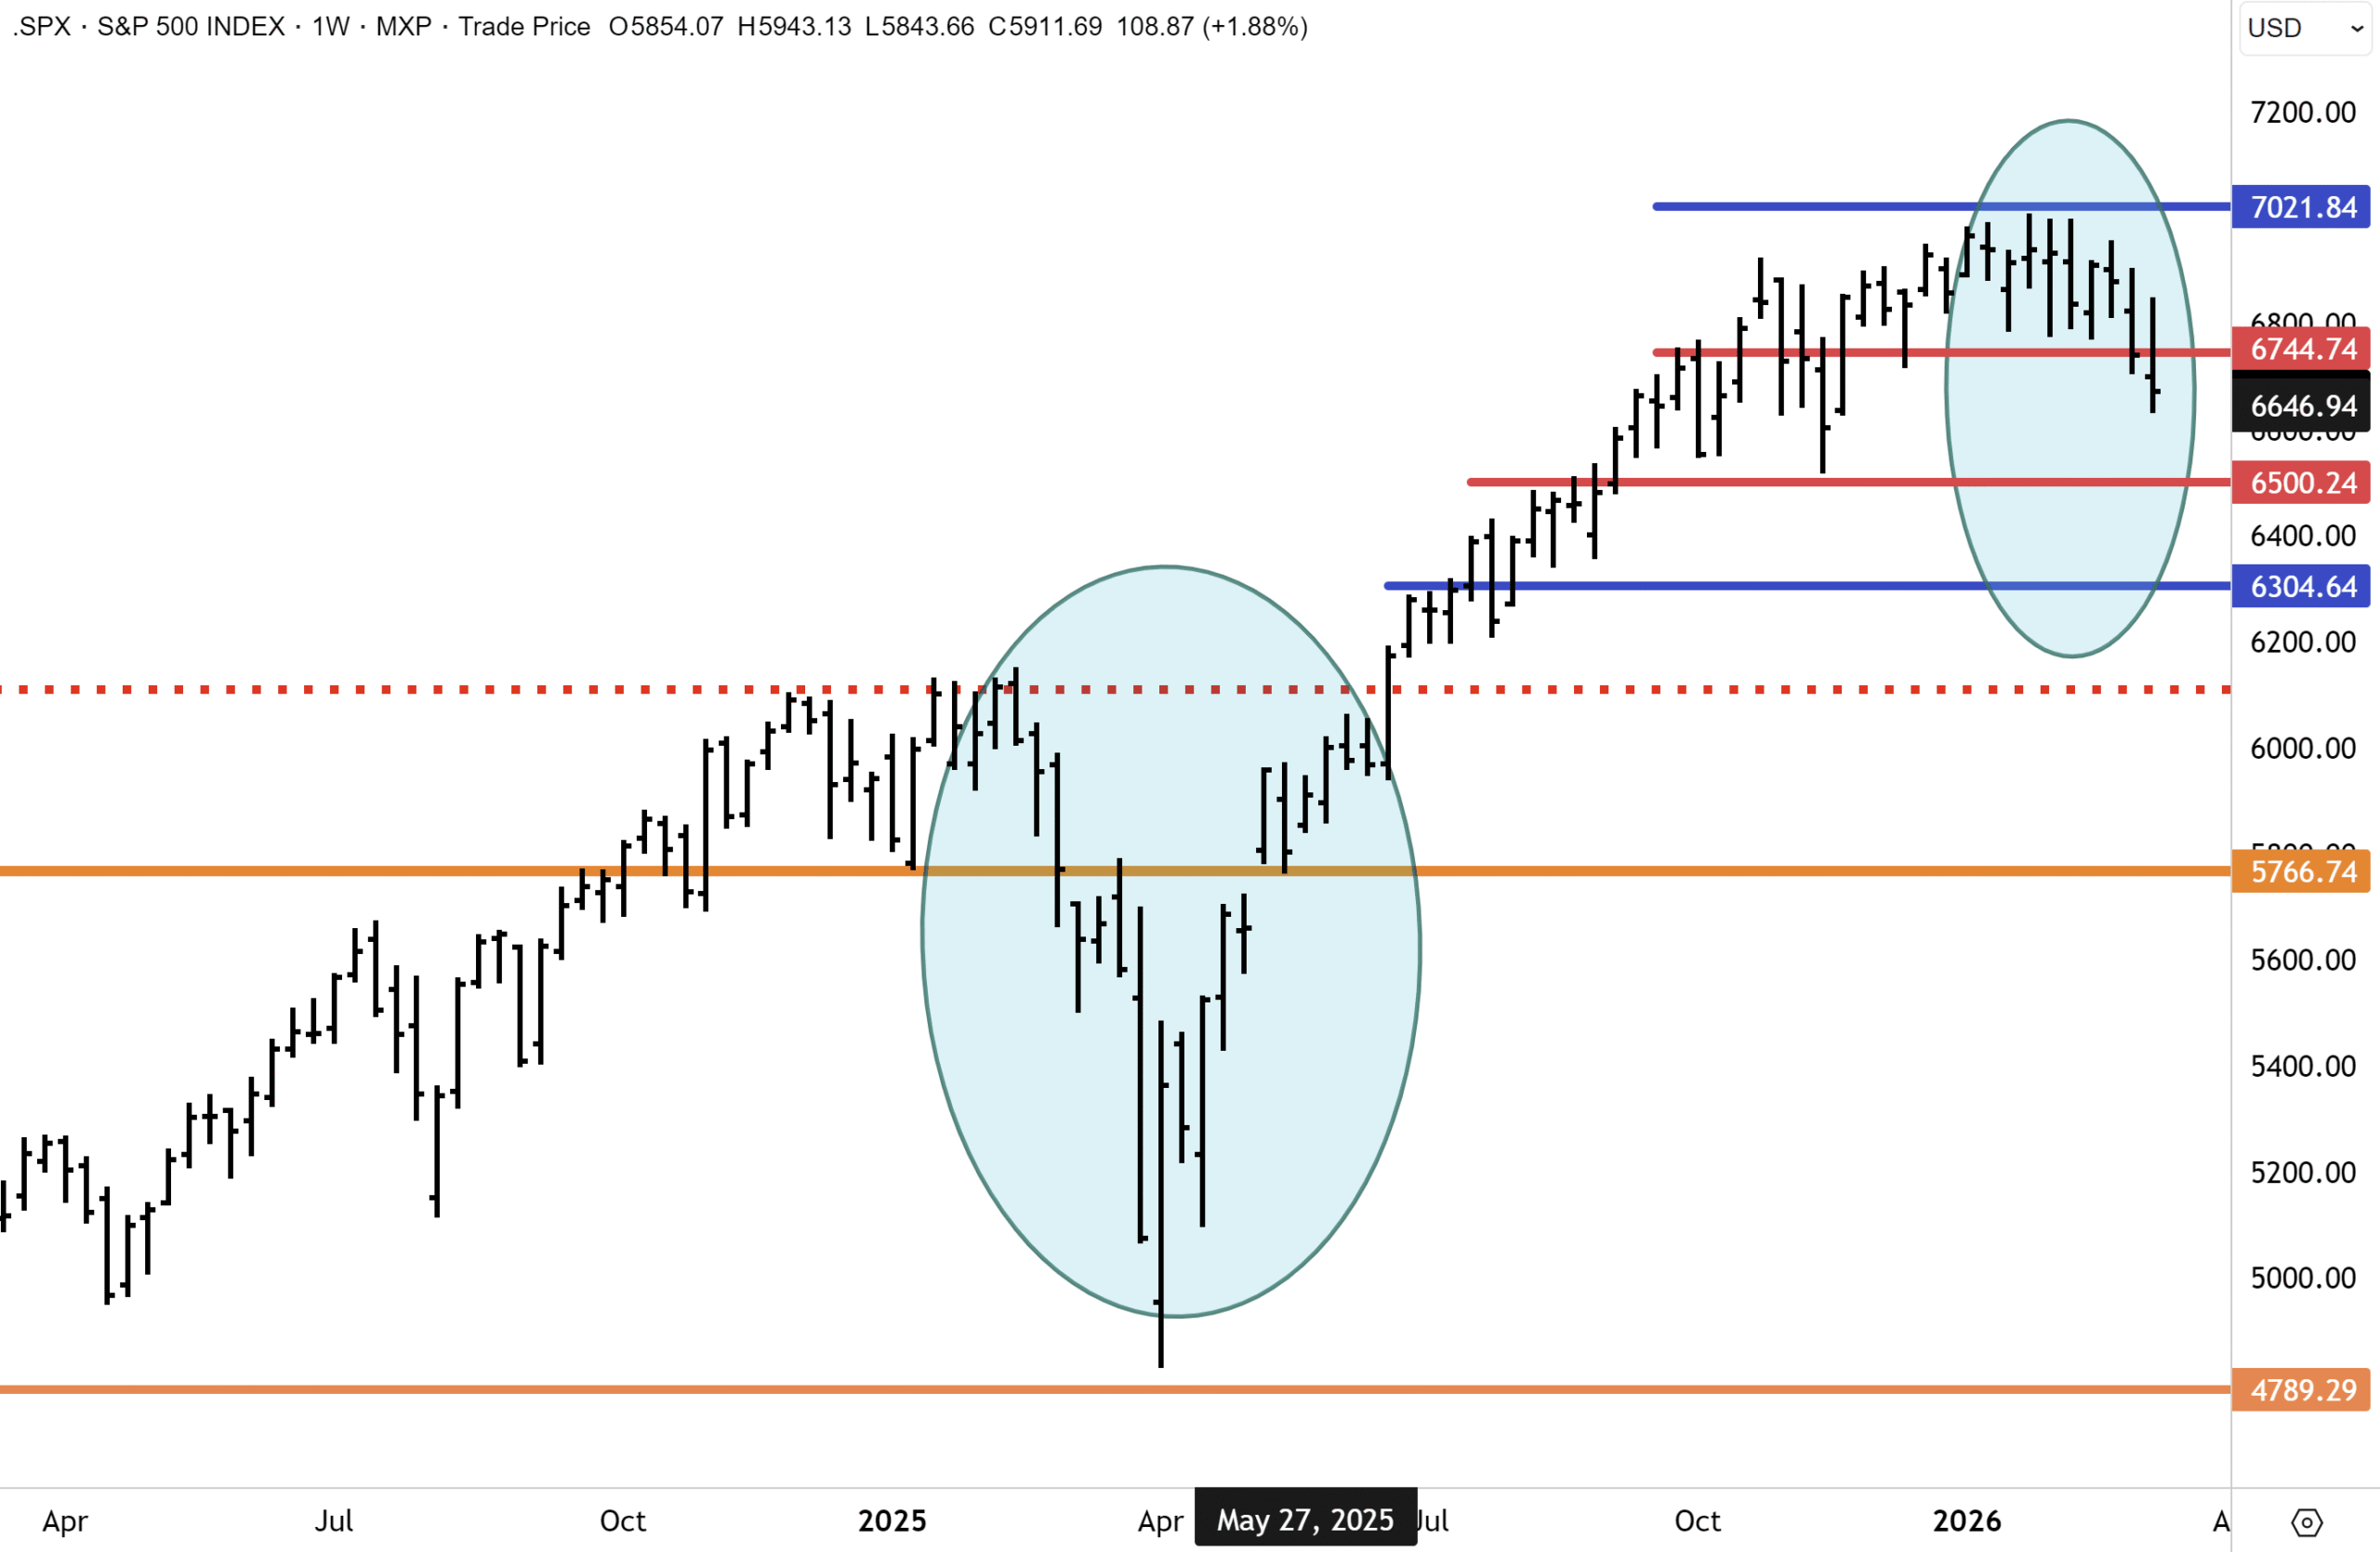
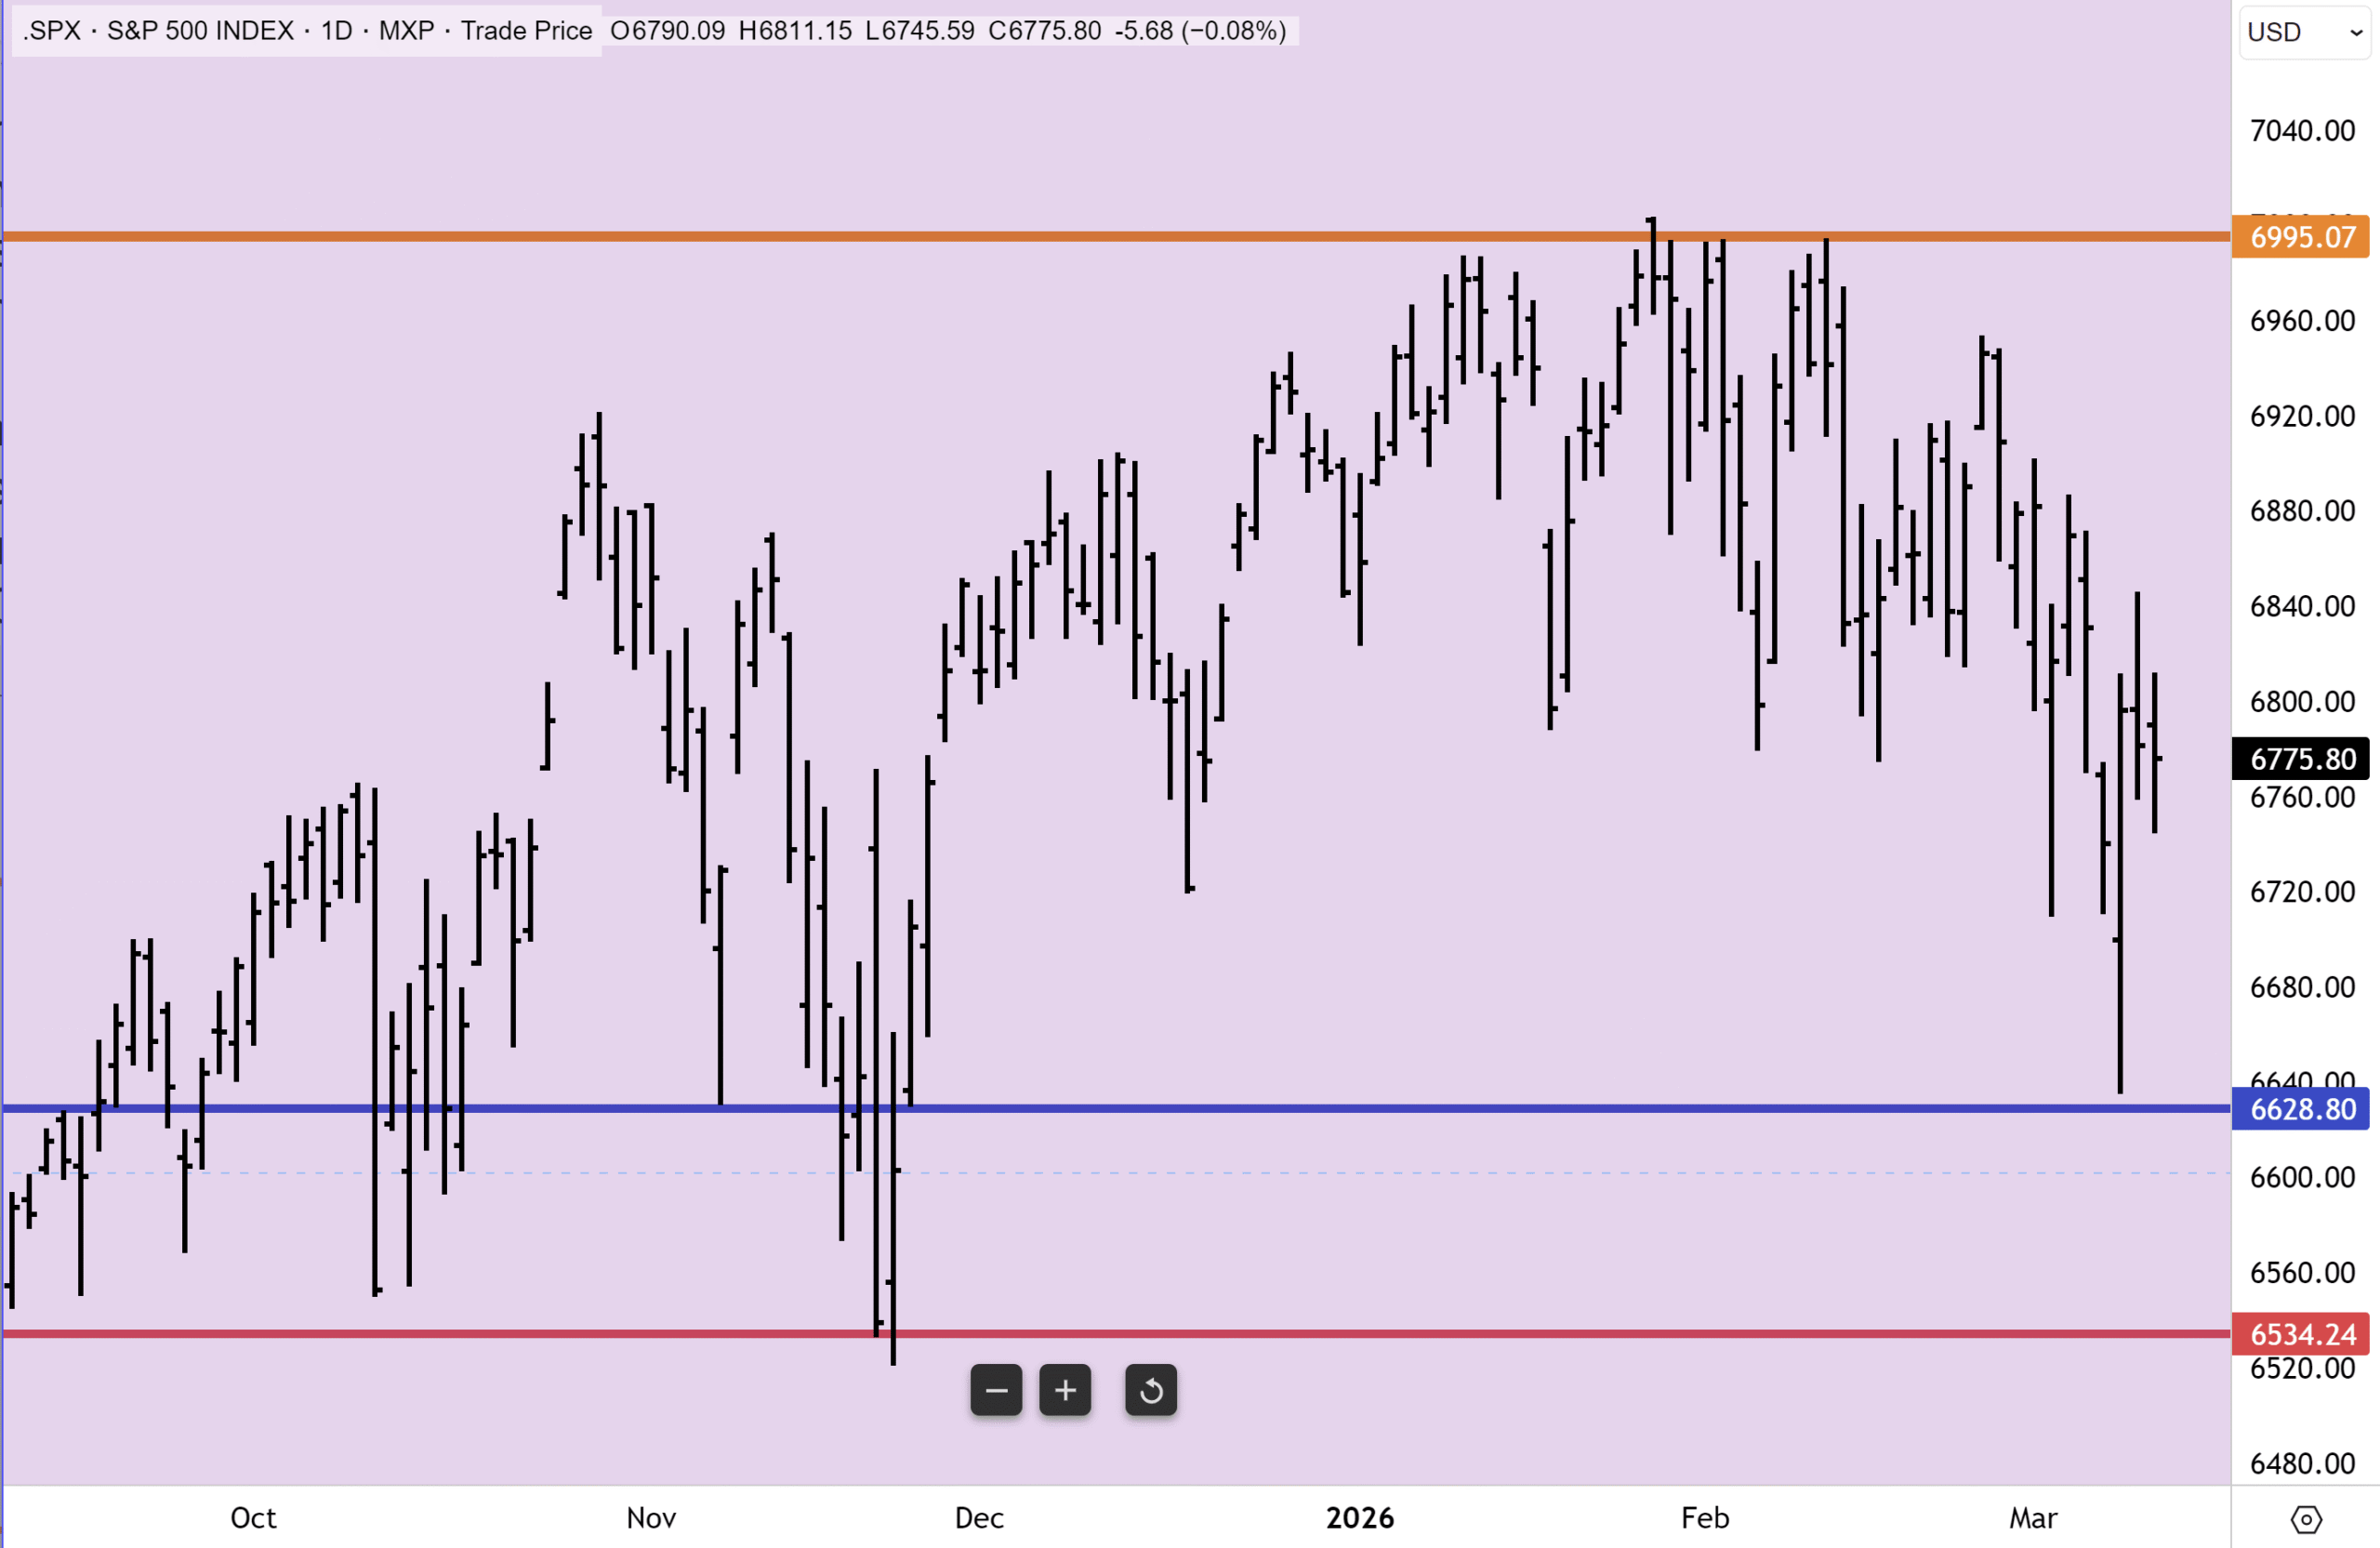
Mike Wilson makes a good point and is looking for the S&P500 to make a final low of around 6,300. With Thursday’s close at 6,672, there is around another 5% of downside or 370 points before Morgan Stanley’s target is met. He highlighted that after DJT introduced a slate of reciprocal tariffs last year, the SPX slid 20% peak to trough. The S&P 500’s losses so far this year, by contrast, haven’t been nearly as devastating, and I am assuming the total fallout from the ME war will be more benign in total this year.
The strategist said that “given the sharp decline last year, it tells me we have another month during which the equity markets are likely to struggle. Based on this simple observation and other technical indicators, I think the S&P 500 could trade toward 6,300 by early April before our favourable fundamental outlook can take hold again…beyond the short-term downside, we see several catalysts that would help push the market higher, supporting our bull thesis.” This includes a favourable and supportive outlook for earnings growth.
I would also add that this year’s broad-based selloff in software (on AI concerns) has likely now come to an end. Additionally, rate cuts have been priced out for this year, but the Fed will likely resume cutting rates before year-end, given the change in leadership (Powell leaves next month), and a view that any higher inflation will be transitory.
With this week’s break below the 6,700/6,750 support level for the S&P500, downside risks have dialled up over the near term. There is a good chance, in my view, that the SPX will extend the March decline over the coming weeks. I would expect the next key support level at 6,500 to be tested before April. It is also plausible that the decline extends further towards the 6,300 support level, lower down.
However, if an off ramp to the ME conflict arrives by April (our base case), a similar V-shaped recovery rally could quickly ensue and play out similarly to last year, which took many investors by surprise. Finally, even under a worst-case scenario, I don’t expect a peak-to-trough decline in the SPX to be on the same scale as what occurred in 2025, when SPX dropped 20%, and the VIX surged to 65.
Mr Wilson concluded the podcast with the comment that “market lows happen faster than tops, so be ready to add risk in anticipation of the bull market resuming later this year.” As always, Mike has great insight into markets. I also believe there is a high probability that stock markets will, in the coming weeks, put in defining bottoms for 2026. My sensibility tells me an “off ramp” is in the pipeline, and while not apparent to the markets yet, it will be unveiled before the end of the month.
Meanwhile, similar to last year, hedge funds, long only financial institutions and investors generally have moved heavily into cash, whilst a lot of deleveraging and hedging has been put in place. When the pivot came in April 2025, the rally off the lows was explosive. A similar dynamic could certainly play out once again this year, and likely in the coming weeks, in my view.
After any large selloff and volatility event, markets tend to retest their lows (the pandemic selloff/crash in 2020 was one notable exception and caught many investors and traders off guard!). I would expect the S&P500 to retest this week’s lows at 6,500/6,600 levels on the SPX to be retested in the coming weeks, and would concede there is risk of an overshoot.
However, I don’t expect the VIX to take out Monday’s highs above 39, and that the high point for the fear gauge has now been set (see below). Earnings have been solid, and upward revisions are coming through on Wall Street for the March quarter. Technology stocks were impacted in February on AI disruption fears – but have likely now found a floor. Valuations are markedly cheaper than at the beginning of the year.
Positioning is also favourable. Overbought conditions have since corrected, with investors swinging bearish. Cash levels have risen. Whilst the Fed is most probably on hold until Jerome Powell departs as Chair in the coming months, incoming head Kevin Warsh will, in my view, push for further easing by June/July.
One longtime Wall Street strategist agrees with our base case, that the worst of the US-Iran war in markets is priced in and might now be passed the acute phase. Jim Paulsen, the former chief investment strategist of well-regarded Leuthold Group, said that while he is not certain when the market might bottom, “investors are already showing a few positive signs they’ve adjusted significantly in response to the conflict in the ME, potentially setting stocks up for better days ahead. “I would not be shocked if the S&P 500 still suffers a correction. But I do increasingly believe the financial markets are already showing some positive signs of renewal.”
I agree with this outlook and expect the S&P500 to possibly retest this week’s lows at some point in the coming weeks, but for any further downward leg to be accompanied by much lower volatility. There is a good chance that the SPX makes a final low around the 6,500 level. Jim Paulson believes that “the vetting process which plays out during crises is already pronounced, and this historically has been a good sign that the worst may already be over.”
The US and global stock markets had already had a difficult start to the year, with global technology companies taking a battering on AI disruption fears. But valuations for the sector are now much lower, and this should help the stock market find a floor much more quickly.
Mr Paulson believes that oil prices appear to have peaked, which I would agree with. The selloff in oil prices since Monday and the large intraday reversal have been revealing. Oil’s decline and failure to hang onto a $100 handle has removed a major fear for investors where higher energy prices could stoke inflation, lower economic growth and risk stagflation. (Having said that, I don’t expect oil to fall below $66 anytime soon).
Another one of Jim Paulson’s points is that the risk of a recession has declined. “The sharp drop in crude prices has led investors to meaningfully dial back their recession outlook. The market probability of a recession this year rose to around 40% when oil prices hit a peak, but the probability of a downturn has since dropped to 29%,” citing data from the online betting platform Polymarket.
He also believes that investor sentiment and positioning have turned more cautious. “Investor sentiment has plummeted since the start of the US-Iran war, a contrarian signal for stocks that has historically suggested that markets could rally. The four-week rolling moving average of the AAII’s Bull Less Bear Stock Market Sentiment Index, [a gauge of investor sentiment], is currently below 0, indicating that more investors are bearish on stocks than bullish at the moment, while economic news sentiment looks like it could be at a bottom.” I agree with this point, and bearish sentiment when extreme is often a precursor to a change in direction.
While the stock market is no longer as much on the front page or lead story with most news outlets, this is another reliable contrarian signal that often coincides with a bottom and pending rebound in stocks. Mr Paulsen cited the “San Francisco Fed’s Daily News Sentiment Index which has declined to a level of -0.11, its lowest reading since the start of the year. Although the adjustment to a sudden downward shift in economic news is usually not pleasant for stock investors, once investors adjust to the most recent change in the news, much of the stock market carnage is generally over.” He also referenced the market’s put-call ratio, which has risen sharply and is a measure of how bearish traders are. When skewed heavily in one direction, this can also be a good contrarian indicator.
“During difficult times in the stock market, the put/call ratio typically begins adjusting higher. When the ratio moved meaningfully higher, it typically indicates a good time to purchase the S&P 500. Is this adjustment by investors indicating yet another S&P 500 rally is nearing?”
The bottom line, and similar to Jim Paulson and Mike Wilson, I expect further gyrations in financial markets, but the acute volatile phase has now likely passed. A retest of Monday’s lows by the S&P500 will likely be accompanied by lower volatility. I don’t expect oil prices to take out Monday’s highs. With technology stocks finding support this week (and holding up much better relative to the broader market), the S&P500 and other key benchmarks should soon find a floor. The corrective selloff in financial markets is therefore most probably nearer to the end than the beginning.
During the Napoleonic wars, including the “Battle of Waterloo”, Baron Nathan Rothschild famously said that investors should “Buy when the cannons are firing, and sell when the trumpets are blowing.” In other words, buy during the time of maximum panic, which captures the idea of acting contrarian and accumulating assets during periods of war, panic, or extreme fear, and lighten up when conditions are calm, and optimism is widespread. Baron Rothchild makes some good points, and when it becomes clearer to investors that the war in the ME and oil prices are losing momentum, markets will likely have already rallied and moved on.

The Reserve Bank of Australia deputy governor Andrew Hauser struck a hawkish tone ahead of next week’s policy meeting, warning that the recent jump in oil and petrol prices is likely to push inflation above the central bank’s 4.2% June-quarter forecast and raise the risk that short-term inflation expectations become harder to contain.
Mr Hauser said inflation was already running too high before the latest Middle East-driven energy shock, with the labour market still tight at a 4.1% unemployment rate and economic growth of 2.6% sitting above the pace the RBA sees as consistent with low inflation. Against that backdrop, he argued the board cannot afford to leave policy too loose for too long, because a failure to keep expectations anchored could entrench a more damaging inflation cycle for households and businesses.
His comments add to signs that the board remains uneasy about second-round inflation effects from higher fuel costs. He said inflation now looked set to exceed the RBA’s published forecast by mid-year, although not necessarily reach the 5% pace some private-sector economists have floated under a $US100-a-barrel oil scenario. Even that is certainly well below the 6.1% level the ANZ-Roy Morgan survey’s weekly consumer inflation expectations pointed to on Tuesday, marking the biggest weekly increase since the series began in 2010 and the highest reading since November 2022. These numbers have a historical tendency of running well above inflation, likely due to the consumer fear effect.
Mr Hauser’s warning reflects the bank’s concern that another energy-led inflation pulse, similar to the surge seen in 2022, would make the path back to target even longer. Hauser said longer-term expectations still appear reasonably anchored, but the latest data will do little to ease concerns inside Martin Place that inflation psychology could become more persistent. Personally, I believe the RBA should continue to watch events in the ME closely. If oil prices remain contained below $95/$100 a barrel and the conflict normalises quickly, then the RBA risks “over-tightening” with a knee-jerk reaction next week. The RBA might then be forced to cut in a few months if the War ends quickly, which would be very confusing for markets.
Meanwhile, other data dropped. Consumer sentiment turned higher in March, with the Westpac-Melbourne Institute index rising +1.2% to 91.6, its first gain since November, though the reading remains in pessimistic territory below the neutral 100 mark. The NAB Business Confidence survey was more sobering. The index turned negative in February, falling to −1 from +4 in January, the first sub-zero result since April, as firms absorbed the February rate increase and fresh cost pressures. I note, too, that this survey only captured the very beginning of the US-Israeli strikes on Iran.
With the RBA board convening next week, the debate between hold and hike has sharpened noticeably. Bank of America is forecasting another rate increase, while Westpac and AMP economists see a stronger case to pause (which I agree with), arguing that any inflation lift from elevated energy prices could be temporary if the conflict moves toward resolution. We totally lean this way.
Markets will now focus on whether next Tuesday’s decision is also accompanied by firmer language on upside inflation risks, especially after Governor Michele Bullock recently flagged the importance of keeping expectations contained.
Riding the volatility – when the ASX200 has a big move on the day, just how big a deal is it historically?
A fall of 2%, let alone the 2.85% drop we saw yesterday, is dominating the news cycle, which leads to fear and a lot of emotional trading. Big days are always emotional days, and fear is a stronger emotion than greed when it comes to large market drawdowns, like we saw yesterday. On these days, the satisfaction investors generally obtain from seeing their portfolio value rise (over time) tends to be overridden.
Down days are the sort of days people remember… but it’s always important to take stock and focus on what actually tends to happen next?
While we have seen many similar studies undertaken for US data, we decided to dig into it and looked at the last 20 years of daily ASX 200 moves, from March 9, 2006, to yesterday. In total, that gave us 5,056 trading days to work with, and we used closing prices. Over that period, the typical daily volatility in the index was about +1.1%, measured as the average standard deviation.
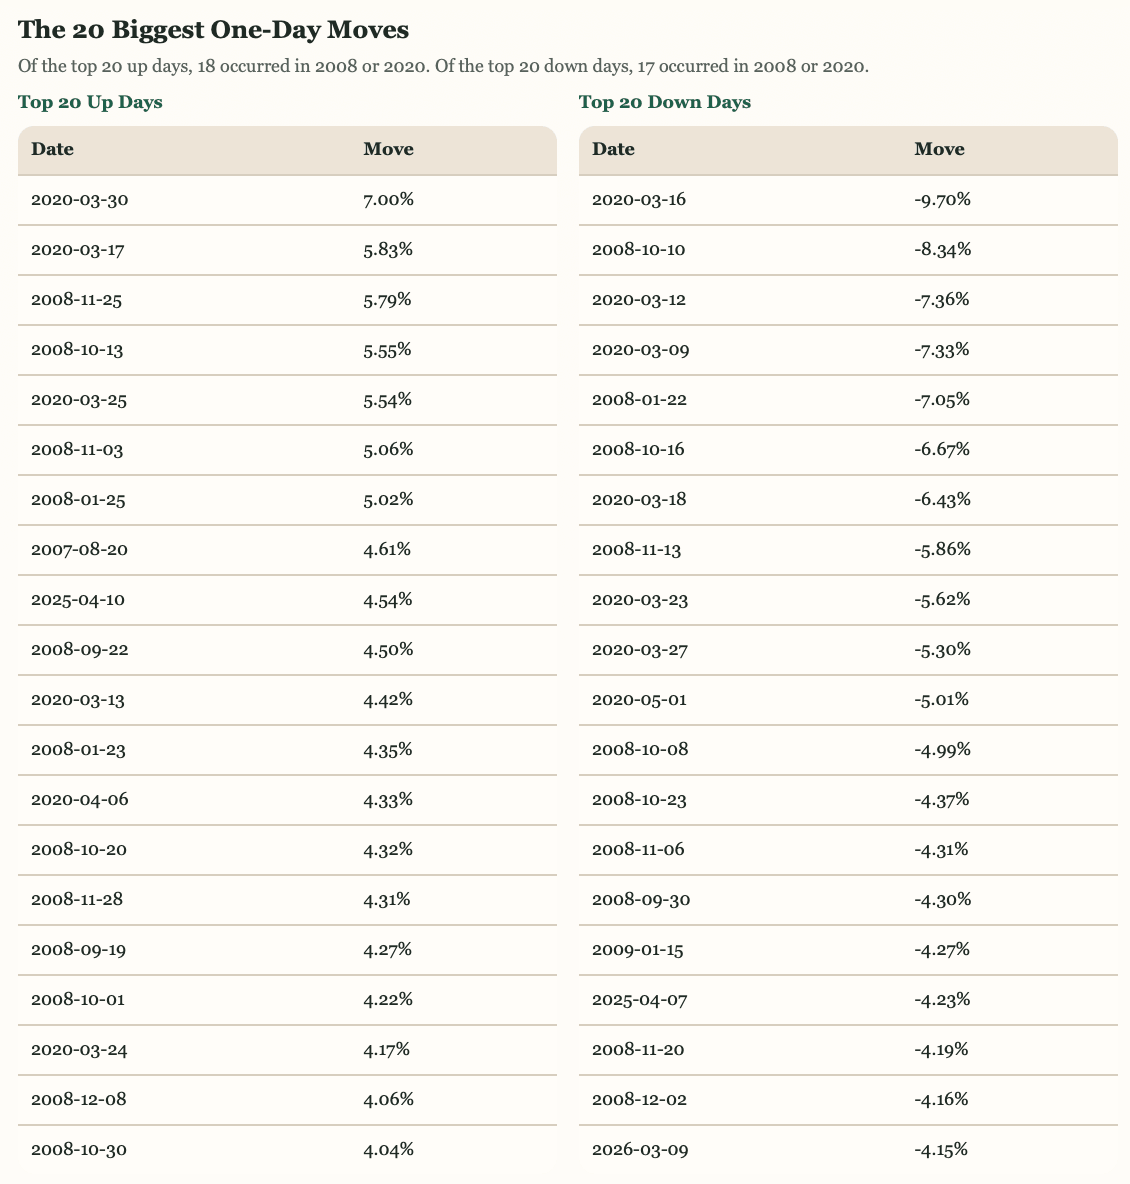
In other words, the market often moves around more than investors expect, even in normal conditions. The worst one-day fall in our sample was about 9.7%, which occurred during early COVID times – mid-March 2020!), while the biggest one-day gain was about 7% (also during Covid, but at the end of March 2020).
The first useful point is this. A 2% move on the day is unusual, but not freakish or an outlier. Admittedly, 3% moves, such as we saw close to yesterday, are rarer, and occur about a couple of times per year (though it is when they occur in clusters that is more worrying and also when weakness extends across the day, and the closes on the lows. This didn’t happen yesterday when the index closed down, but well above yesterday’s lows.
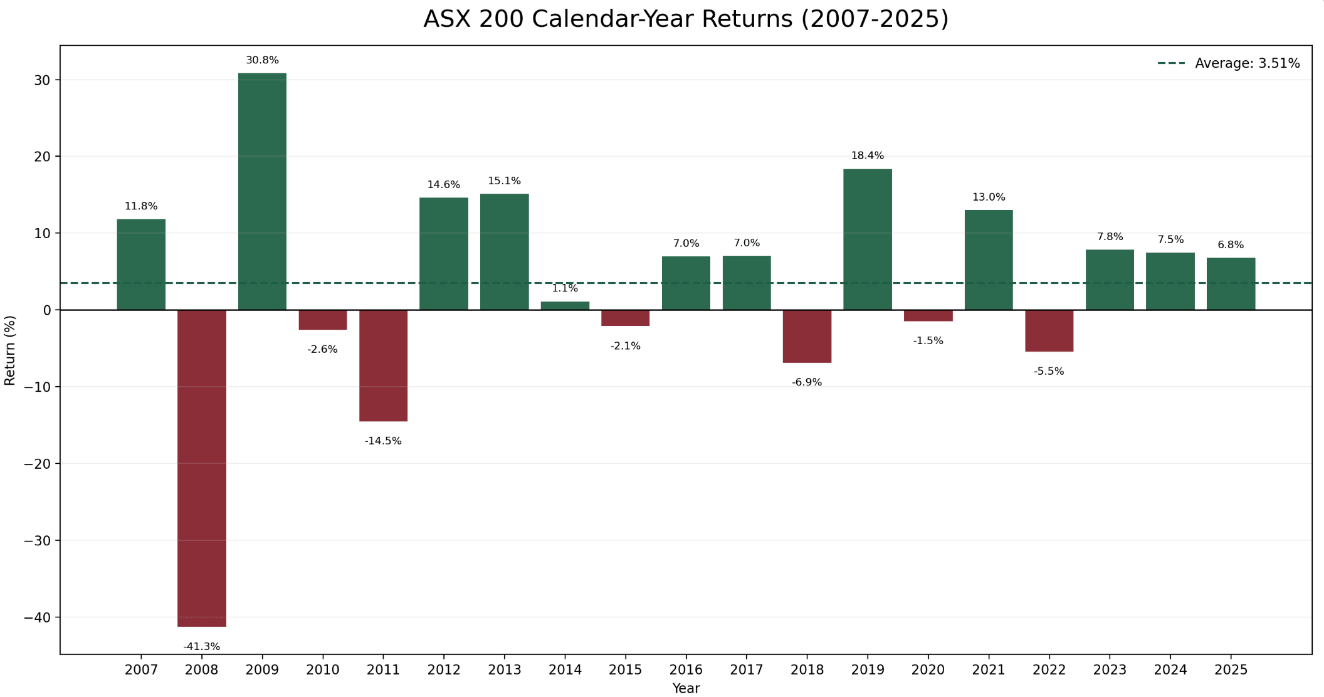
During 2008 and 2020, in our study, they were dramatic years, no two ways about it. In 2008, the ASX200 plunged by 41.3%. In 2020, the decline was initially similar, but the outcome ended very differently as Australia recovered quickly.
Looking at the stats, a 2% fall happened on 164 occasions, roughly 1 in every 31 trading days, or about 3.2% of sessions. A 2% gain happened on 114 occasions, or roughly 1 in every 44 days. Move beyond 2%, and the events become genuinely rare. Falls of 3% or more occurred just 50 times over 20 years, about twice a year on average. Falls of 4% or more, just 23 days. Falls of 5% or more, just 11 days across the entire two-decade sample. So a 2% day is definitely not routine, but it is part of the normal long-run behaviour of equity markets. Move to 3% and beyond, and you’re in rare-event territory.
At one stage, the ASX200 was down more than 4% yesterday, and that is very rare. When we ranked the 20 biggest up days and 20 biggest down days in the sample (which all exceeded 4% in either direction), they were almost all concentrated in just two periods. The GFC in 2008 and the COVID shock of March 2020. Of the top 20 up days, 18 came from one of those two episodes – the 4.2% drop linked to Liberation Day in April last year was one of the exceptions. Of the top 20 down days, 17 did.
Extreme days don’t usually arrive randomly. They often cluster, arriving in bursts when the market is under severe stress, and then largely disappearing again. The Middle East war that arrived about 10 days ago was an outlier event, with markets taken by surprise, and our base case is that with US markets taking the day-to-day events in stride and proving quite resilient, the reaction in Australia and Asia appears more severe. Sequentially, we would not be surprised if the lows are potentially now in for these markets.
Still, living through them in real-time is nerve-wracking, and the benchmark ASX200 is down 6.5% over the past week, which is material, but exogenous shocks like this are still relatively common (we don’t need to dig into our stats book for that. Think of Covid, Ukraine, Liberation Day, multiple ME events).
What Actually Happened Next?
After a down day of +3% or worse, the average forward return over the next year is more often positive than negative. The short answer is that the market’s history of recovery after big down days is considerably better than the emotional experience of those days would suggest on average, though not always, of course, with the GFC in 2008 being a notable exception.
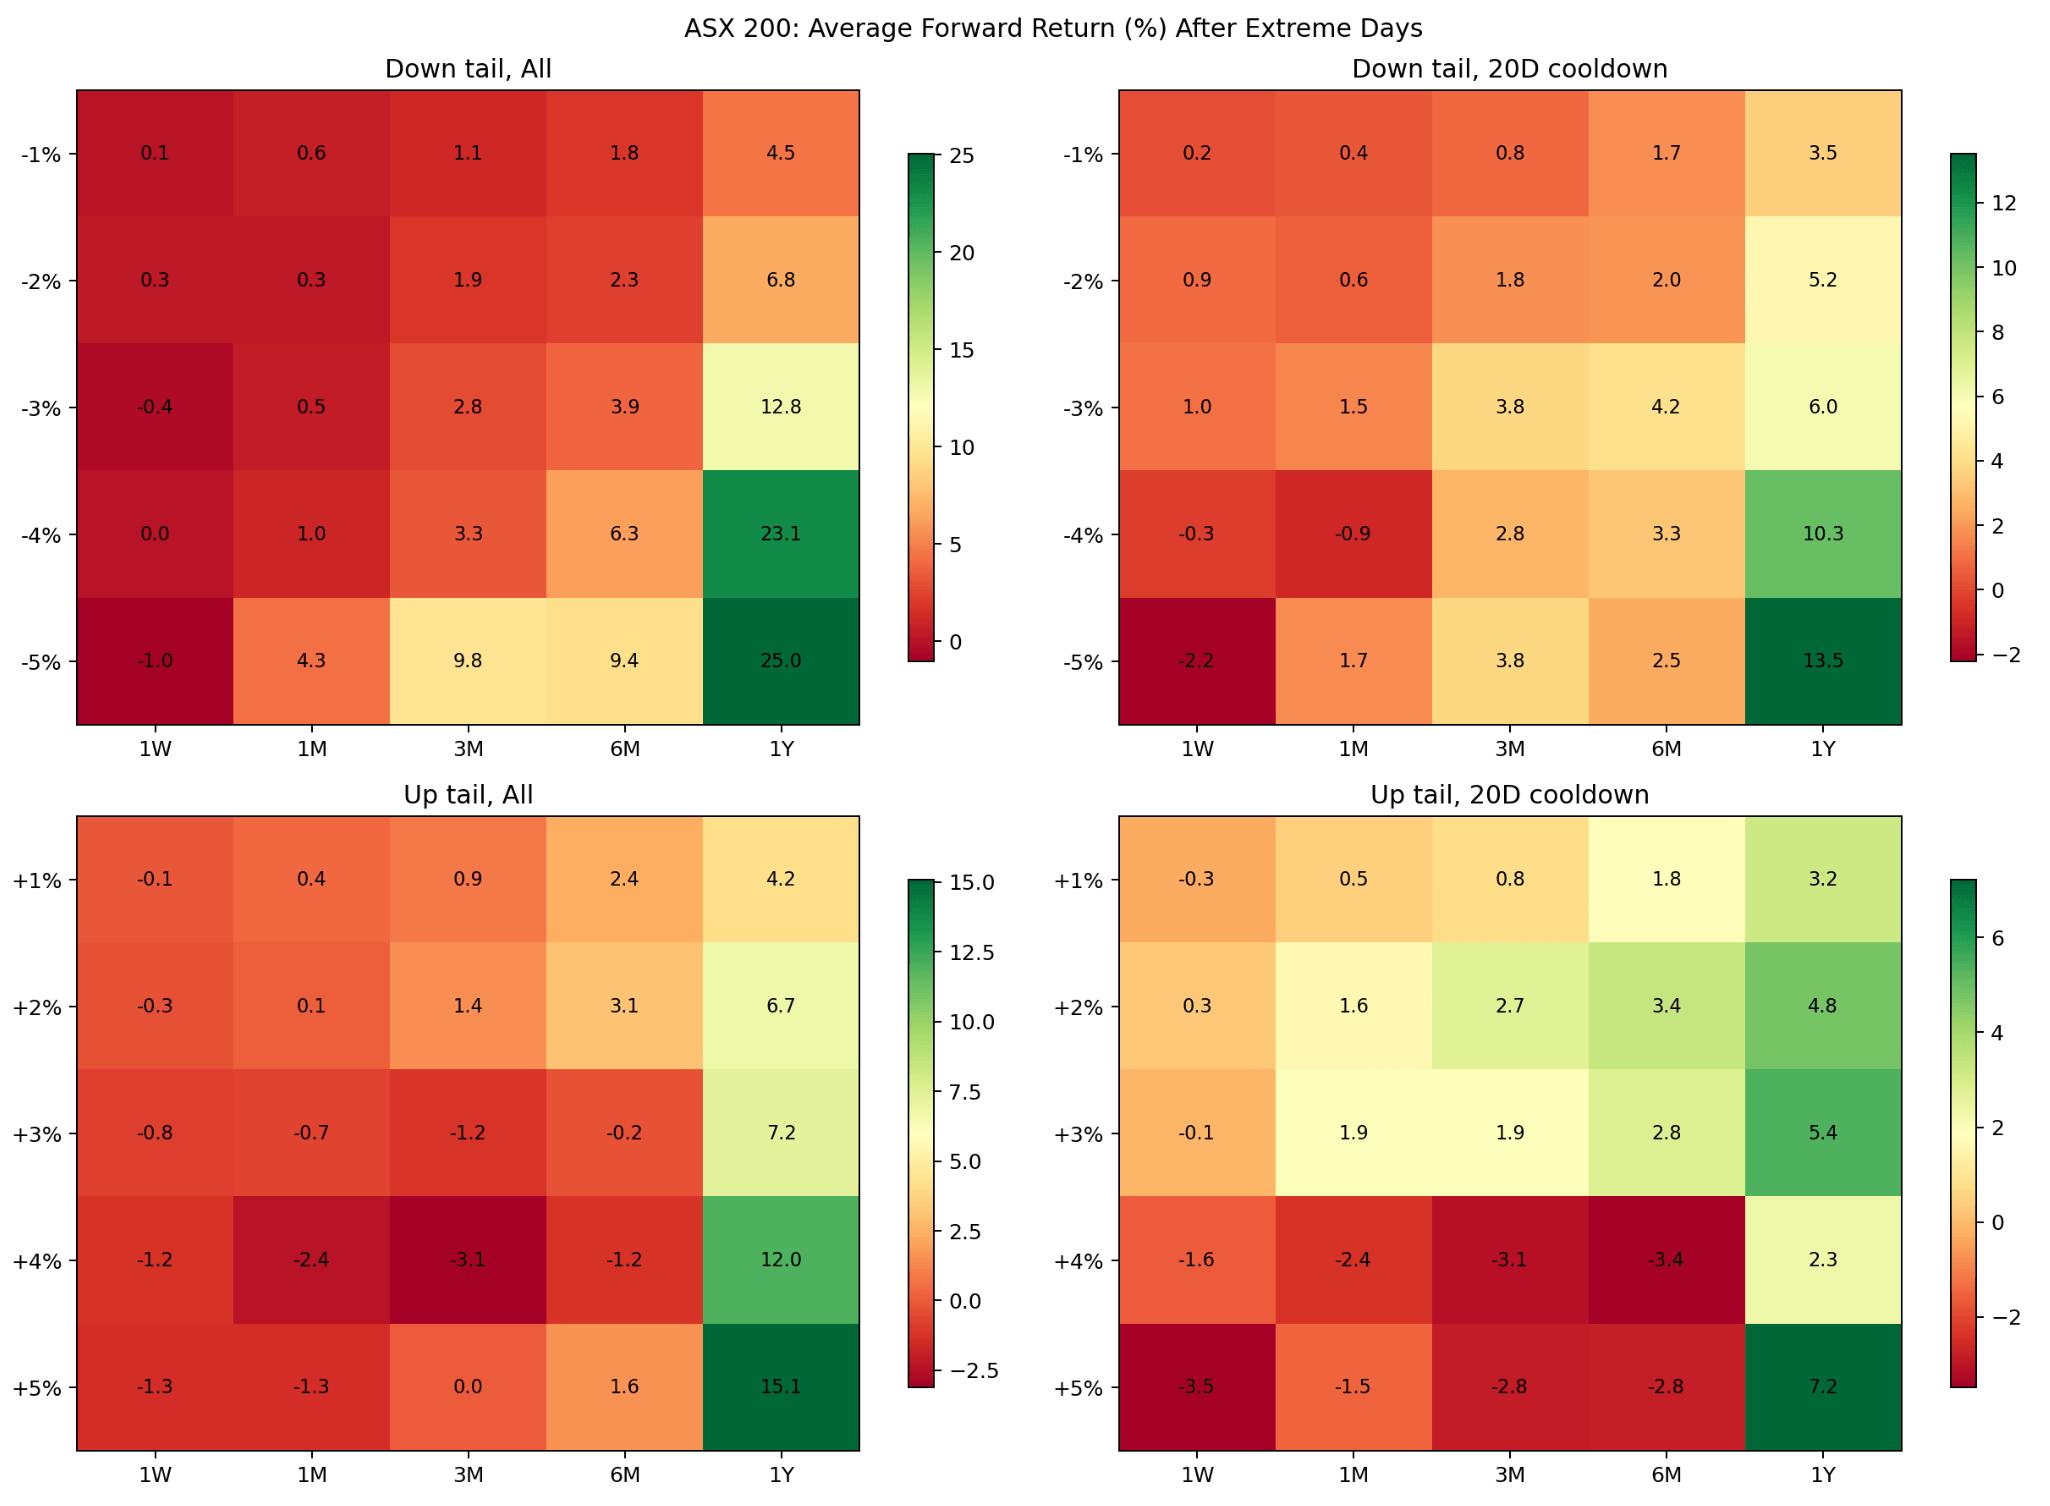
The heatmaps above provide some more quantitative insight into what happened during our study period after a ‘big day.’
The rows are the size of the starting move. From a 1% fall all the way to a 5% fall (the top left chart), and from a 1% rise to a 5% rise (the bottom left chart). The columns are the time horizons: one week, one month, three months, six months, and one year out.
The pattern that jumps out immediately in the top half (down days) is that nearly everything turns green as you move right across the chart timeline, meaning the further out you look after a big fall, the more likely the market was to have recovered. The deepest greens sit in the bottom-right corner: the biggest falls, measured one year later. The bottom half (big up days) is more mixed. Large up days often produced weaker short-term follow-through — some red in the near-term columns — but still tended to be followed by positive returns over a full year.
The 20D Cooldown panels (right-hand charts) are simply the same analysis, but with a filter applied. After one extreme day is counted, the study waits 20 trading days before counting another. This prevents a single crisis period from flooding the results. The numbers are slightly more modest, but the direction of the story doesn’t change.
One important caveat. The more extreme the move, the fewer examples there are in the sample, so we don’t draw too many conclusions. These numbers are directionally useful in describing the general tendency, not more. In this case, and to put a twist on an old saying, history often rhymes, but it doesn’t always repeat.
The market’s worst single days often feel like the moments when investors most want to run, but history on balance shows doing the opposite is the wiser move in hindsight. The data suggests those occasions were frequently the times when staying put, or even leaning in, was rewarded over the months/years that followed.

BHP (ASX, US, UK: BHP)
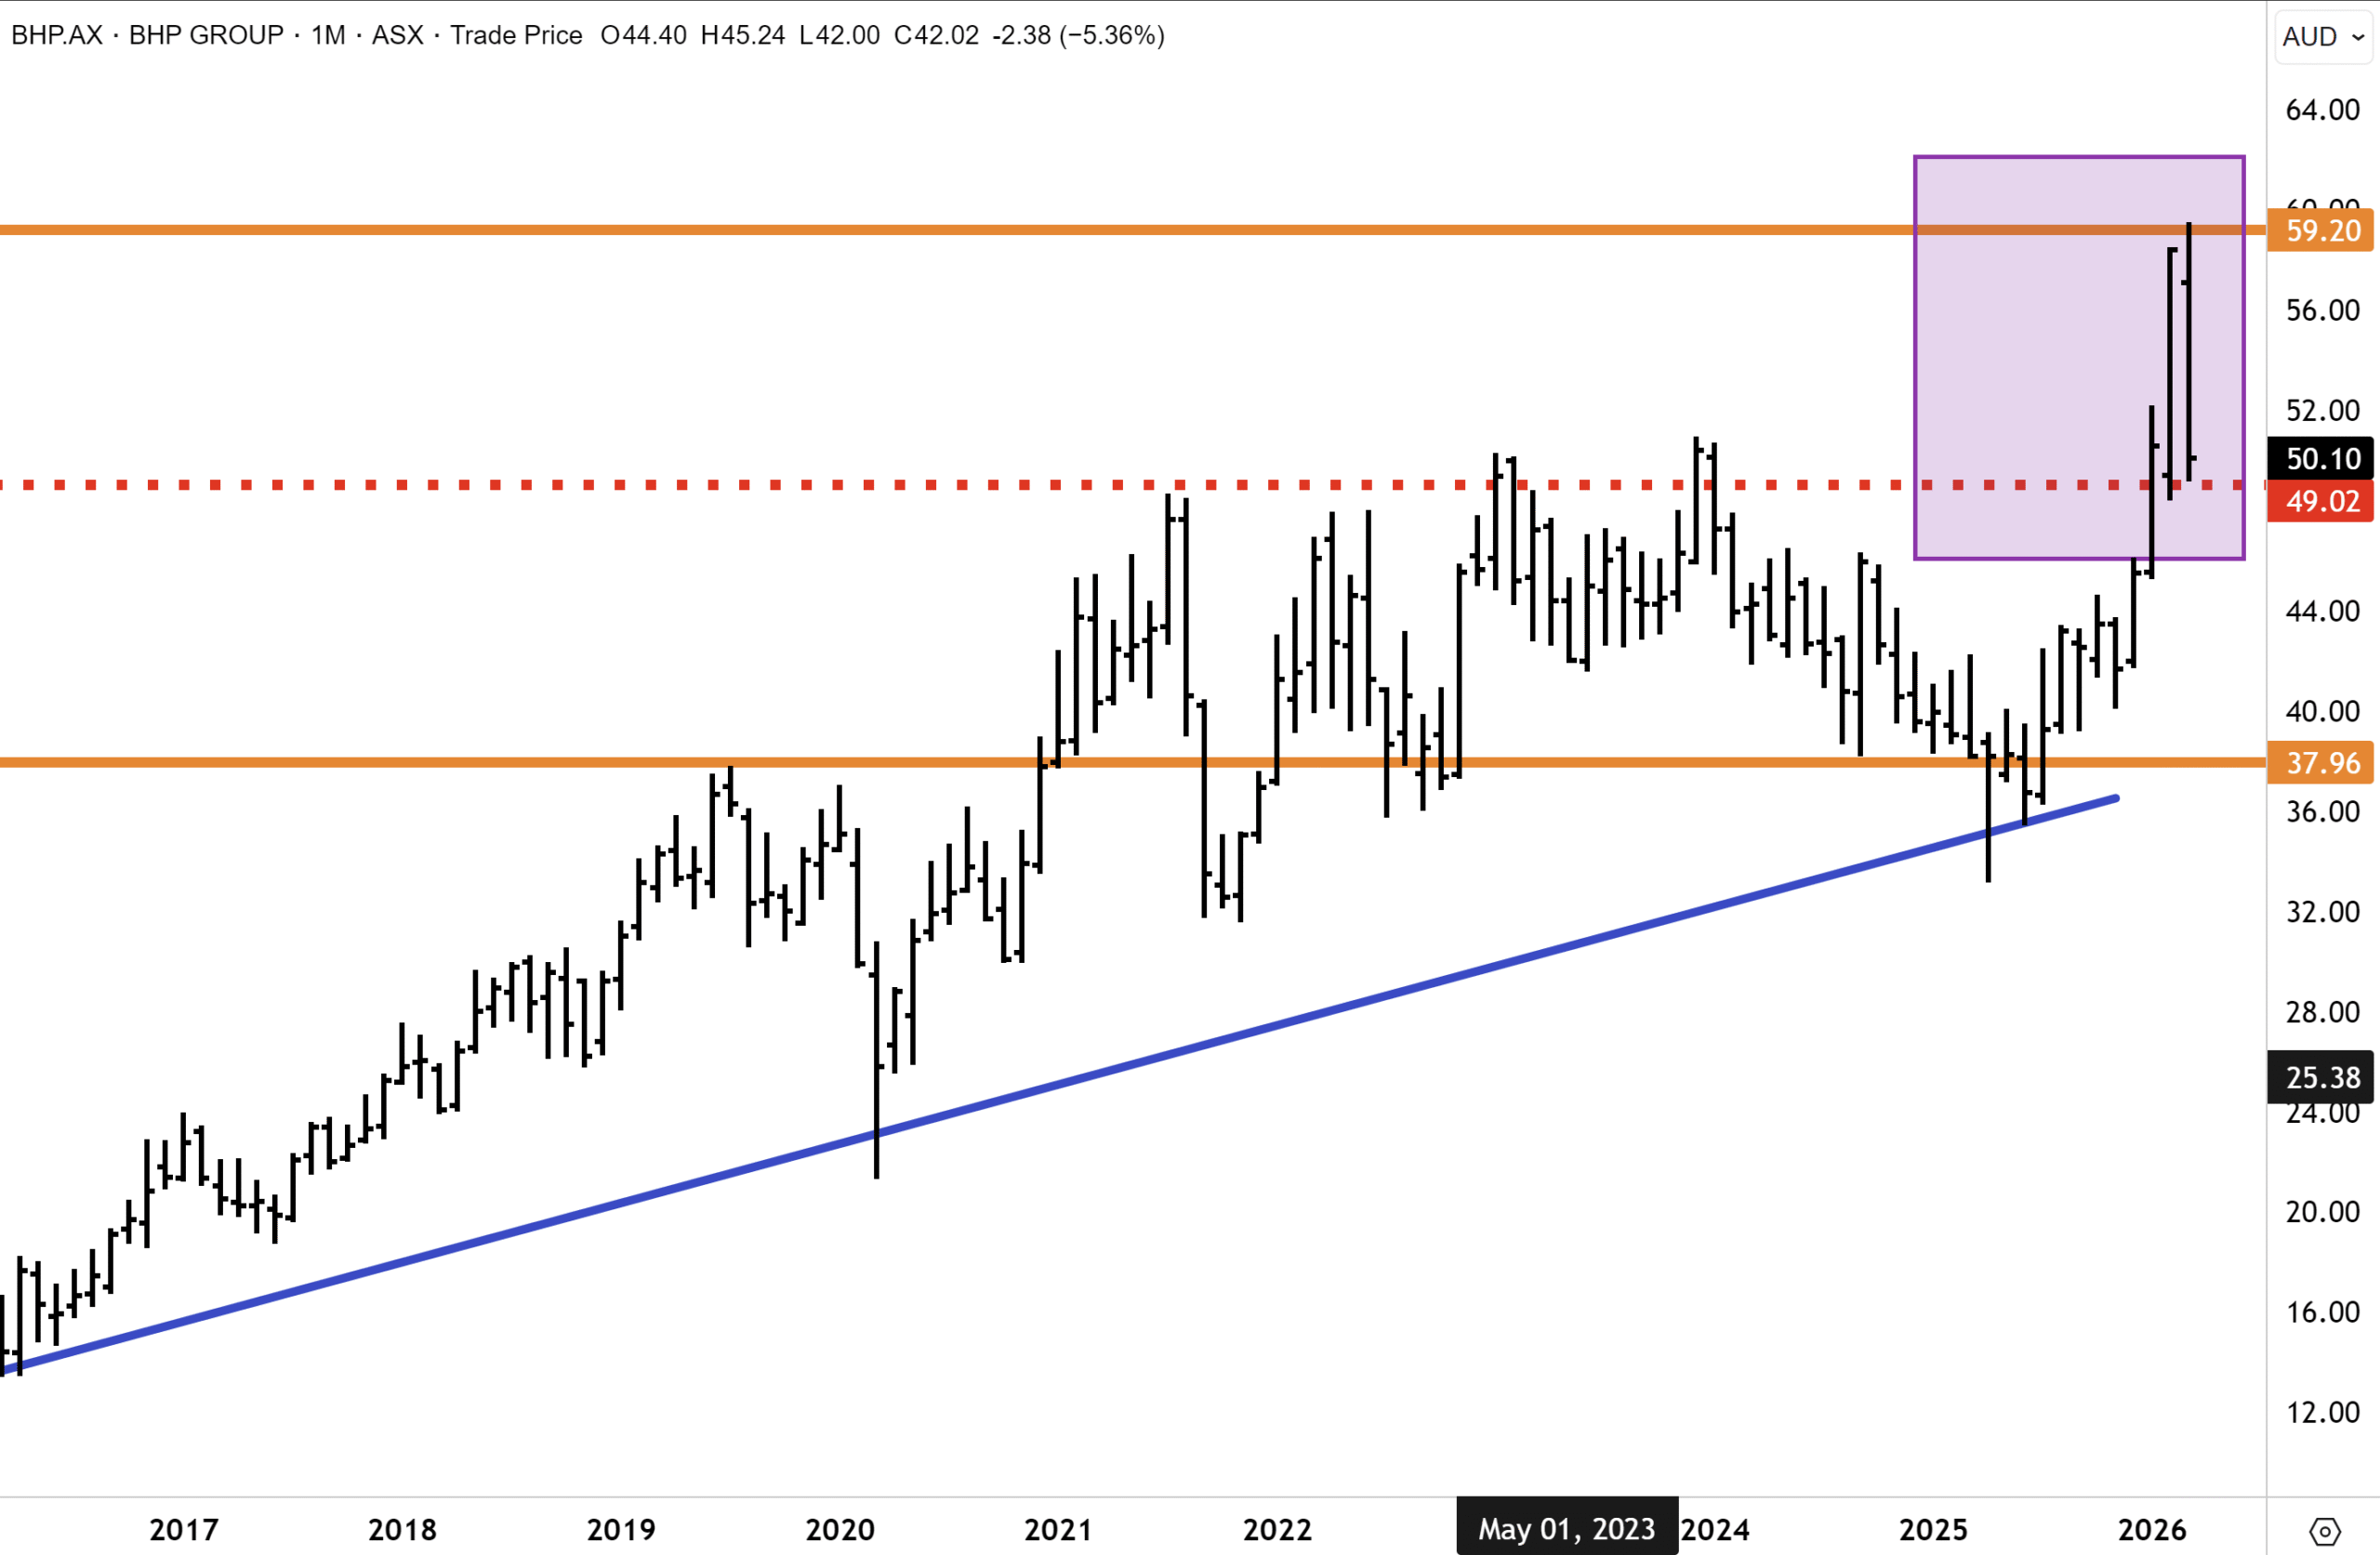
BHP has corrected sharply from its early March record high near $60. We view it as a textbook pullback to breakout support, and the risk-reward from current levels favours buyers. The sell-off reflects a convergence of mechanical, tactical and macro factors, none of which alters the fundamental case.
The most straightforward is the ex-dividend adjustment. BHP’s interim dividend of US$0.73 per share, up 44% on the prior period, fully franked, mechanically accounts for a material portion of the decline, but is a return to shareholders. The CMRG stand-off, where China’s centralised iron ore procurement vehicle has widened purchasing restrictions on BHP cargoes, is a negotiating tactic we have seen before. With WAIO all-in costs of US$19.41/t and iron ore back above US$100/t, this business remains a powerful cash flow engine regardless.
The bigger story is copper. For the first time in BHP’s history, copper delivered more than half of group EBITDA in the first half (US$8.0bn, up 59%) as realised prices surged 32% to US$5.28/lb and Escondida unit costs fell to US$1.12/lb. Production is up ~30% over four years, with 3–4% CAGR CuEq growth targeted to FY35. We are very bullish about copper over the medium term due to the growing structural deficit looming. The dip is the opportunity. BHP remains a BUY.
After breaking out above historical resistance, BHP surged to a record high near $60. The stock has since corrected back to the breakout level. I believe that a buying opportunity has opened with the c20% correction from the new record highs. Copper prices remain buoyant while iron ore is back above $100/ton. There is a good chance the lows are now in for BHP.
In volatile markets, timely context matters. Members can access our full library of market notes, stock deep dives, sector thoughts and regular research across Australasia, mining and global equities here.
Have a great weekend.
Carpe Diem
Angus
Sign up to receive full reports for
the best stocks in 2026!
Where to Invest in 2026?
The market is full of opportunities—but which stocks will deliver real wealth-building potential?
At Fat Prophets, our expert analysts uncover the best Australian and global stocks to help you stay ahead of the curve. Whether you’re looking for growth, income, or diversification, our carefully curated portfolio gives you access to high-conviction stock recommendations backed by deep research and proven insights.
Subscribe now to get full reports of these stocks and get ready for the next big opportunities!
Over 25,000 customers worldwide
Need a try? You’re first-time customer?
Enjoy our Welcome Gift with $500 OFF your Membership
Use code: FPWELCOME
FAQ’s
How much does a Membership cost?
We have a number of Membership options for the DIY investor. Our research services cover individual stock opportunities in Australia, as well as the UK, global markets, and a sector-specific report focussing on the mining space. Annual Membership prices start at $1395.
Do you offer execution services?
No we do not, and our research is independent in the sense that we are not conflicted by operating broking services alongside them. We also do not offer ‘sponsored research’ and are not financially incentivised by any of the companies that we recommend to Members.
Can I access any special offers?
Our introductory joining offers relate only to new Members. We do however offer ‘early bird’ discounts to existing Members who renew in advance of their Membership expiring.
Can I get tailored financial advice?
Our research products are ‘general advice’ in nature only, however we do categorise all our recommendations by the level of risk appetite which we believe is involved. Members looking for more direct advice can also make an inquiry to our wealth management team which offers a separately managed accounts service.
Do you offer a Money-Back guarantee?
Yes we do. Fat Prophets offers a 100% money back guarantee on annual subscriptions within 30 days of taking out a Membership.