
- The ceasefire exhale, the short squeeze mechanism, and why the earnings test is the next catalyst.
- Why the bond market never believed the stagflation story, and what the squeeze tells us about where fundamentals were pointing all along
- ASX in Focus: Wednesday’s biggest single-day gain in a year; Thursday’s tech rout is a dislocation; banks and resources leading the recovery
- Global Markets: A broad-based recovery, which we think has further to run.
- Commodities: Oil’s correction; gold’s March flush confirmed complete; copper’s inventory signal points to a structural floor
- Market Insights: The US valuation-earnings collision; Citrini’s toll road intelligence; the short squeeze mechanism; rates, the dollar and Goldman’s oil shock playbook; gold and tech exhaustion; copper’s stockpiling thesis; Japanese and Australian banks; the “just in case” structural shift for commodities.
Week ahead
- US Q1 Earnings: Major banks report first.
- Strait of Hormuz: The two-week ceasefire clock is running
- US March CPI (tonight): Headline will be elevated on oil pass-through; the shelter component is what matters.
- Private credit stress
Report Spotlight
- ANZ (ASX: ANZ) – buy
Full reports across Australasia, Global Equities and Global Mining are available to members, along with our complete model portfolio positioning. If you’re not yet a member, you can join at Our Products page.

Good afternoon,
For six weeks, global markets held their breath – through an oil spike that hit $120 (futures), a surge in the VIX, hedge funds building the largest short book since the pandemic, and a bond market that, notably, largely refused to validate the stagflation narrative being sold on the front pages. The exhale arrived on Wednesday, following the Tuesday night (US time) announcement of the US-Iran ceasefire, and what followed was a structural short squeeze of the kind markets have not seen since March 2020. Goldman’s prime desk measured short covering running at a pandemic-rebound pace as hedge fund short exposure of 12% of gross became an urgent problem to unwind. The S&P 500 ran from 6,611 on Monday to almost 6,825 by Thursday’s close. The ASX200 rallied almost 2.6% on Wednesday alone, with impressive breadth led by gold miners, tech, real estate, discretionary and the banks. The Nikkei surged 5.4% that day, while European indices posted their strongest day in four years, and WTI crude fell 15% – the largest single-day oil decline in six years.
What follows now is the harder test, the ceasefire’s durability (which is being tested early), and whether the US earnings season loading next week delivers what the bond market has been pricing through six weeks of war: a US economy that was never as broken as the headlines suggested, colliding with a valuation that has compressed materially.
The Valuation-Earnings Collision I noted early in the week (before Tuesday’s White House announcement) that US strategist Ed Yardeni wrote last week that with the “S&P 500 down 9.1% from its January 27 high, we believe this marks the trough of the latest pullback, for now. The next two days could make or break our call…Our call of a market bottom doesn’t come with a money-back guarantee, of course. However, history offers some reassurance: The S&P 500 has been higher two years after the past four major US military engagements, with gains of 31% to 44% following the Korean War, the Iraq War, the Gulf War, and World War II.”
I agreed with Ed on a call for a market bottom, provided the ME didn’t spiral further. Whilst it is impossible to trade and react around the continuously shifting headlines (we have sat tight), technically, US market internals were pointing to a coming rebound in our view, which now looks to be in the early innings.
On Monday, the PE contracted to below 19X, which represents a drop of nearly 18%, meanwhile, Wall Street analysts have in recent quarters increased earnings forecasts by over 12%. Analysts typically pull earnings forecasts down just ahead of earnings season (which enables most companies to beat estimates), but this has not occurred in a break from the usual pattern. The bottom line is that earnings forecasts have been remarkably steady, which is a bullish outcome and why I believe the technical setup for the S&P500 is pointing to a rally ensuing soon.
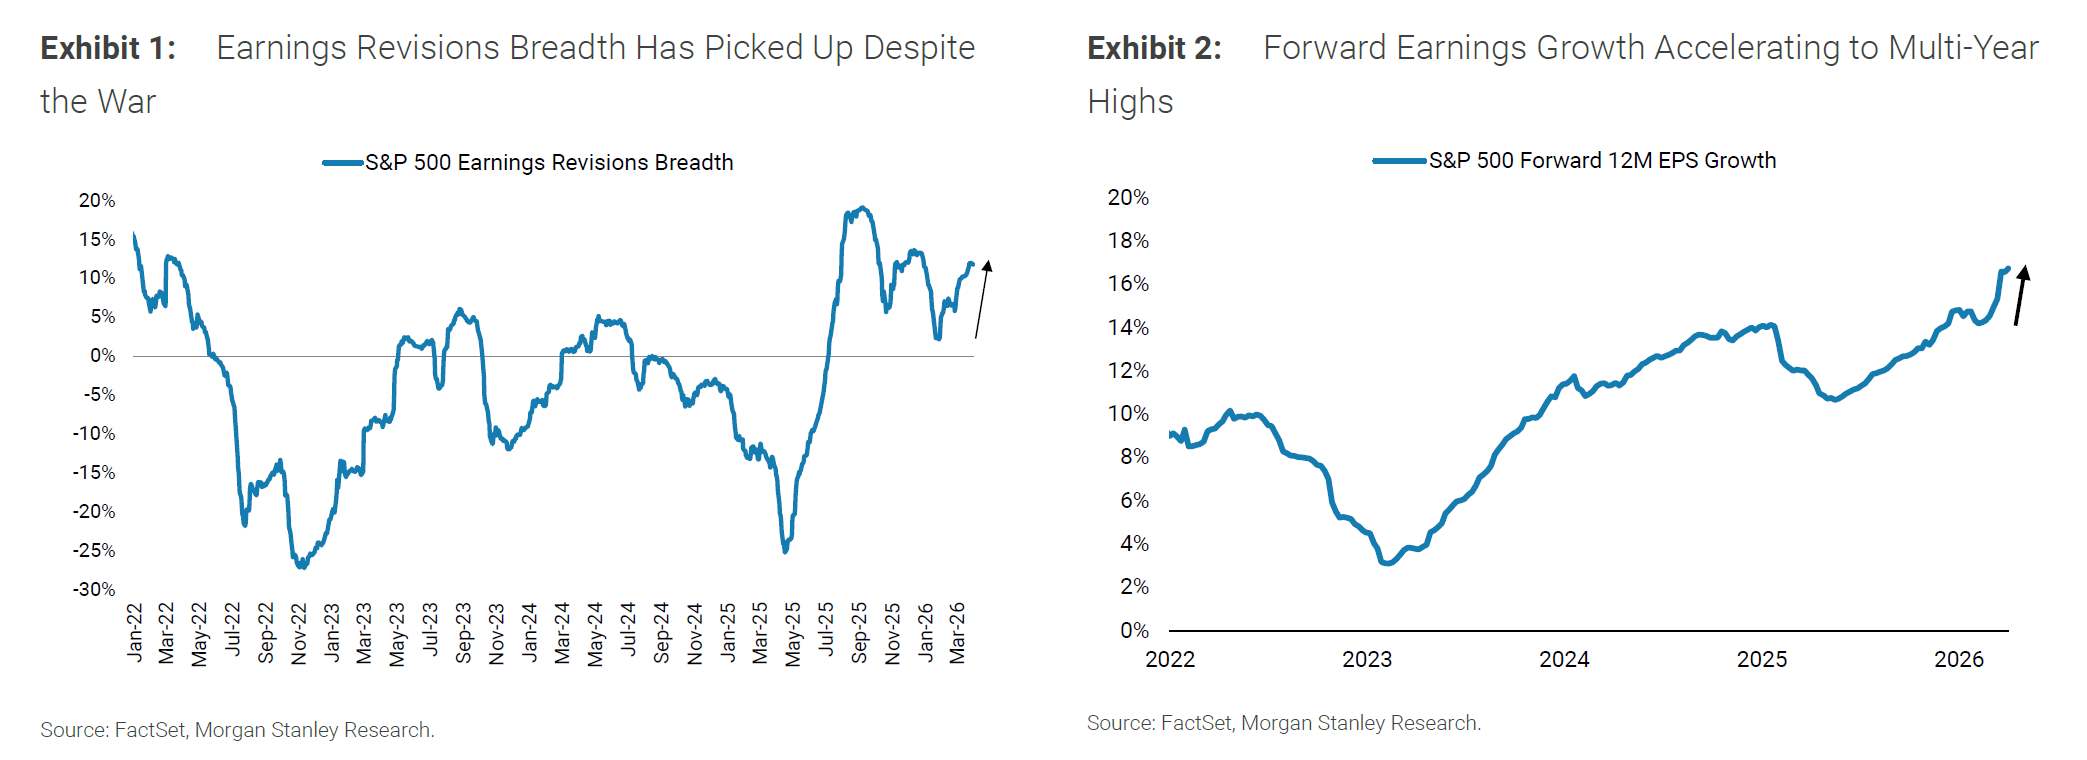
Source: Morgan Stanley

We have long stated that the war’s end was never really a question of military outcome, with Iran hugely overpowered, instead saying it was also a question of political timing, and by this week, those timers expired. The White House urgently needs lower gas prices at home ahead of the November mid-term elections, and to get out of a war that is hugely unpopular at home. What remains of the Iranian regime wants above all survival, and the prospect of broad-based economic sanctions – in place since the 1980s – being lifted represents an enormous incentive for the regime.
A promising development was China entering the ceasefire push and formally aligning with the US objective of restoring oil supply. Not often do the world’s two largest economies bat on the same side. That alignment materially reduces the probability of the ceasefire breaking down.
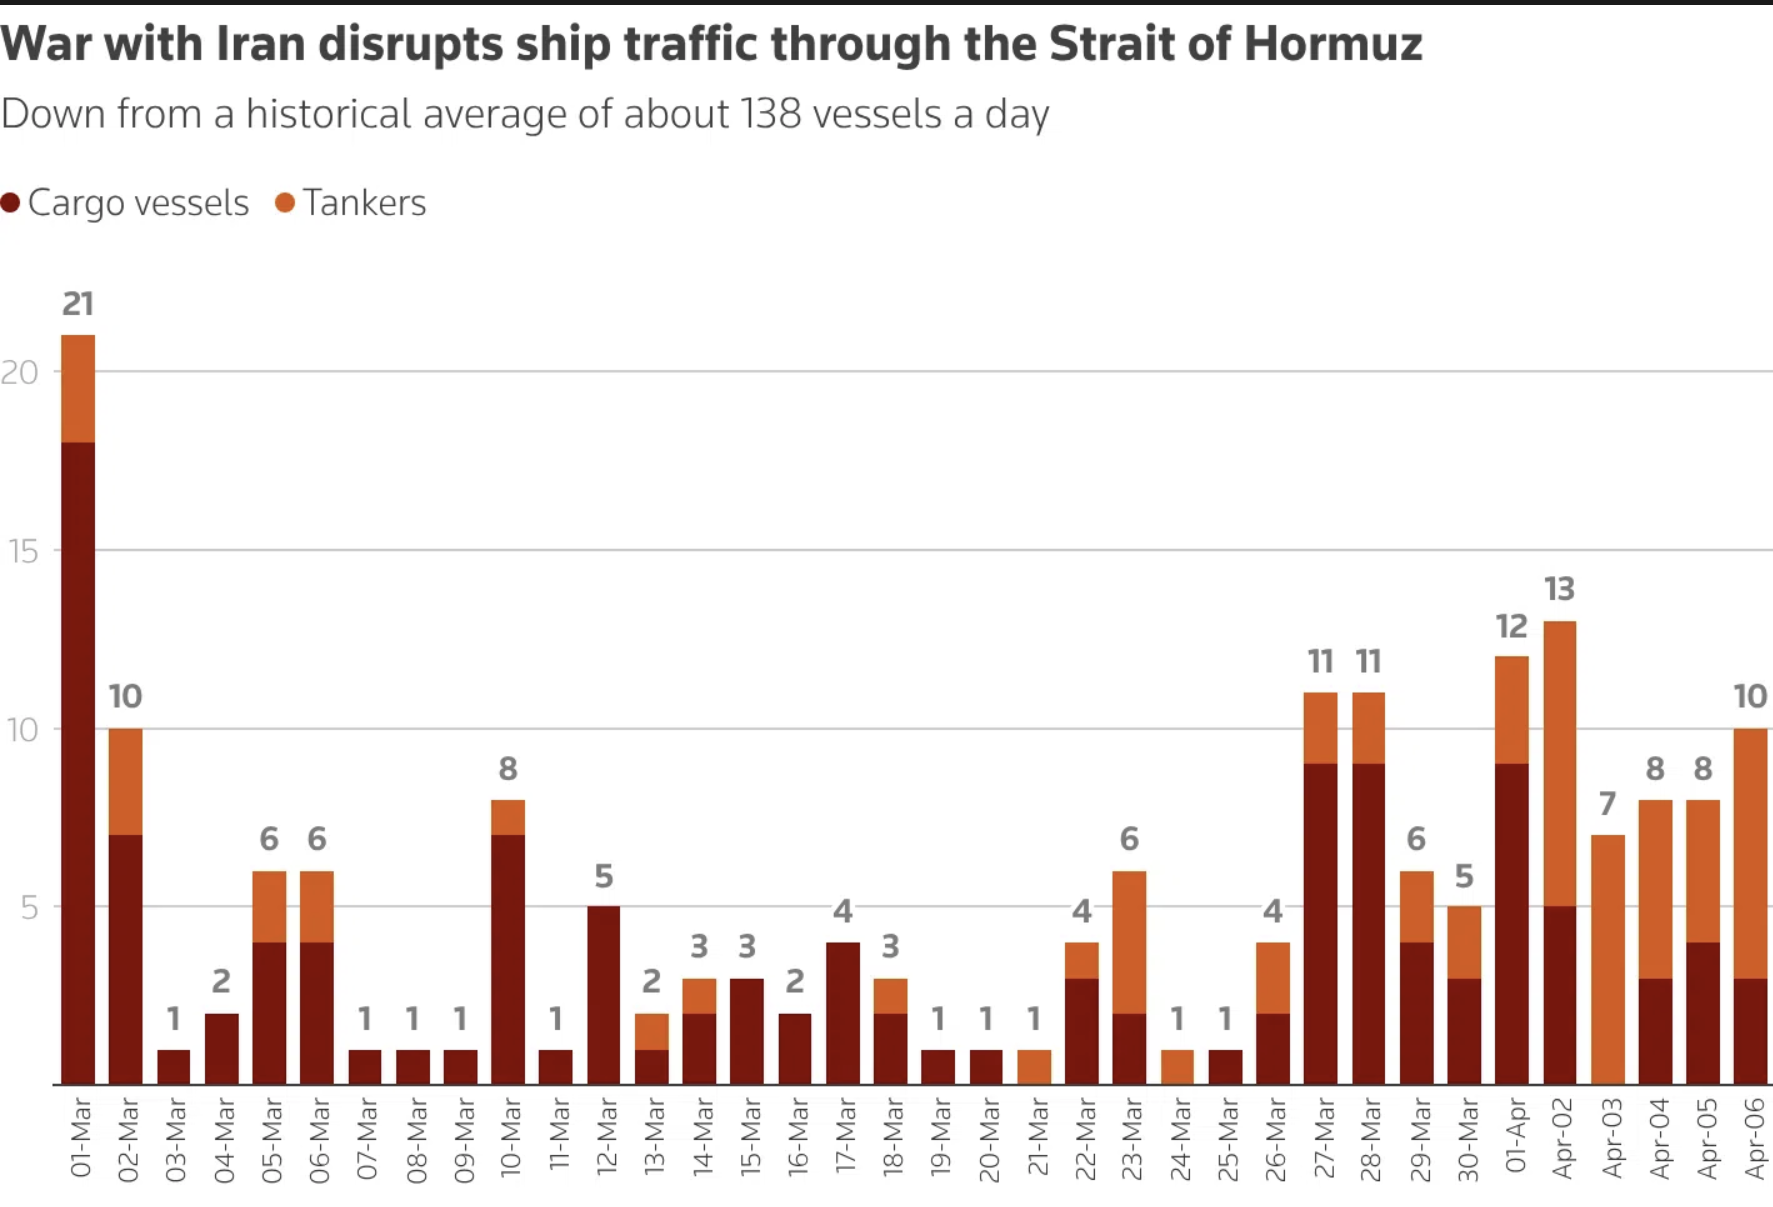
One of the week’s most interesting pieces of market intelligence came not from a Wall Street bank but from an independent research firm that sent an analyst into the field. Citrini Research deployed a researcher to Oman and the Gulf of Hormuz, where he observed significantly more vessels transiting the Strait than tracking platforms were showing, because many ships had switched off their transponders. The Citrini report concluded the situation was closer to a “toll road” than a blockade, with Iran demanding that every vessel secure its approval to pass through safely.
The passage of tankers through the Strait of Hormuz has continued to climb since late March. The tanker traffic numbers are plausibly underestimated, as highlighted in one of our FatChats earlier this week. Watch the oil price, which is the true gauge of what is really going on in the Strait of Hormuz, and don’t take mainstream media reports as gospel.
Oil in Historical Context – not the 1970s.
Morgan Stanley noted that the real oil price during this shock has been lower than during prior energy crises. This helped well-regarded Morgan Stanley CIO Mike Wilson stay relatively upbeat. In a note early in the week, Mike cited that “we believe the S&P 500 is carving out a low and think it makes sense to start adding length in cyclical and quality growth trades where earnings remain strong, valuation has compressed, and sentiment is negative. Financials, Discretionary Goods, and the hyperscalers [Mag 7 names] top our list of targets.” I agree. We therefore need to be buyers amidst the uncertainty.
The world economy uses far less oil per unit of output today than it did in the 1970s. Global oil intensity (oil per unit of real GDP) has fallen by roughly 60–70% since that era. Today’s economy is thus structurally far less oil‑dependent on a per‑output basis. In the US, the economy is also less vulnerable to oil shocks (which will keep the Fed on hold for now) due to the country no longer being an importer, but a net exporter. The US is the largest energy producer in the world, accounting for around 20m barrels a day of oil and LNG equivalent.

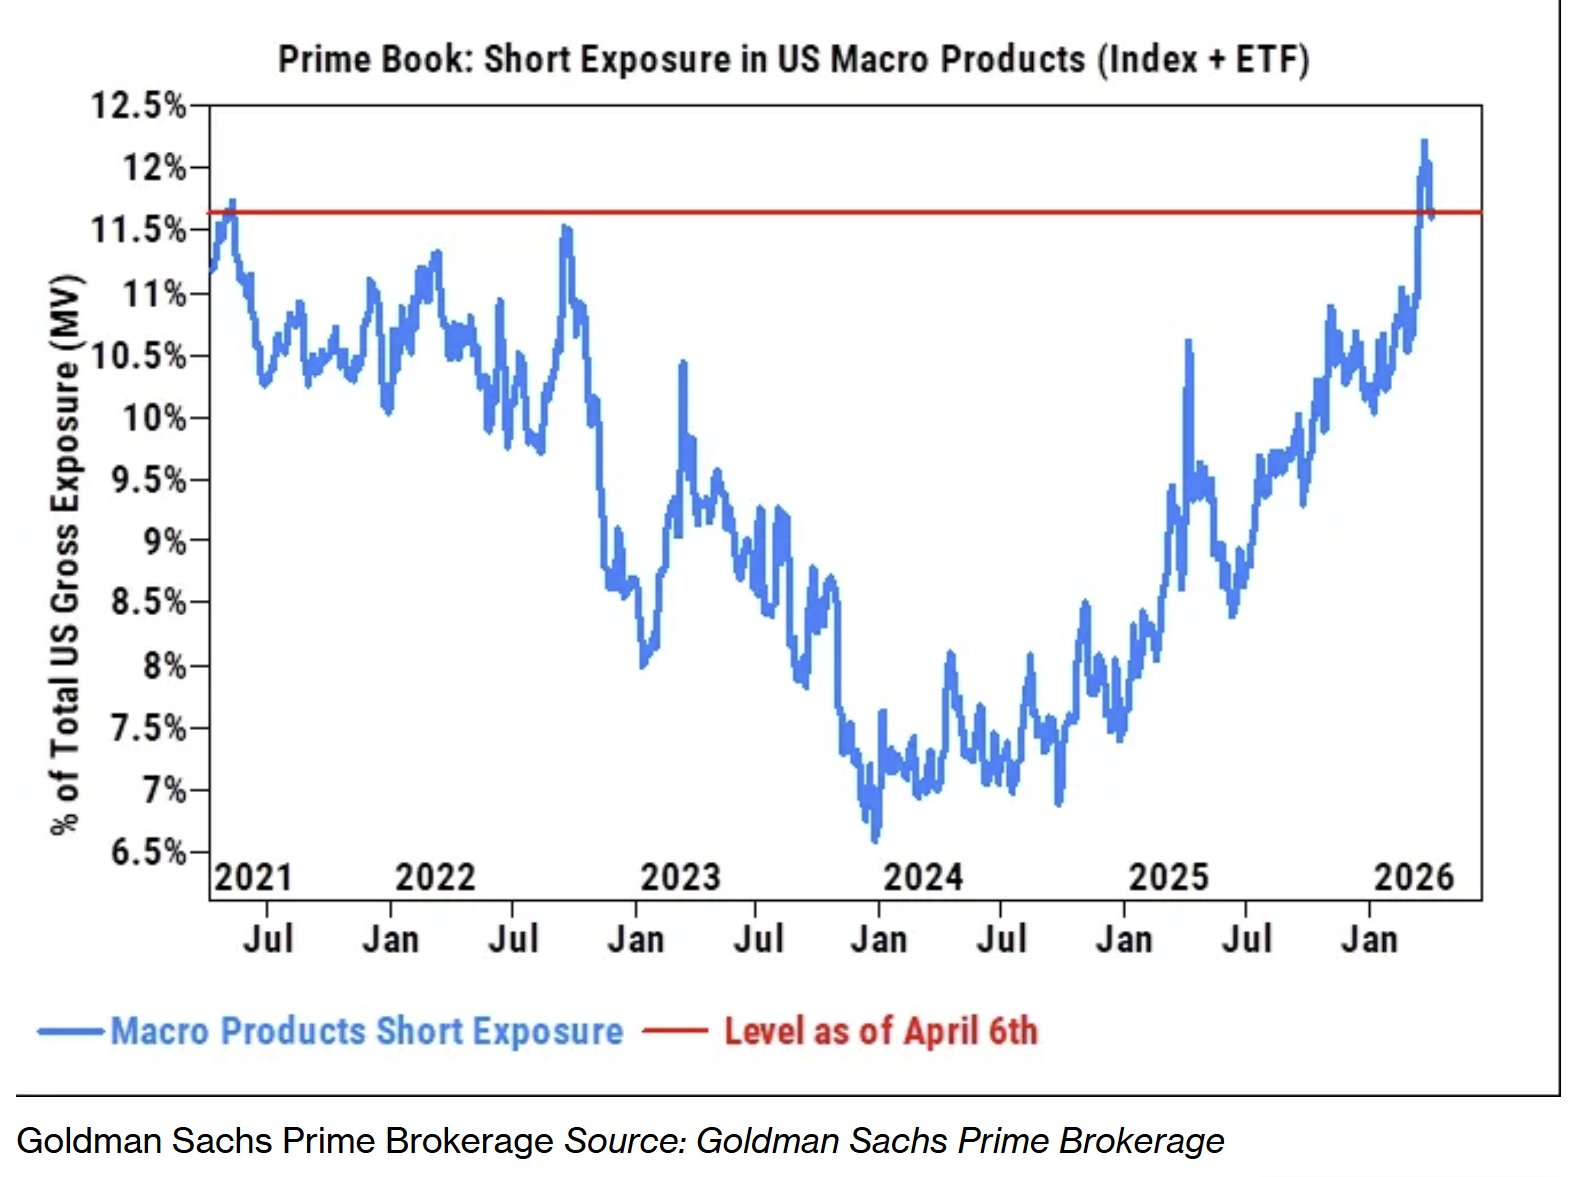
Understanding Wednesday’s rally requires understanding the positioning that made it possible. Goldman’s prime brokerage desk tracked hedge fund short exposure in US macro products, climbing to 12% of total gross exposure – the highest level since the pandemic, as funds bet the war would persist, oil would stay elevated, and the correction would deepen. Many investors had moved to cash and the sidelines, expecting a global recession, an inflation breakout, and no quick resolution. When the ceasefire hit, those positions became expensive problems. The pace of short covering that began late Tuesday and accelerated through Wednesday is, by Goldman’s own measurement, on track to match the levels seen in early 2020 – the moment which preceded a V-shaped rebound that continued for the rest of that year.
Goldman’s trading desk named the transition precisely, saying: “The freeze phase is now behind us — we are currently in the squeeze phase”
Bears beware, for they have no shares! The closing out of these short positions could now trigger a dramatic U-turn where those who have sold borrowed securities and stocks in the hope of buying back lower to cover, could now face a short squeeze, especially if earnings deliver in upcoming weeks, which is our base case.
Goldman’s trading desk expects a near-term pullback in stocks that benefited from the war – including energy, commodity chemicals and defence – as hedge funds lock in profits. But heavily shorted consumer discretionary, materials, mining and airline stocks, homebuilders (including James Hardie), not to mention technology and Mag 7 names to list a few, could benefit the most from sustained covering.
This is the offramp I have been waiting for, and while the ME war has not definitively concluded, “the beginning of the end” to the conflict is likely now underway. Markets look ahead and price accordingly, and we are seeing that dynamic play out now.
Goldman Sachs also provided a useful framework for thinking about central bank policy from here. The bank’s historical analysis of supply-driven oil shocks shows a consistent pattern. Slightly higher policy rates in the first one to three months as central banks respond to the immediate inflation signal, followed by lower policy rates six to nine months out as growth concerns come to dominate.
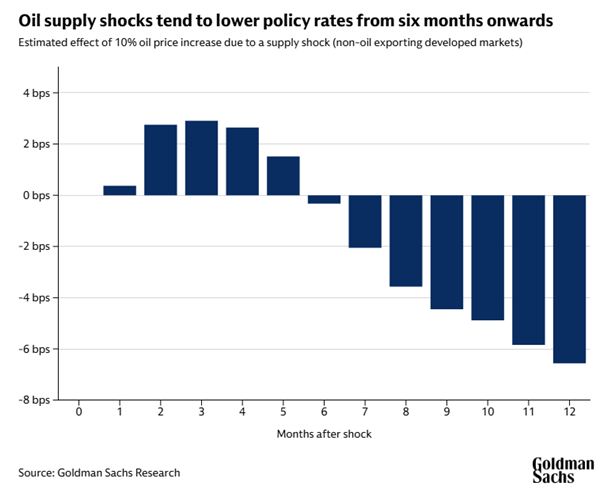
This is a good point, and I see the Fed actually cutting rates twice later this year. Incoming Fed Chair Kevin Warsh’s arrival is expected to intensify domestic political pressure on the Fed to ease ahead of the November mid-term elections. I don’t see the RBA tightening again. There is also a good chance the RBA join other central banks and pivots back towards an easing bias later in the year.
The US dollar ties several threads together. JPMorgan’s view – that the US dollar, having acted as a safe haven throughout the conflict, “is not cheap, and could resume depreciation thereafter” – is playing out in real time, with the DXY reversing sharply from the 100 resistance level. A sustained dollar decline would have wide-ranging positive consequences. It would support gold and commodities priced in dollars, improve earnings translation for US multinationals, and return risk appetite to emerging markets, including Japan. JPMorgan is structurally bearish on the dollar – a view that is now beginning to be validated by price action and one that I certainly concur with.
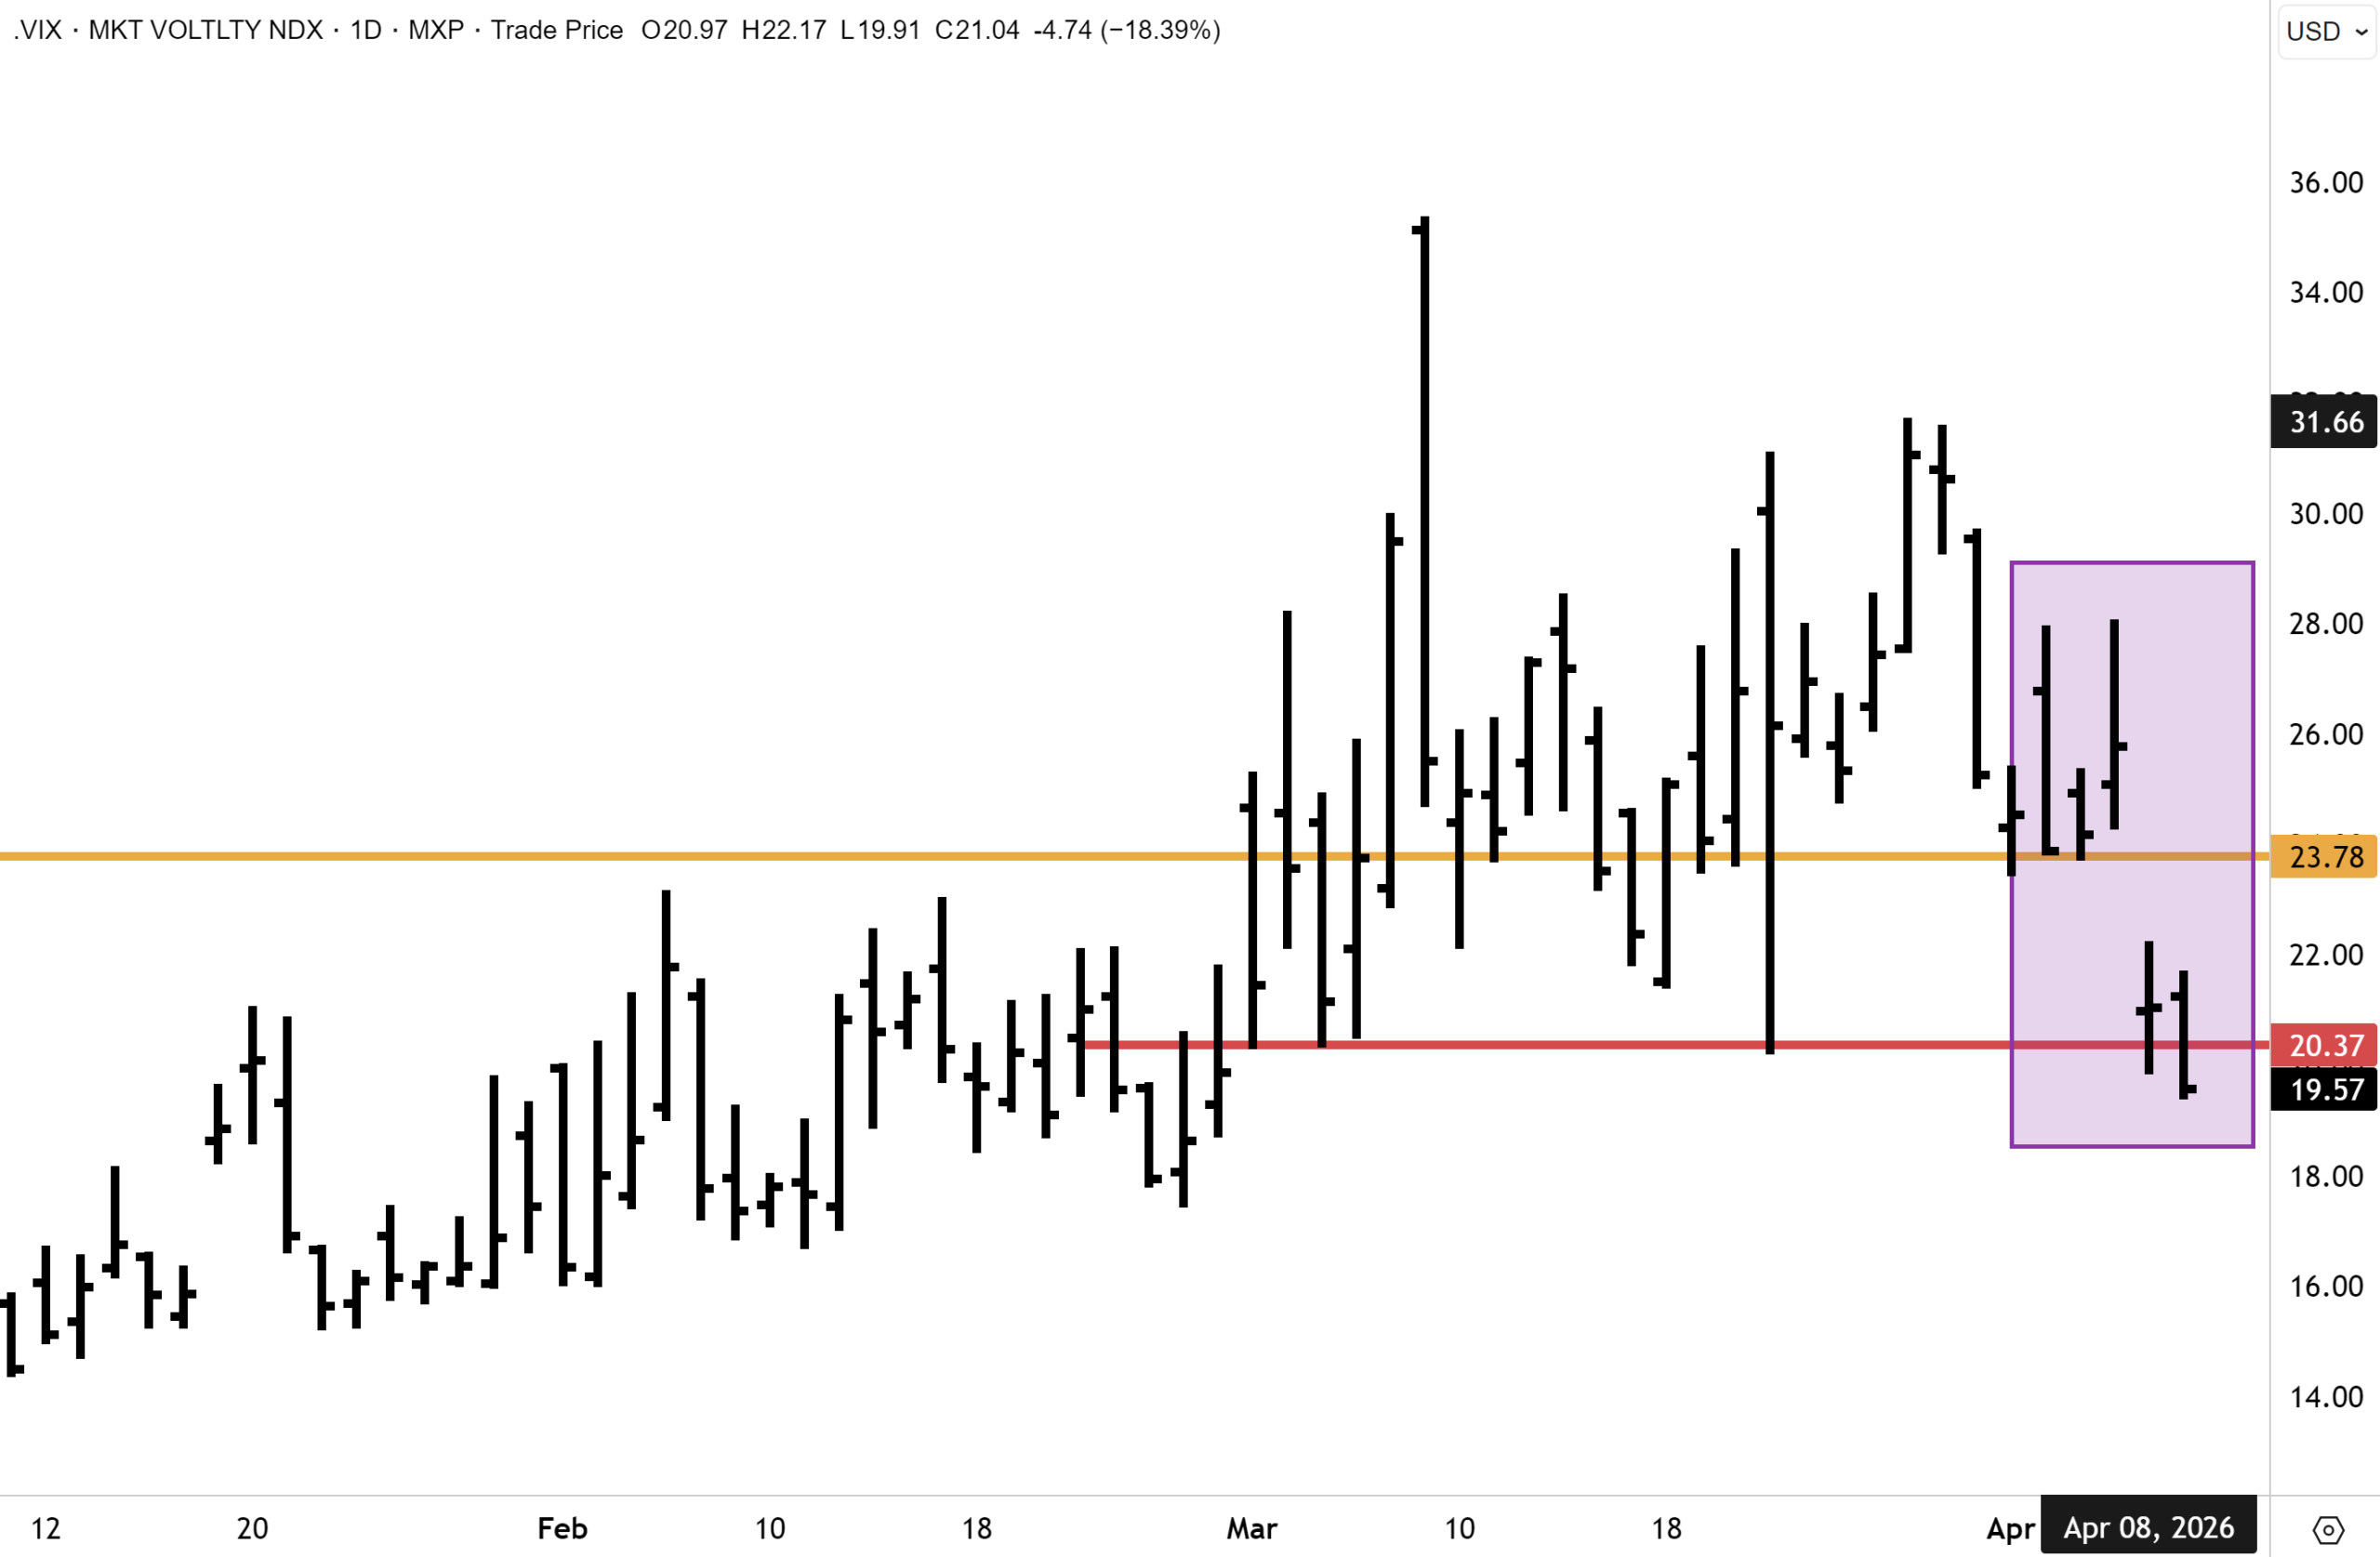
The VIX plunged another 7% to fall back below 20 on Thursday, the lowest level since early March. Risk appetite is returning for global equities and generally for other asset classes, as reflected in the falling VIX index.
March Flush Complete
The March correction in gold cleared the overbought conditions. That work is now done in our view. Gold and PGM miners, discarded by investors in March, are beginning to return to favour, and the trend should continue as the dollar resumes its downward trajectory and the safe-haven bid recedes. The aftermath of the ME war is expected to intensify buying activity by central banks and large sovereign wealth funds, which were already systematic gold buyers before the conflict and are likely to accelerate accumulation.
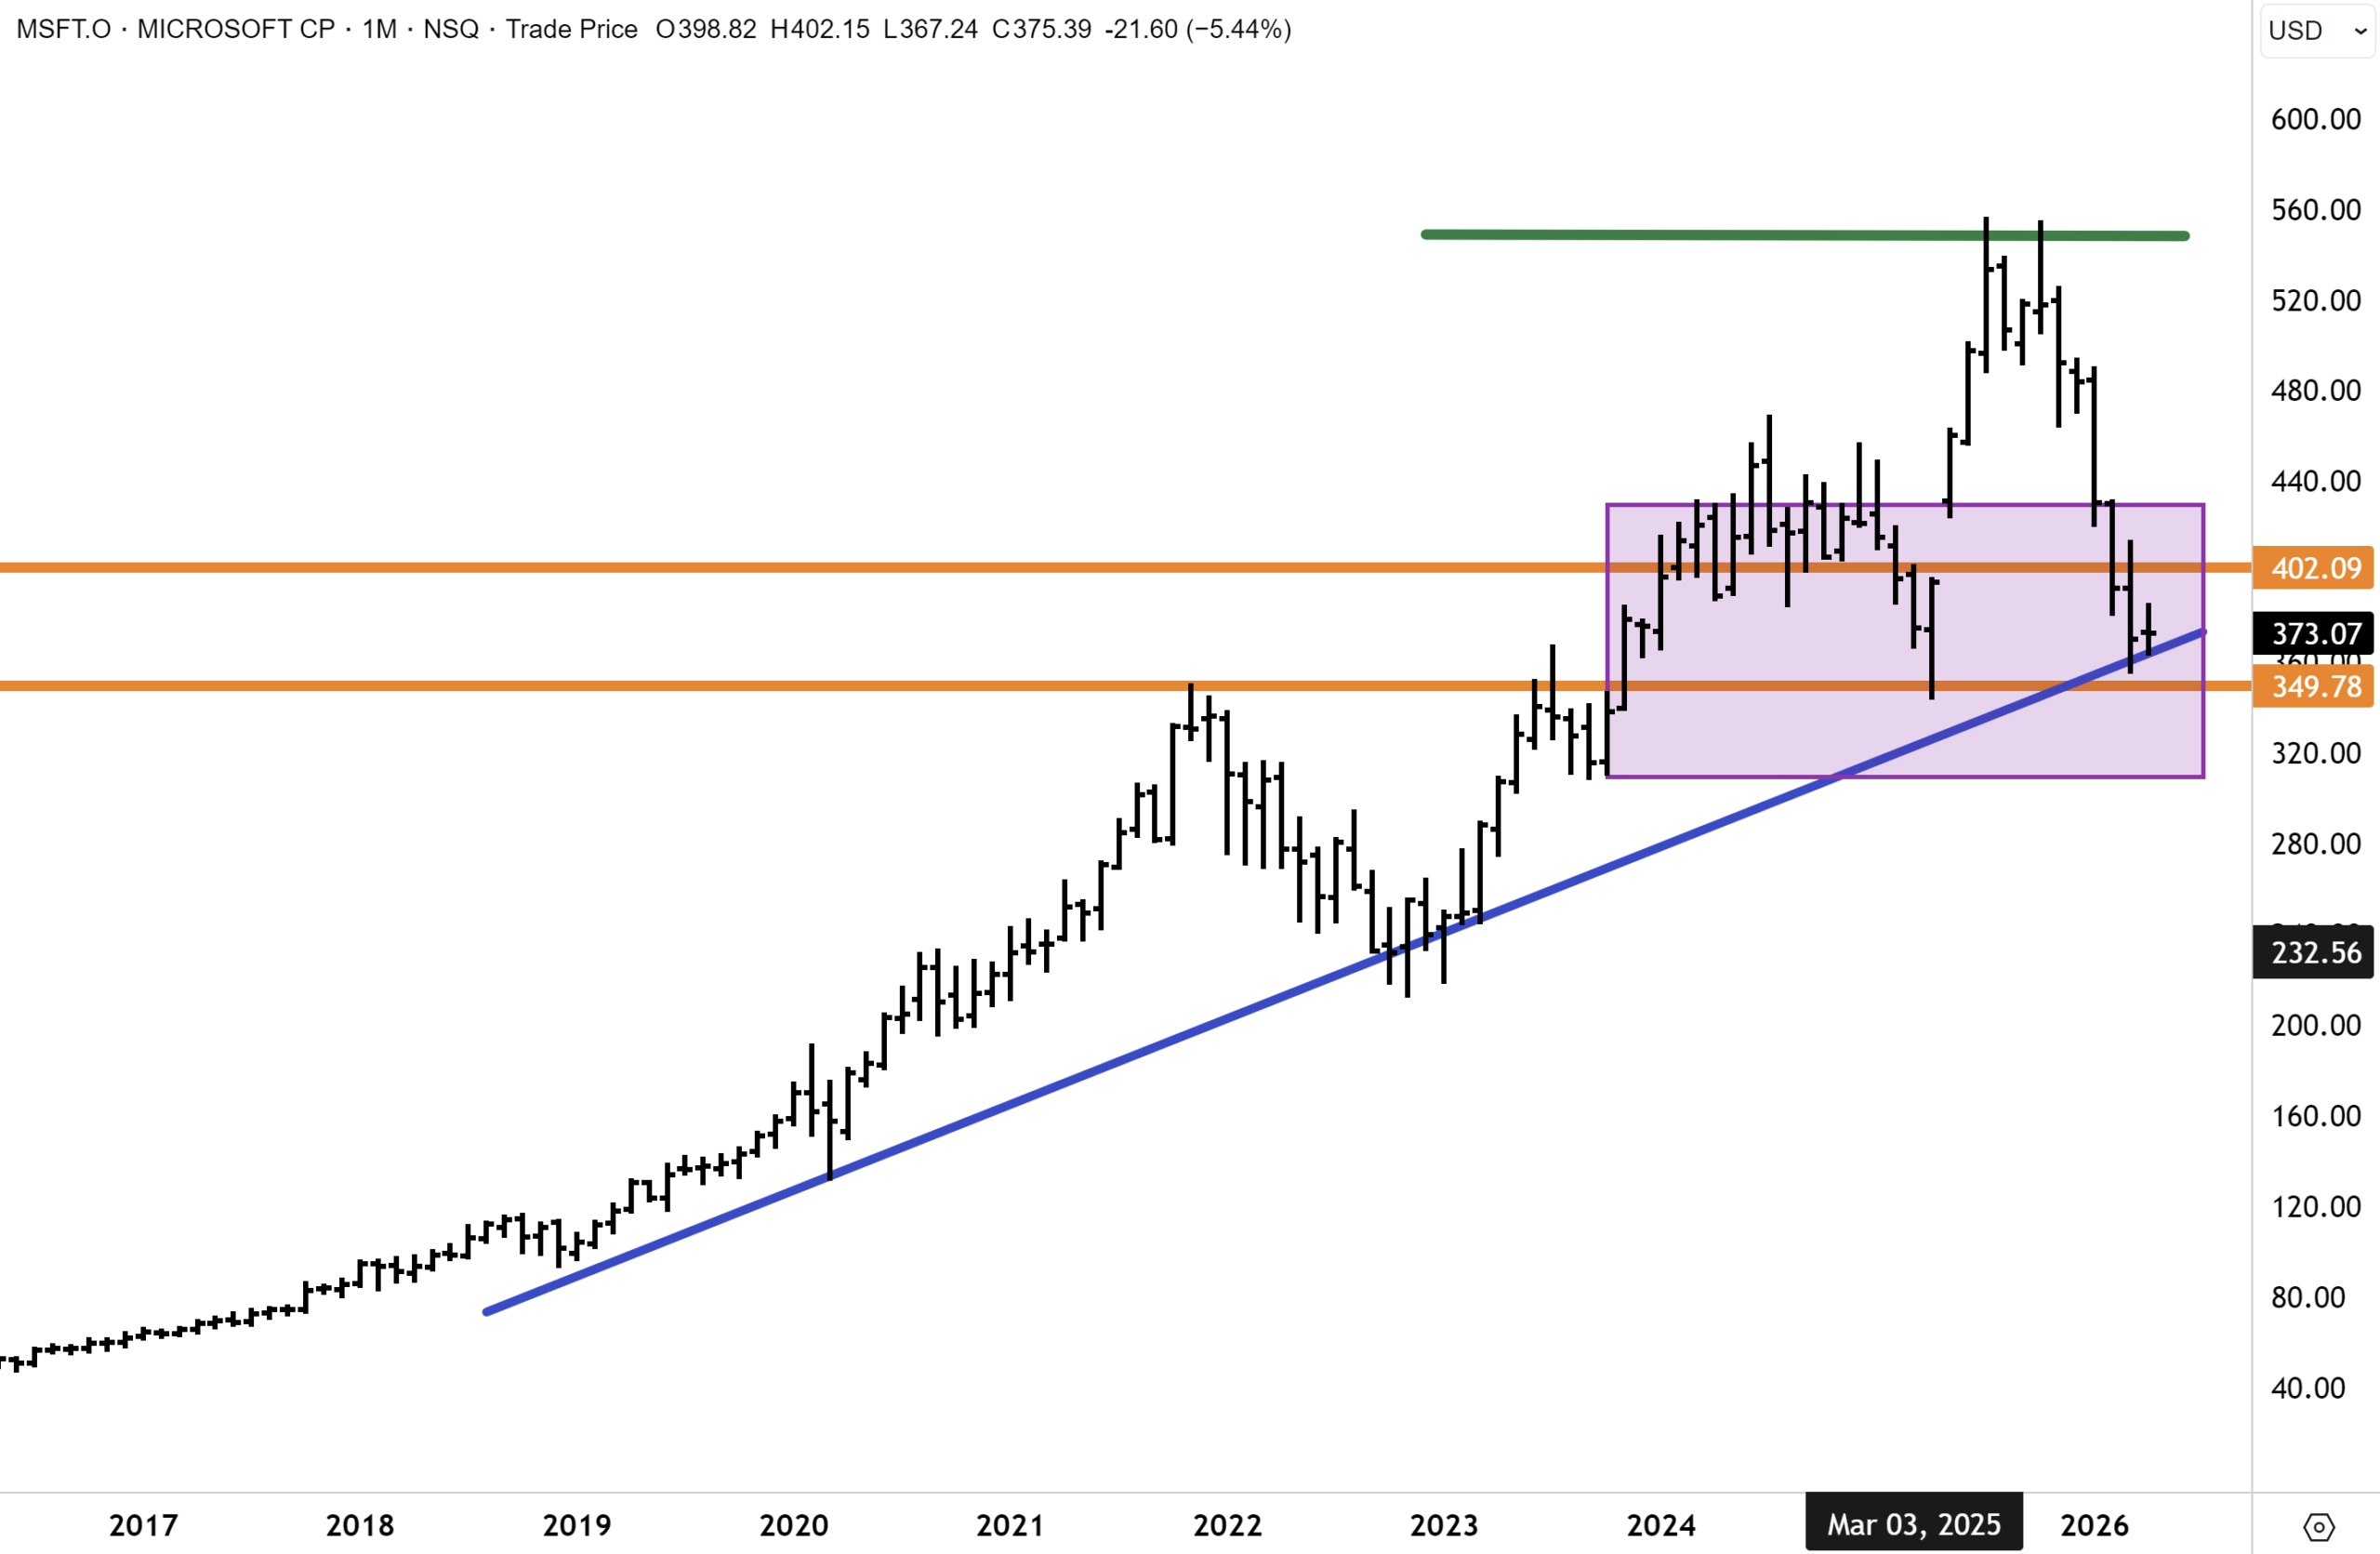
Tech is also interesting, with stocks across the sector selling off sharply this year, with blue-chip names such as Apple and Microsoft all down heavily. The downward trend in US and global technology stocks appears to be now showing signs of complete exhaustion. We are positioning accordingly.
This morning, the Fat Prophets Global Contrarian Fund released this to the Australian Stock Exchange: –
“The Fund has got off to a solid start in the first week of April, recovering around half of last month’s drawdown. We have conviction that our portfolio will rebound quickly as the conflict in the Middle East recedes, oil supply resumes & energy prices fall, and as the US reporting season gets underway. We have conviction that investors are underestimating the strength and resilience of the US corporate sector, where earnings might deliver a sizeable beat.”
“Pertinently, the beaten down US technology sector, where a sharp correction has endured over the past six months on AI disruption and CAPEX over investment fears, has now fully played out. We added technology bellwethers Microsoft and Meta Platforms (Facebook) to the portfolio with sizeable positions this week. With both MSFT and META down between 30 %and 40% and valuations trading at historical lows, we see a contrarian opportunity. We also have decent exposure to major Chinese technology companies, where we anticipate a similar rebound over the coming months.”
Microsoft has plausibly put in a double bottom at the April Liberation Day lows established last April.
The ASX release continued:
“Gold and precious metals continue to recover, and over the past several weeks. We see this trend continuing as the US dollar resumes a downward trend. The dollar was bought as a safe haven, but we see this trade receding on a ME ceasefire gaining traction – and as the White House soon resumes prioritising the domestic economy ahead of the Mid Term elections in November.”
“We expect gold and PGM miners, which were discarded by investors in March, to soon come back into vogue. The March ‘flush out’ was a healthy correction to what had become a frothy market with significantly overbought conditions. The aftermath of the ME war could plausibly intensify buying activity by central banks and large sovereign wealth funds. Commodities are another potential beneficiary of the conflict, as essential raw materials are stockpiled by nations. The ‘2020 pandemic’ and the ‘2022 and 2026 oil shocks’ have collectively taught many governments to pivot away from a globalisation narrative of ‘just in time’ to ‘just in case’.”
Moving on, the most important copper signal this week was not the price – it was the inventory data. Shanghai Futures Exchange copper inventories declined more than 30% from March 13 to 301,088 tons, while the Yangshan copper premium held at $65 a ton after hitting $69 on March 25 – the highest since June 2025. This systematic buying is occurring while copper prices remain below peak levels. China is replenishing copper stockpiles exactly as it did with oil and energy in prior shock episodes, and other governments caught under-prepared by the war are joining the queue for a metal increasingly treated as strategic infrastructure.
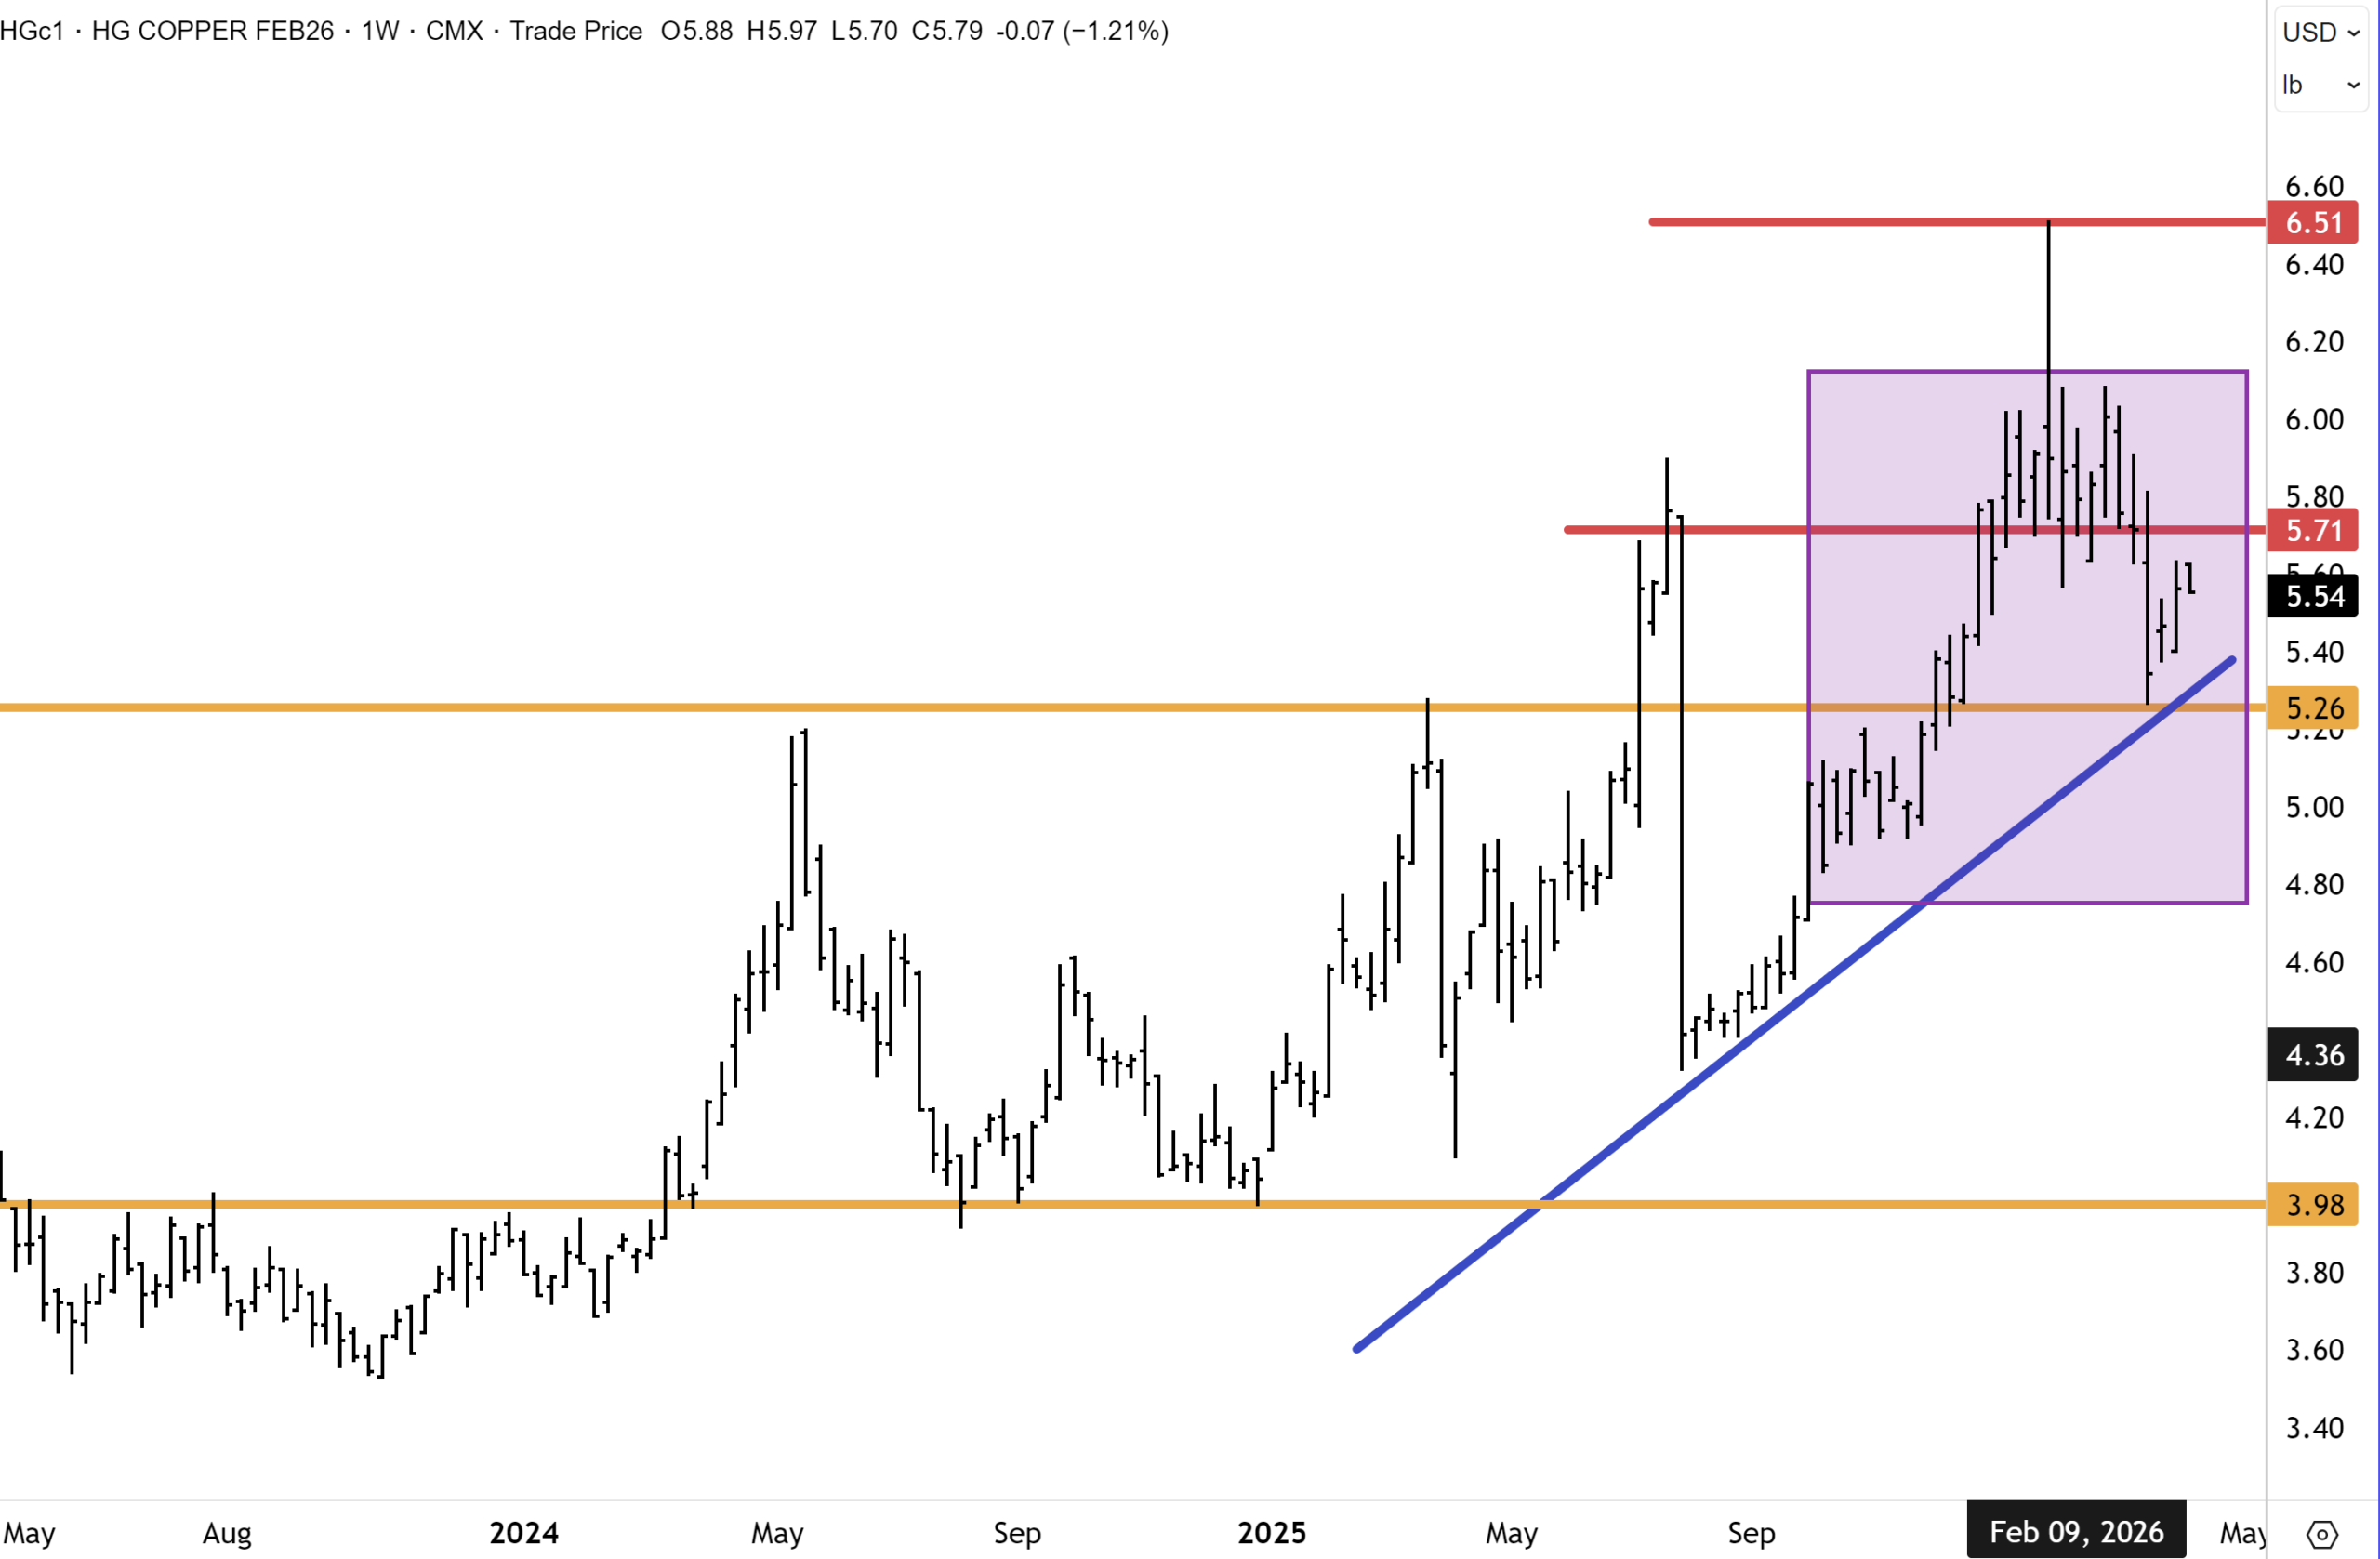
In terms of the chart setup, Comex copper prices have corrected from record highs above $6.50 back to the primary uptrend, in place since 2025. The technical bounce off key support at $5.25 (being the May 2024 high) was encouraging. Whilst resistance is clustered overhead above $5.70, we believe upward momentum will return quickly for copper when risk appetite resumes. Meanwhile, in recent weeks, we flagged buys on BHP, Rio, Antofagasta and Capstone Copper.
Japanese Banks
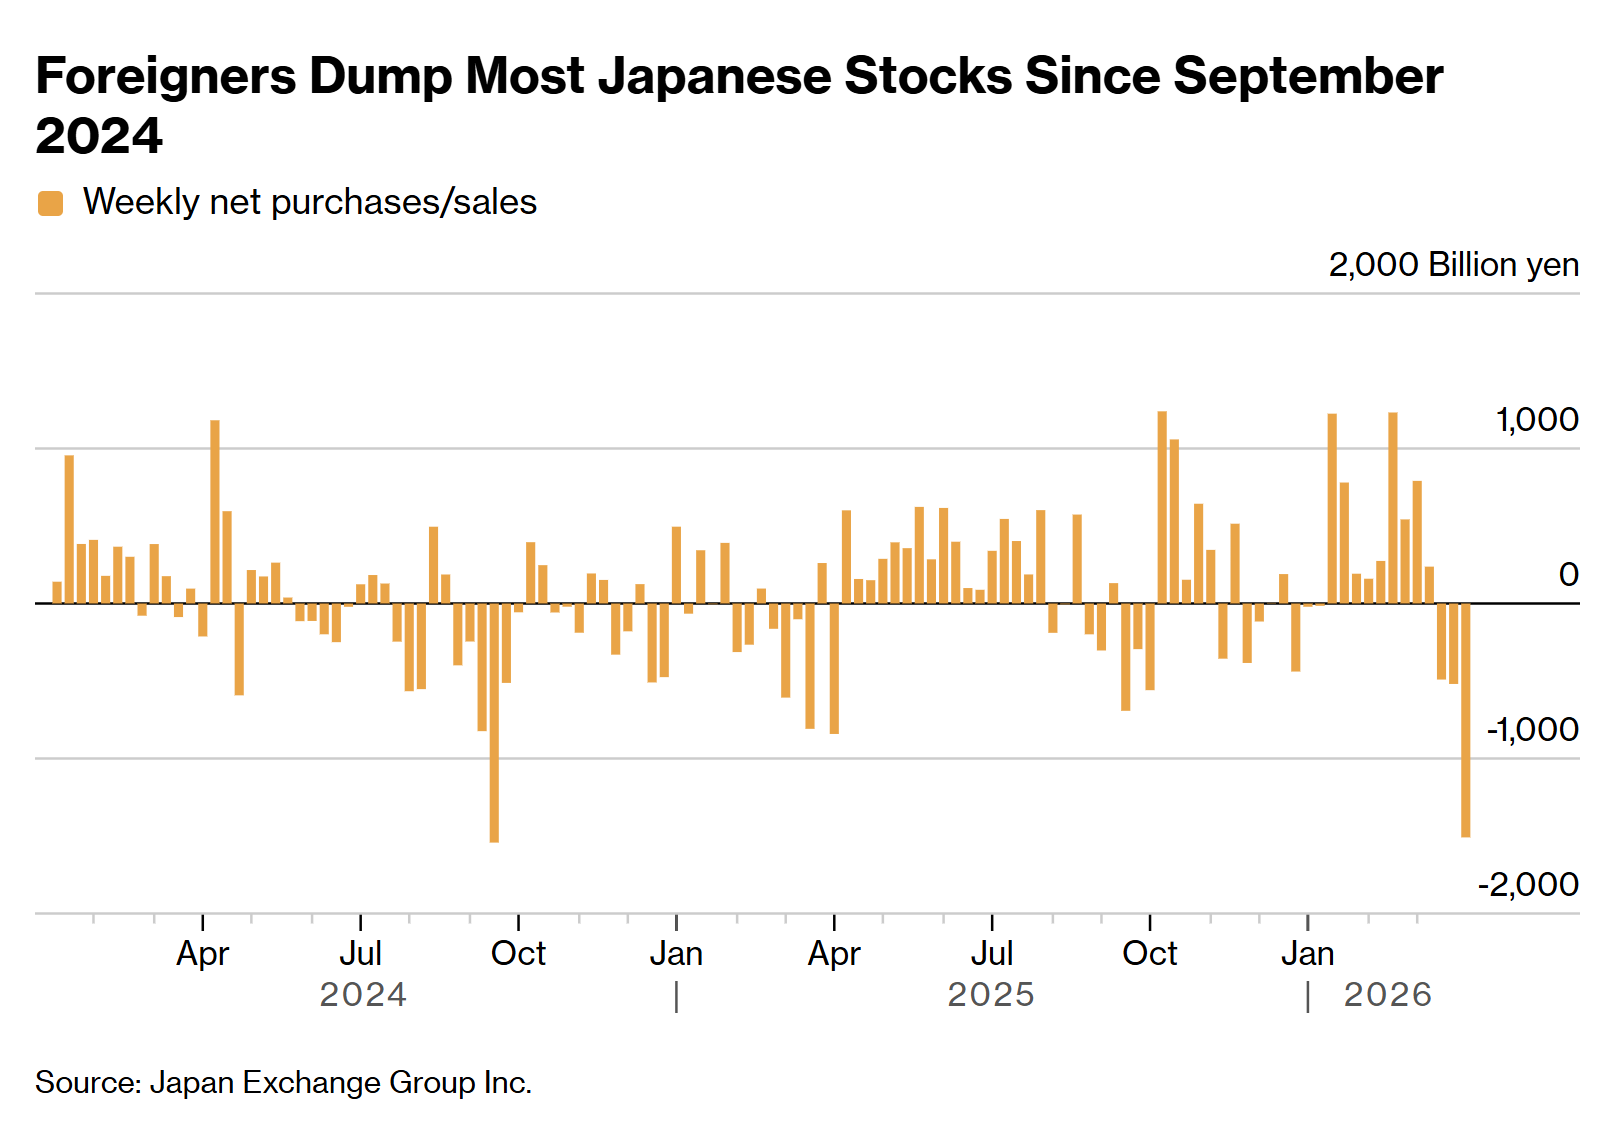
Another sector that screens as a buying opportunity is the Japanese banks, where a steepening yield curve (and rate hikes) will drive earnings momentum. Several contrarian buying signals are also flashing. Foreigners offloaded the most Japanese shares since September 2024 last week in another sign of growing fears about the impact of the Iran war on the Asian economy. However, similar to September 2024, the Japanese market is likely bottoming now.
According to Bloomberg, overseas investors dumped around ¥1.51 trillion ($9.5 billion) of Japanese cash equities on a net basis in the week ended March 27th. That marked the third straight week of selling after a lengthy streak of net buying. Both the Topix and Nikkei 225 benchmarks dropped more than 11% in March, which is the worst monthly performance since 2008. Nothing fundamentally has changed in Japan’s economy aside from the fact that the country imports most of its energy requirements.
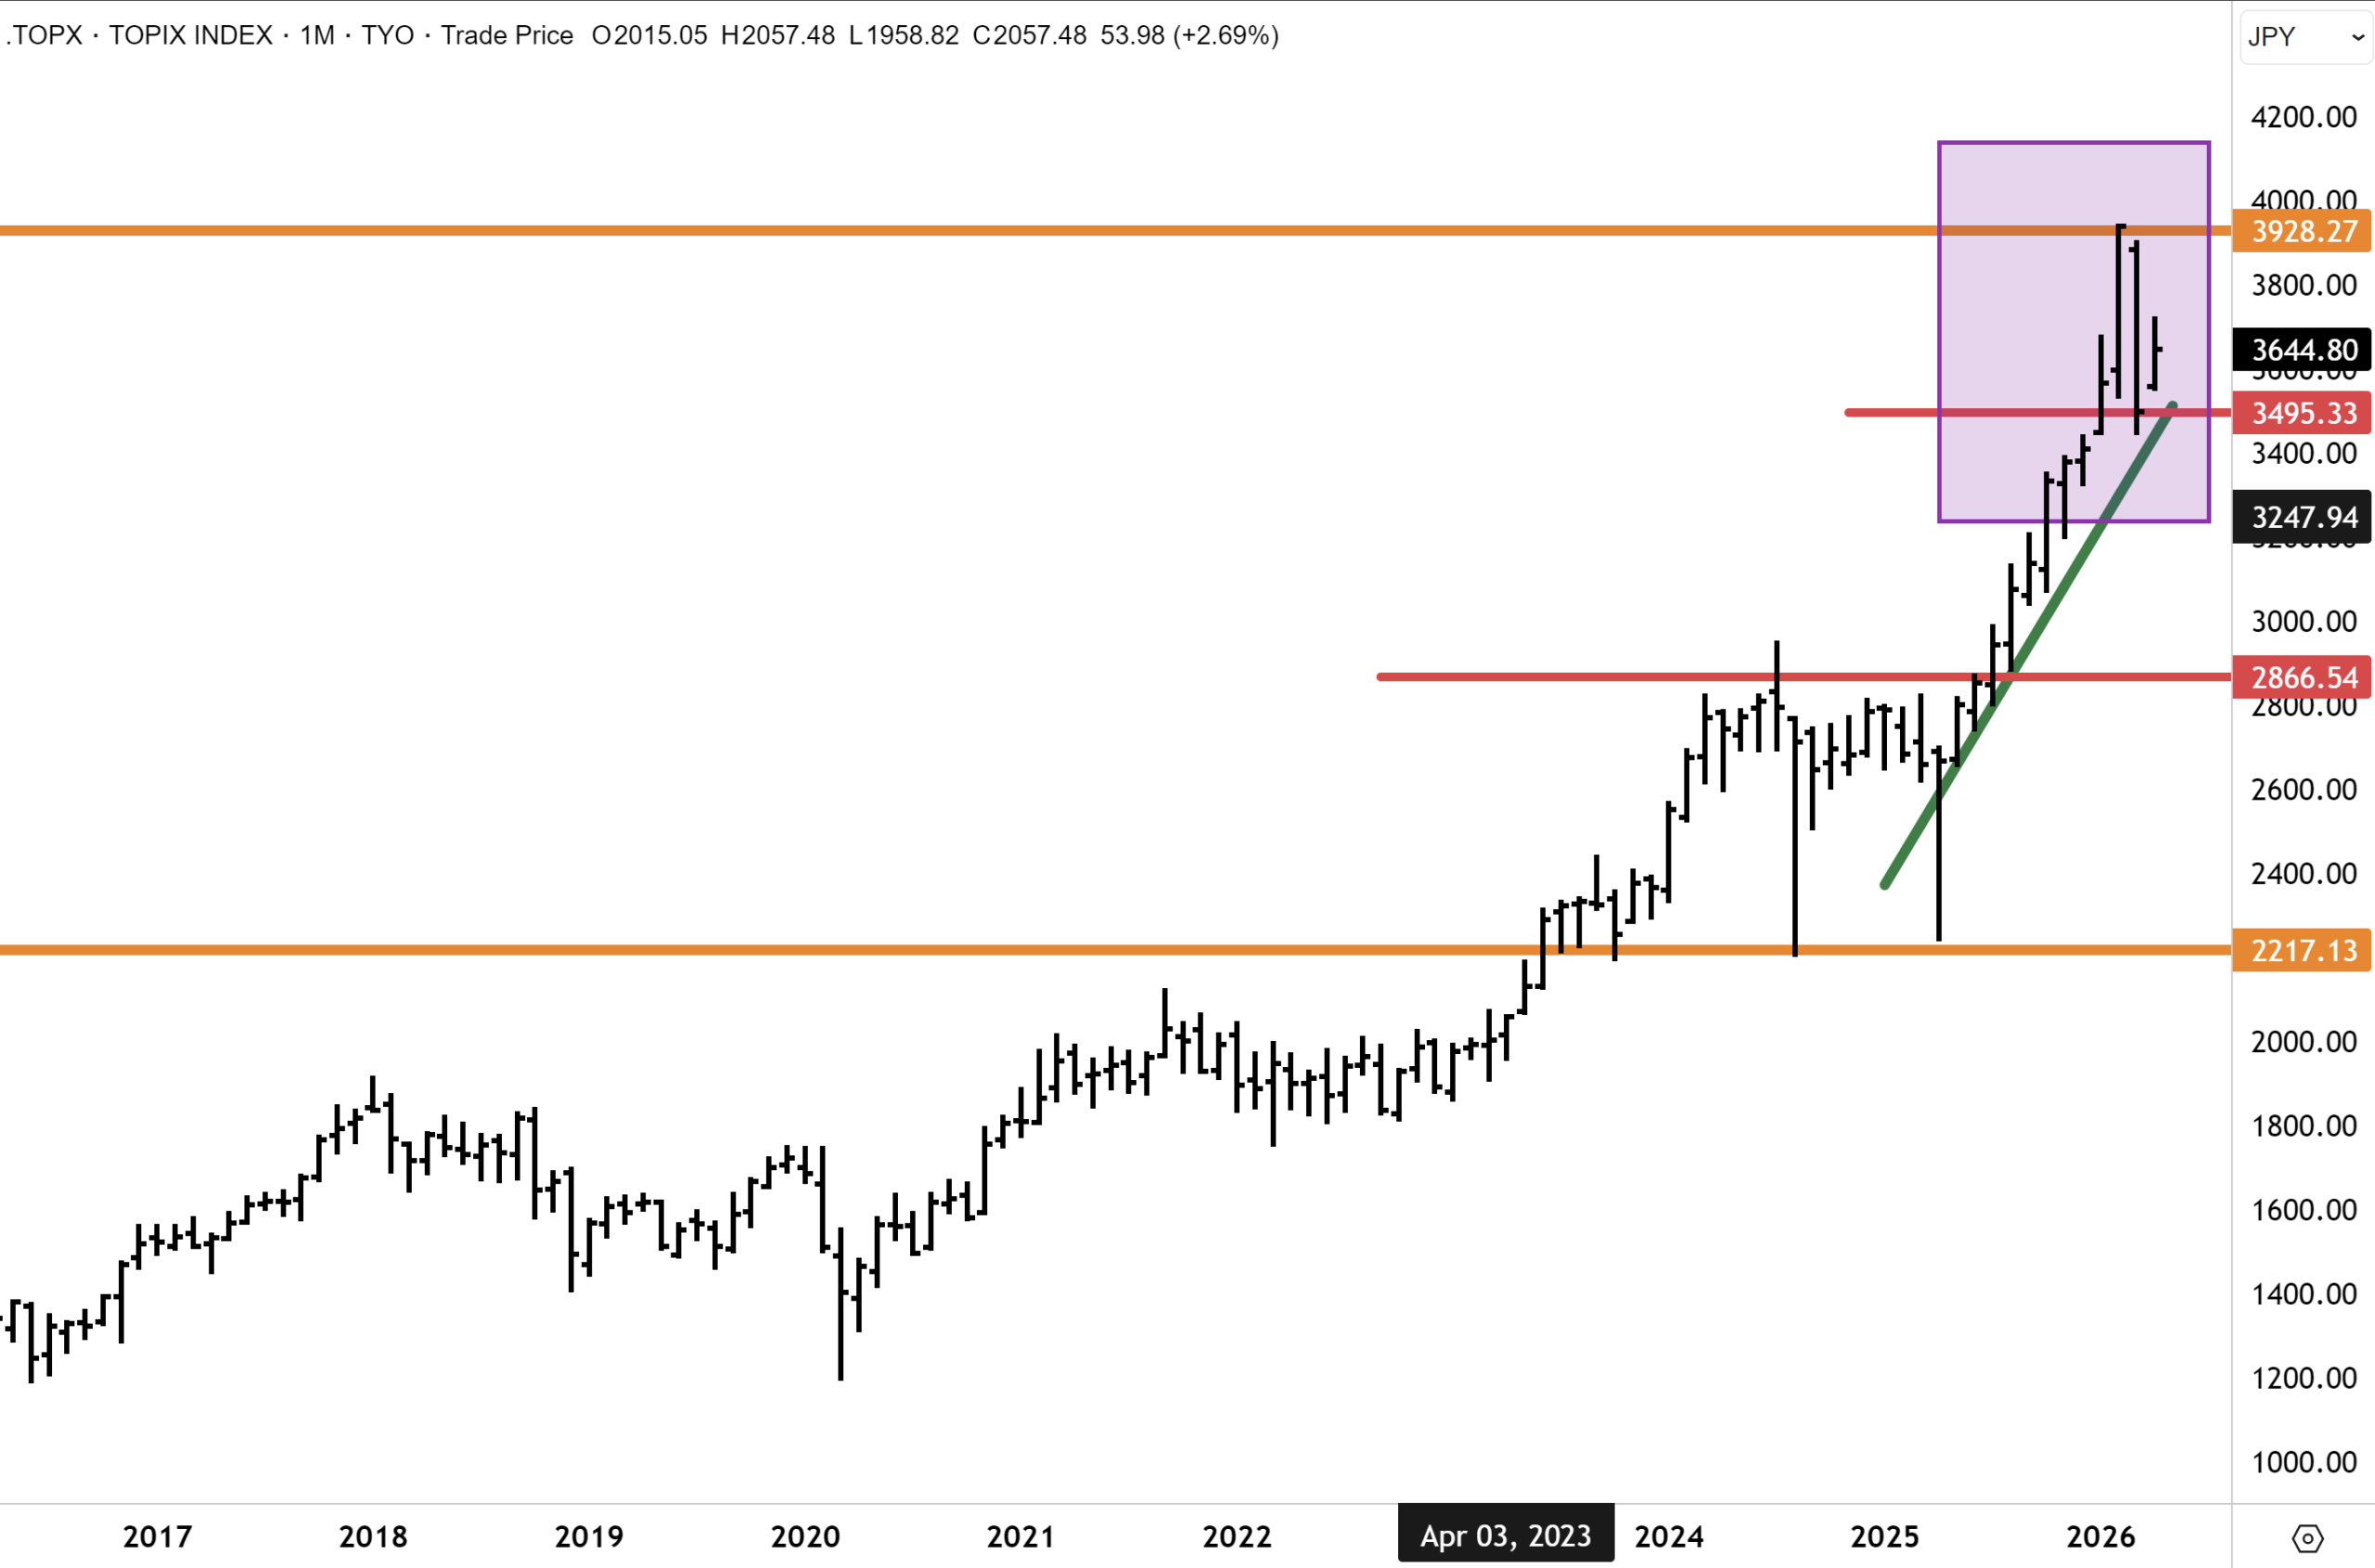
In terms of the TOPIX bank index, the benchmark has corrected c15%, returning to support at the primary uptrend. I anticipate upward momentum to soon resume and for the Bank index to retest the record highs within a year. We like the major banks, including Mizuho, Sumitomo Mitsui Financial Group and Mitsubishi UFJ.
A corollary closer to home is the Australian Banks. I noted earlier today that banks and financials rose 1.2% to touch a near-seven-week high on Thursday. All the “Big Four” banks rose between 1% and 2.2%. I have been saying for some time now that the main street brokers are missing the “cost out story” with Australian banks. The banks are rising not because revenues are growing (which is not really the case) but because of expanding profits due to “costs falling off a cliff”. AI and technology will continue to bring substantial cost savings to the major banks over the next five years. The market doesn’t fully see this yet and remains fervently focused on valuation. Bendigo has become the latest to announce a wave of redundancies.
The correct lens – profits expanding on falling costs even as top-line growth moderates – is the one that will dominate ASX bank earnings commentary over the next few years as AI-driven cost reduction compounds. The market doesn’t fully see this yet, though we have been bullish on the sector, with buy recommendations on selected banks in our Australasian report, one of which we discuss below. [link]

ANZ (ASX: ANZ) – buy
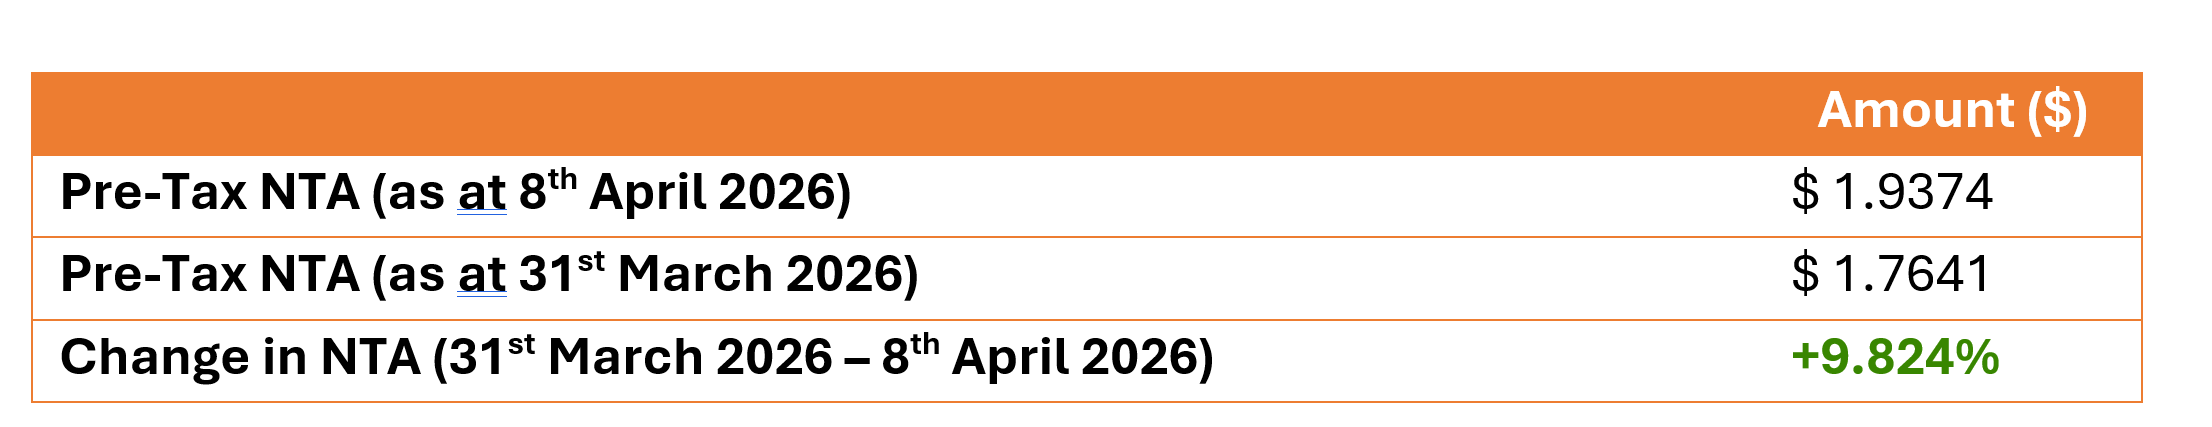
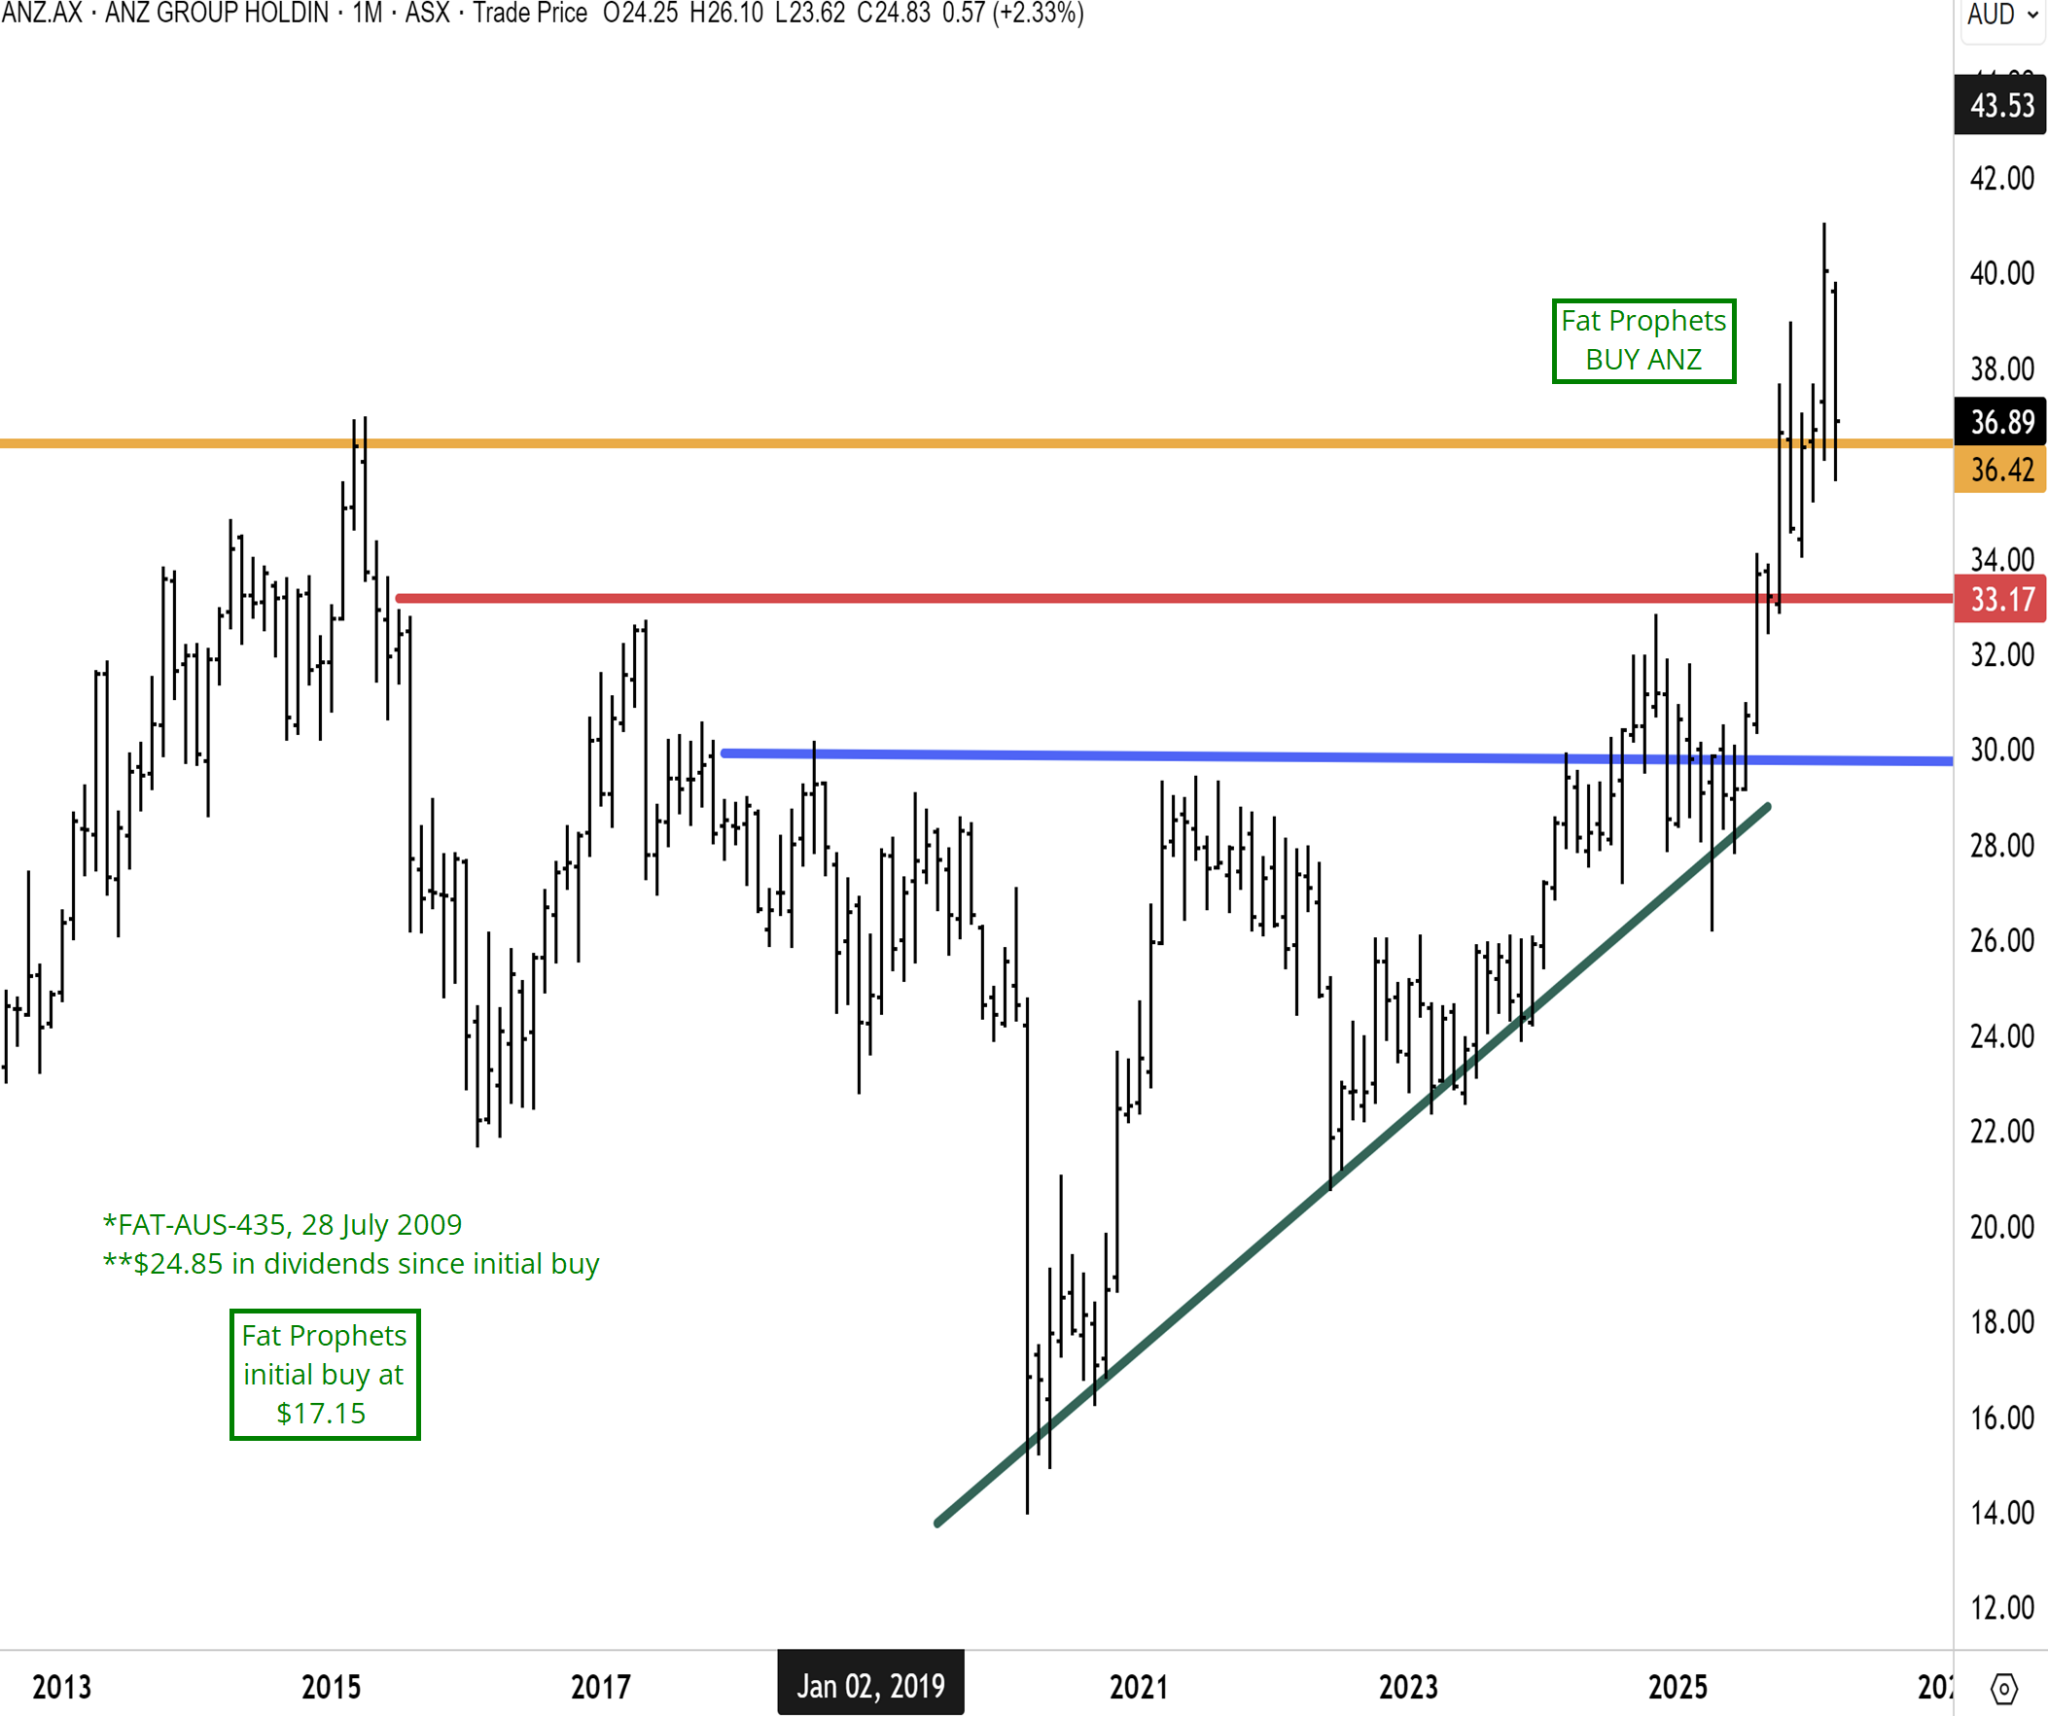
As noted above, we believe many brokers are underestimating the banks’ opportunities to strip out costs. ANZ is showing early execution on this front under a new CEO, and we see the trend having more legs. 1Q26 cash profit of A$1.94 billion came in well above the average quarterly run-rate from 2H25, with Group NIM edging up 2bps as operational deposits repriced favourably. CET1 sits at a comfortable 12.15%, providing a hefty buffer. Customer deposits grew 5% year-on-year to A$787 billion, and 90-day mortgage arrears of ~0.8% confirm the credit book remains clean. The technical picture is supportive, and we rate the stock a Buy.
Since ANZ broke out above the historic highs (established back in 2015), the shares surged to new record highs above $41. ANZ has corrected sharply back to $36.50 in March, which is in close vicinity to the historic breakout level, where we believe the shares will attract significant support. ANZ is in a new bull market in our view, following a decade of underperformance. We maintain a bullish technical outlook for ANZ and see the potential for additional upside extension over the coming year back towards the record highs – and possibly higher. We believe all the major Australian banks are now in bullish uptrends.
Want the Full Picture?
This fatLITE edition is a condensed version of our full weekly Wrap, which includes deeper positioning analysis and more targeted investment opportunities. A subscription also includes 4 daily market commentaries during the week and reports on stocks, ETFs and special reports spanning Australasia, Mining and Global Equities.
Have a great weekend.
Carpe Diem
Angus