A fist full of dollars
Since our March look at the iron ore market, the price has marched onward and is now trading around US$111 a tonne and up from the US$90 a tonne at the time of our last review. Over the past 12-months, iron ore has endured a US/China trade war and the ravages of COVID-19, with its beginnings in China, on the global economy and populace. We wrote at the time that “the iron ore price appears to be in a world of its own,” and this is especially so as China was a key participant in both, in many ways, damaging events. Our view has not changed since March, but certainly recent events and data reads have become tailwinds for the iron price. The following chart shows the 12-months iron ore price:
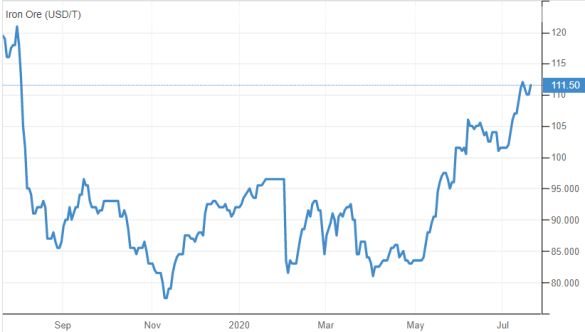
Source: Trading Economics
[emaillocker]
As Members can see from the above chart, since March the iron ore price has gained around 23%, which is a very pleasing outcome for iron ore producers, including Rio Tinto and BHP. Certainly, in the months from March, the US/China trade war has receded, although rhetoric from US President Donald Trump on this topic is never far away. While the COVID-19 pandemic, although still having an impact, investor focus has shifted to the economic remedies to counter the pandemic and there has been a shift of the virus epicentre away from China. Both these events have proven to be very beneficial for the iron ore price.
The remedies come in the form of stimulatory programmes, as governments globally attempt to counter the economic impact of COVID-19. The following chart shows the forecast impact of COVID-19 on the Gross Domestic Product (GDP) for the world and key economies for 2020 and recovery in 2021:
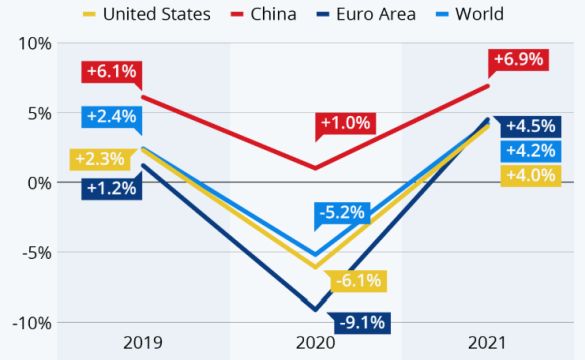
Source: World Bank
It has been estimated that the total stimulatory spend in 2020 is fast approaching US$10 trillion, with the aim of this spending to stimulate GDP into a classic “V” shaped recovery, as clearly seen in the above chart.
Governments focus stimulatory spending programmes on infrastructure as a means to generating useful and longer term employment for their populaces. As an example, when building the Hoover Dam in the Great Depression, the US Government purchased 45 million pounds of reinforcement steel, 21.7 million pounds of gates and valves, 88 million pounds of plate steel and outlet pipes, 6.7 million pounds or 840 miles of pipe and fittings, 18 million pounds of structural steel and 5.3 million pounds of miscellaneous metal work. There was 96 million pounds of steel and metalwork used in support of building the dam (there is 2,204.62 pounds in a tonne), and 4.5 million cubic yards of poured concrete was used in the dams’ construction. In preparation for building, some 5.5 million cubic feet of earth was removed from the site and 1.1 million cubic feet of material brought in. A total of 21,000 persons worked on the dam and importantly, it took five years to build.
These are the exact types of worker numbers and employment period that governments of today are looking for with their dollars. Importantly, for commodities more broadly and iron ore especially, the demand impact on commodities to feed such a project. The Hoover Dam cost US$49 million in its day, which is perhaps around US$1.0 billion in todays’ costs. The multiplier effect of the US$10 trillion that goes into infrastructure, on commodity demand, could not be clearer, and especially for steel and ultimately iron ore.
China, as the major producer of steel to the world has not experienced any drop off in steel production, as the trade war raged and was replaced by the COVID-19 rage. The following chart shows China’s annual steel production on a monthly basis:
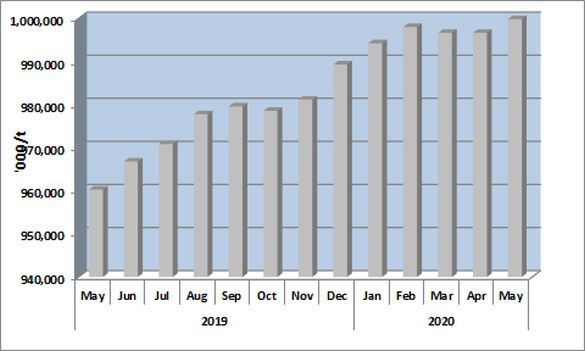
Source: World Steel Association
China’s steel production for the 12-months to May 2020 hit a record 999.8 million tonnes for a 4.1% increase year-on-year. Certainly, this growth rate is significantly higher than the annual 1.5% we had forecast for 2020. This is a great result, given that global GDP growth is forecast, by the World Bank, to be negative 5.2% for 2020 (see earlier chart of GDP forecasts). This growth has come as the global stimulatory spend is only just, we believe, getting underway, and if the Hoover Dam time frame fits, there is more years to come. Our expectation in March was to see such growth but not this earlier. There will be a moderation in growth in steel demand in the future, but we see this as being someway off, so China’s steel mills will plough ahead, we believe, for some years.
The rub-off for iron ore, with our scenario playing out, is shown in the appetite China has for importing the stuff on a monthly basis over the past 12-months:
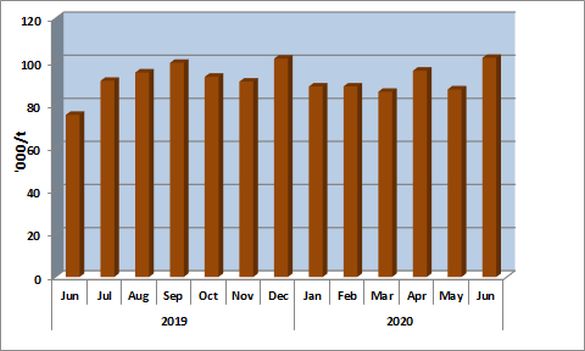
Source: China Customs
As Members can see from the above chart, there has not been any significant fall off in China’s demand for importing iron ore. China’s monthly imports of iron ore in the past 12 months has twice hit 100 million tonnes in a month, a feat reached only once before for the 12-months to January 2018, when the trade war was just a glint in Trumps eye and certainly no COVID-19. China’s peak appetite of 103 million tonnes of imported iron ore occurred in September 2017, with the latest May 2020 read sitting just below that at 102 million tonnes.
China’s steel industry has it appears passed unscathed, operationally, through the peak of the COVID-19 pandemic’s impact on that country. Although there are concerns of second waves impacting economies and physical operations including China, given how the Chinese steel industry navigated the initial and from ground zero outbreak, we expect a similar response outcome with any further outbreaks.
COVID-19 has been a global curse, but the remedies to repair the damage, economically, are now getting underway and this is what, we believe, is driving the iron ore price and will continue to do so well into the future. The next positive wave, economically and in human terms, will be a vaccine, the timing of which is for now unclear, but it will come.
Disclosure: Interests associated with Fat Prophets hold shares in Rio Tinto and BHP.
[/emaillocker]